


Services on Demand
Journal

Article
 English (pdf)
 Article in xml format
 Article references
 Send this article by e-mail
Indicators
Related links
-
 Cited by Google
 -
 Similars in Google
Share

 Permalink
Water SA
On-line version ISSN 1816-7950Print version ISSN 0378-4738
Water SA vol.51 n.2 Pretoria Apr. 2025
https://doi.org/10.17159/wsa/2025.v51.i2.4122
RESEARCH PAPER
Reduction of pollution levels in the Chatty River, Gqeberha, South Africa, through sustainable drainage systems: Bethelsdorp sub-catchment case study
Anabel Matalanga; Neil Armitage
Department of Civil Engineering, University of Cape Town, Private Bag X3, Rondebosch 7701, South Africa
ABSTRACT
Chatty River, located in Gqeberha, South Africa, is the largest tributary feeding into the Swartkops Estuary, and a major source of pollution. Its catchment is mainly occupied by low-income residential areas resulting in polluted stormwater runoff from litter and raw sewage discharge. This study employed both experimental and modelling approaches to assess pollution sources and mitigation options. Water quality sampling was conducted across various sub-catchments draining into the Chatty River, and subsequently Swartkops Estuary, to evaluate the physical, nutrient, and microbiological characteristics, revealing eutrophic and hypertrophic conditions and high gastrointestinal health risks to residents. Additionally, hydrological and hydraulic modelling were performed using PCSWMM (Personal Computer Stormwater Management Model) for the Bethelsdorp River sub-catchment. Various scenarios were developed to test the retrofitting of sustainable drainage system (SuDS) interventions for improving water quality. The model scenarios include: the 'As-Is' model representing the current situation; the 'Pre-Development' model representing the state before the influence of anthropogenic activities, and various retrofitted SuDS intervention models, including the reduction of pollutant concentration through the rehabilitation of historic wetland areas, a constructed wetland, a retention pond, and various infiltration practices. Rehabilitating the wetlands offered the highest impact in terms of water quality improvement, with a mean pollutant reduction of 30%. However, a combination of all the interventions had the highest pollutant removal when functioning efficiently, of 72% and 80% for dissolved inorganic phosphorus (DIP) and total suspended solids (TSS), respectively. Forming a treatment train was seen as the most effective strategy to adequately improve water quality in the catchment to meet the standards presented by various guidelines.
Keywords: Chatty River, water quality, sustainable drainage systems (SuDS), hydrology, PCSWMM
INTRODUCTION
The Swartkops Estuary is of enormous economic, ecological, and social importance in the Nelson Mandela Bay Municipality (NMBM) area, due to its relatively large size, diverse habitats, and biodiversity (Van Niekerk and Turpie, 2012). Studies by various scholars, inter alia, Pretorius (2015) and Adams and Riddin (2019), however, highlight that it experiences high levels of pollution which have affected the health ofthe estuary and the occurrence ofvarious social activities, such as traditional cleansing ceremonies by traditional healers and the Redhouse River Mile swimming event. The studies indicate that several points of entry into the estuary, including the Chatty River in Gqeberha, one of the largest tributaries of the Swartkops Estuary, are severely polluted. More information on the extent of pollution from the Chatty River catchment, leading to recommendations on measures that may improve the water quality in the river and, subsequently, the estuary, is required.
Sustainable drainage systems (SuDS) are water management practices designed to restore natural hydrological and geomorphic processes, and support pollutant removal (Woods-Ballard et al., 2007; Lim and Lu, 2015). They have become essential due to the impact of rapid population growth, heightened environmental awareness, and climate change (Goulden et al., 2018). Urban stream water quality is a growing global concern, particularly in rapidly urbanizing regions where impervious surfaces, such as roads and buildings, alter natural water cycles, leading to higher runoff volumes, degraded water quality, and increased flood risk (Kozak et al., 2020). Studies by Chen et al. (2019) and Liu et al. (2017) further justify the use of SuDS, demonstrating significant improvements in water quality through filtration, infiltration, and biological treatment processes in urban streams impacted by impervious surfaces. In cities where stormwater systems are inadequate, for example, parts of the Global South, SuDS serve as a critical intervention to mitigate pollution and support urban resilience. These systems reduce runoff volumes and peak flows, improve water quality, promote groundwater recharge, and provide ecosystem services by enhancing urban green spaces (De Oliveira et al., 2022; Mugume et al., 2024).
According to the South African National Water Act (Act No. 36 of 1998: RSA, 1998), the term pollutant refers to anything that directly or indirectly alters the physical, chemical, or biological properties of a water resource, making it less fit for any beneficial purpose for which it may reasonably be expected to be used, or is harmful or potentially harmful to the welfare, health or safety of human beings, any aquatic or non-aquatic organisms, the resource quality, or to property (RSA, 1998). Pollutants may have detrimental effects on human health, vertebrates such as fish and birds, and negatively affect ecosystems (Nel, 2014). The use of different and complementary removal techniques through the formation of a SuDS treatment train can achieve enhanced pollutant removal (Bastien et al., 2010). However, the improvement of water quality through SuDS varies from system to system and thus each system needs to be assessed to account for local variability and the treatment train optimised (Ahmed at al., 2019).
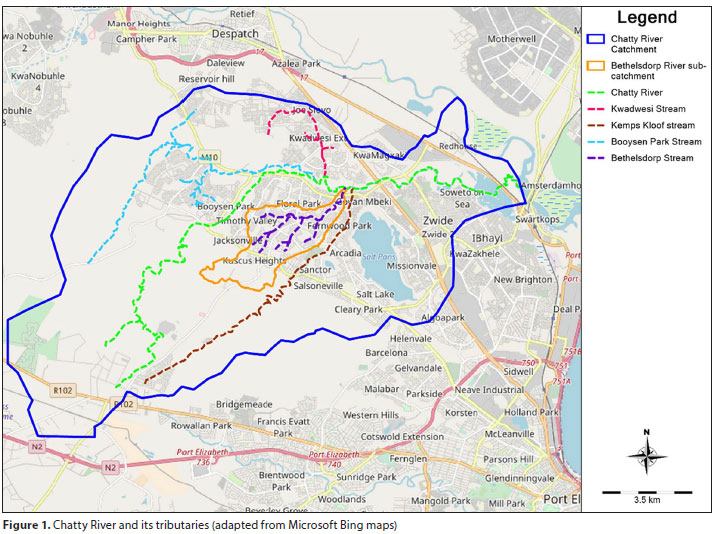
This study focused on the Chatty River catchment located in Gqeberha, South Africa, which is approximately 140 km2 (Fig. 1) and drains townships such as Bethelsdorp, Booysen Park, Soweto on the Sea, KwaMagxaki, Kwa-Dwesi and Zwide. It is primarily characterised by low-income residential land use with impervious surfaces estimated to cover approximately 31%. The Chatty River has an approximate length of 30 km. The Bethelsdorp River, approximately 6.5 km long and a tributary of the Chatty River, was used as a representative case study for the assessment of the potential impact of various modelled retrofitted SuDS on water quality.
Determination of the likely effectiveness of the modelled SuDS interventions in the Bethelsdorp River catchment (BRC) was undertaken using PCSWMM (Personal Computer Storm Water Management Model) (CHI, 2021). PCSWMM, widely used in South Africa, utilises the EPA SWMM 5 engine and offers advantages of various analytical tools and GIS representation (CHI, 2021). Moreover, PCSWMM offers accompanying tutorials, manuals, user forums, and an online index help file which provide extensive information and guidance (James, 2005). SWMM is a dynamic rainfall-runoff simulation model used for a single event or long-term simulation of runoff quantity and quality (Bahaya et al., 2019). The software consists of routing and runoff components and is suitable for an urban environment. It can track the flow rate, flow depth and water quality of the stormwater at each time step.
Various critical water quality parameters were examined including total suspended solids (TSS), dissolved inorganic phosphorus (DIP), and dissolved inorganic nitrogen (DIN), which are indicators of eutrophication risk and pollutant load.
Elevated levels of these parameters degrade water quality and pose health risks, underscoring the need for effective management. By targeting pollutants through a treatment train of SuDS interventions, this study demonstrated how water quality standards can be met through the application of SuDS, reducing environmental risks, and restoring the health of urban rivers, offering a model for similar regions facing rapid urbanization and environmental degradation.
MATERIALS AND METHODS
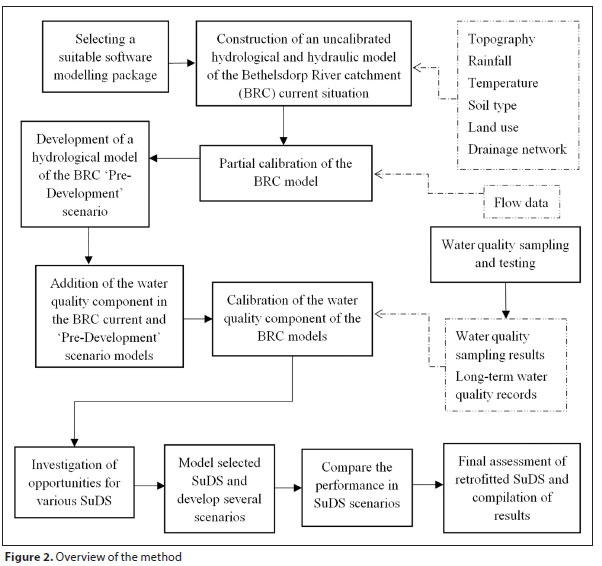
An overview of the method is presented in Fig. 2. The study was initiated by a water quality assessment of the Chatty River to determine the extent of pollution. A Chatty River catchment (CRC) model was developed in PCSWMM to assist with this after which the remainder of the assessment was carried out in a model of the Bethelsdorp River catchment (BRC).
Hydrological modelling of the Bethelsdorp River catchment
PCSWMM (build 7.5.3406, released May 2022) was used in the development of the deterministic models in the Bethelsdorp River, a representative tributary of the Chatty River. Scenarios developed for this study were the current situation ('As-Is'); the likely 'Pre-Development' situation representing the state before the influence of anthropogenic activities; and various retrofitted SuDS interventions.
Data acquisition and processing
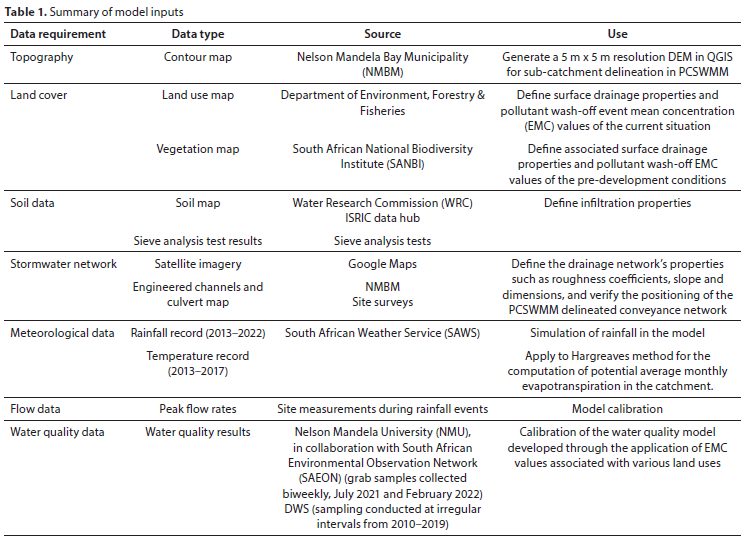
Model input data were collected through a desktop study, literature reviews and site inspections. The data (Table 1) were processed to the appropriate formats required in PCSWMM using Excel (Microsoft Corporation, 2022) and QGIS (2022) where necessary.
Topography
Topographical data were required for the sub-catchment delineation. A 1 m contour map for the CRC was processed in QGIS to facilitate the development of a 5 m x 5 m resolution digital elevation model (DEM) suitable for use in PCSWMM. Then the drainage network was added with the natural river course cross-sections determined from the topographical data using the transect tool. Satellite imagery was used to verify the positioning of the drainage network.
Land use and soil type
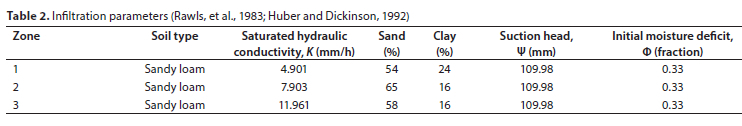
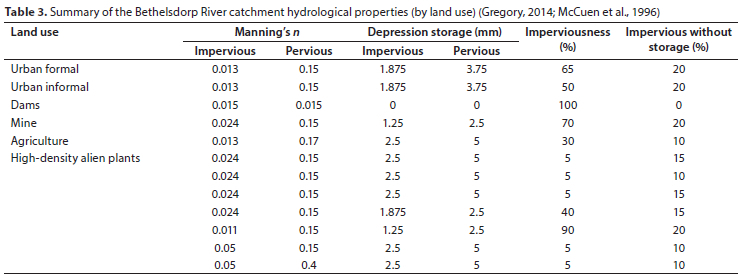
Soil type and land cover (Tables 2 and 3) determined the drainage and infiltration sub-catchment properties to model rainfall-runoff relationships. Municipality records and geospatial data were useful in determining the channel materials and properties such as roughness coefficients.
Meteorological data
Rainfall and temperature data were processed and entered into PCSWMM. For modelling purposes, it is necessary to have a rainfall time-step increment that is shorter than the catchment's response time to rainfall. As the BRC time of concentration, Tc, was approximately 10 min, the PORT rain gauge (Fig. 3) data, with a 5-min resolution and closest to the catchment, was used. The temperature data were used to process potential evapotranspiration data in the catchment using the Hargreaves method (Hargreaves and Allen, 2003).
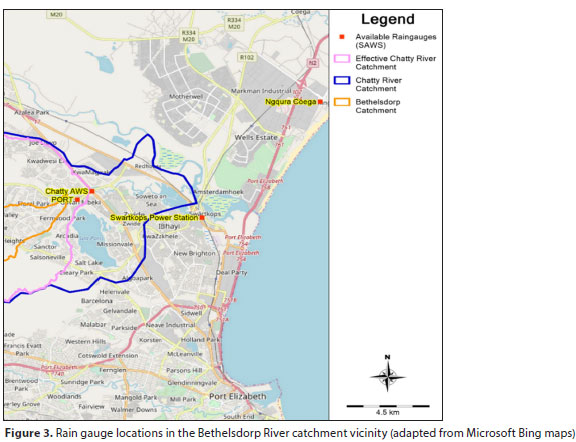
No data were available for the PORT rain gauge from August 2016 to April 2019. The Chatty AWS rain gauge data with a time resolution of 1 hour was therefore disaggregated and used to fill this gap. The annual rainfall data were compared between the two rain gauges on Excel to confirm the overlap between Chatty AWS and Port rain gauge. The Ngqura Coega rain gauge was identified as suitable for disaggregating hourly to 5-min data using the freely accessible software, NetSTORM. This uses the continuous disaggregation algorithm developed by Ormsbee (1989) to produce synthetic high-frequency data from hourly precipitation data (CDM, 2008).
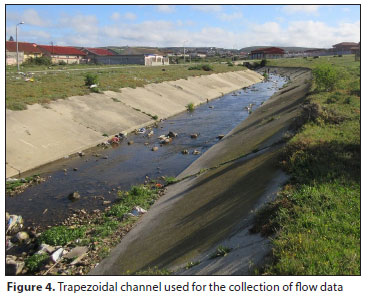
Flow data
Flow data were collected for the partial calibration of the BRC As-Is' model in PCSWMM. The site chosen (Fig. 4) had a regular cross-section that was expected to have steady uniform flow during storms. The floor and sides of the channel were marked up with a spray-painted ruler to indicate flow depth. Peak discharge was determined from the peak flow depth using the slope-area method where the Manning equation was used to determine the volumetric flow rate.
Peak flows observed at the flow measurement site (outside the BRC) matched peak flows modelled in the 'As-Is' CRC model which then enabled partial calibration of the BRC model using extracted data.
Hydrological model construction
Sub-catchment delineation
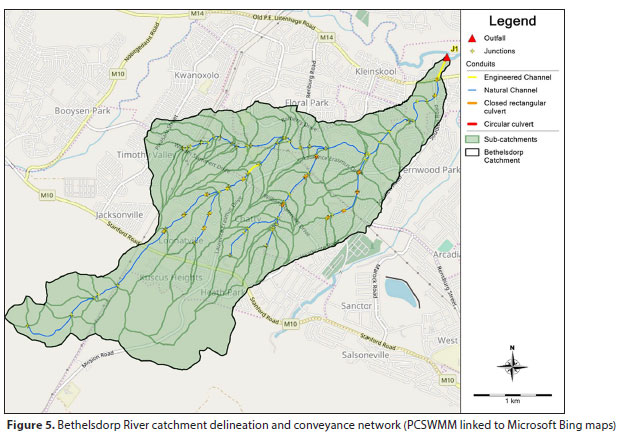
The Bethelsdorp River catchment (BRC) has an approximate area of 9 km2 (Fig. 5). It was delineated into 75 sub-catchments with a mean area of 0.1 km2.
Representative sub-catchment surface cover parameters, imper-viousness, roughness, depression storage and infiltration were extracted from the underlying GIS land use and soil databases using look-up tables. The Spatial Weighting tool in PCSWMM was used to define the weighted average parameter values related to land use, vegetation and soil, based on their area fraction for each sub-catchment. The slope and length of each sub-catchment were established with the assistance of the Watershed Delineation tool (WDT) provided in PCSWMM, using topographical data in the form of a DEM and informed by field surveys and satellite imagery of the study area. The flow path lengths so determined were divided into the sub-catchment area to establish the sub-catchment width, an input parameter in PCSWMM.
Runoff' that was not infiltrated was directed at the lowest point into an outlet. Due to the absence of stormwater network maps of the study area, the sub-catchments were determined from existing delineated catchment maps provided by the NMBM that had been developed for a review of the 1:50 and 1:100-year flood lines in the Chatty River (SRK Consulting, 2015).
The modified Green-Ampt method was applied to the sub-catchments as, unlike the Green-Ampt method, the modified Green-Ampt method retains the moisture deficit in the topsoil layer during initial periods of low rainfall (Rossman and Simon, 2022).
Conveyance network
The drainage network of pipes, culverts, and channels were modelled as conduits in PCSWMM. These were linked through a series of junctions. Flow from each sub-catchment was directed to a junction placed at its lowest point.
Dynamic wave routing was chosen for this project as it caters to systems with flow regulation via weirs and orifices, elements used in SuDS modelling. Furthermore, compared with steady flow and kinematic wave routing, this option produces the most theoretically accurate results as it solves the complete one-dimensional Saint Venant flow equation (Rossman and Simon, 2022). Dynamic wave routing methods require relatively smaller hydraulic time steps to maintain numerical stability compared with other routing methods, hence longer run times (CHI, 2022). The hydrological timesteps, the 'wet weather' and 'dry weather' time steps, were defined as 1 min and 15 min, respectively, whereas 5 s was used for the hydraulic routing timestep.
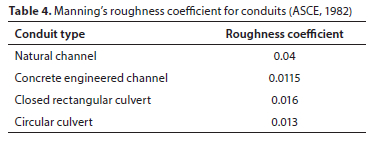
Manning's roughness coefficients, n, were assigned to all conduits as detailed in Table 4 using reference tables in ASCE (1982).
Sensitivity analysis and partial calibration
Sensitivity analysis
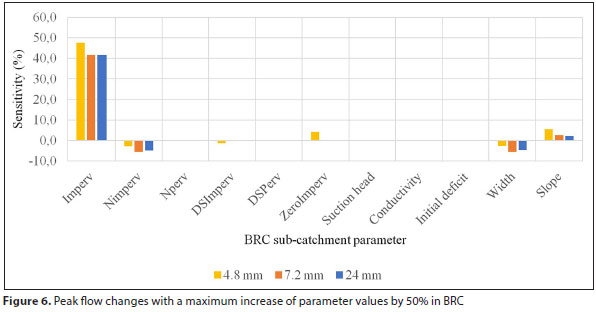
An event-based sensitivity analysis (Xu et al., 2019) was undertaken for the Kroneberg Drive monitoring station at Site 14 (Bethelsdorp) to assess the influence of sub-catchment runoff' and infiltration parameters on peak flow and volume. This was an essential step in the modelling process as only a partial calibration of the catchment could be carried out in this study. The sub-catchment parameters influencing surface runoff' volume - width, slope, imperviousness, roughness, and depression storage - were included in the sensitivity analysis as they were estimated from published data, watershed delineation and field observations. Also included were the Green-Ampt infiltration parameters, suction head, saturated hydraulic conductivity, and initial moisture deficit (Xu et al., 2019). A small storm that generated no pervious runoff' (4.8 mm on 2013/03/31 and lasting 14.2 h), a slightly bigger storm (7.2 mm on 2022/05/19 and lasting 17.7 h), and a much bigger storm (24 mm on 2021/07/21 and lasting 18.9 hrs), were selected for the sensitivity analysis using the Events tool on PCSWMM. The Sensitivity Radio Tuning Calibration (SRTC) tool was then to assess the influence of the change of each parameter in turn, while the other parameters remained unchanged. A default range of +50% to -50% of the initial value, as proposed by Liong et al. (1995), was used.
Peak flows were most sensitive to the percentage of impervious area (Imperv) (Fig. 6). They were insensitive to changes in the pervious parameters (Nperv and DSPerv) and the infiltration parameters - suction head, saturated hydraulic conductivity, and initial soil moisture deficit. The sensitivity to changes in Manning's coefficient for impervious area and sub-catchment length was relatively small.
By way of contrast, runoff' volume was less sensitive to runoff' parameter changes than peak flow for all parameters except DSImperv. Despite negligible changes to the peak flows, the depression storage for impervious areas and the percentage of impervious areas with no depression storage altered the initial flow values, thus changing the total flow volumes. The impervious area percentage was the most sensitive parameter. Flow volume had a relatively low response to changes in sub-catchment slope, length, and Manning's coefficient for the impervious area.
Calibration
Calibration is a process carried out in PCSWMM to optimise the parameters used in the model so that the simulated results best match the observed response (James et al., 2010). Since only a limited number of observed peak flows were available for calibration, only a partial calibration could be undertaken. The calibration parameters used were those which had the most influence on the peak flow and flow volume, viz., sub-catchment length, slope, percentage imperviousness, Manning's coefficient for the impervious area, depression storage for the impervious area, and percentage impervious area with no depression storage.
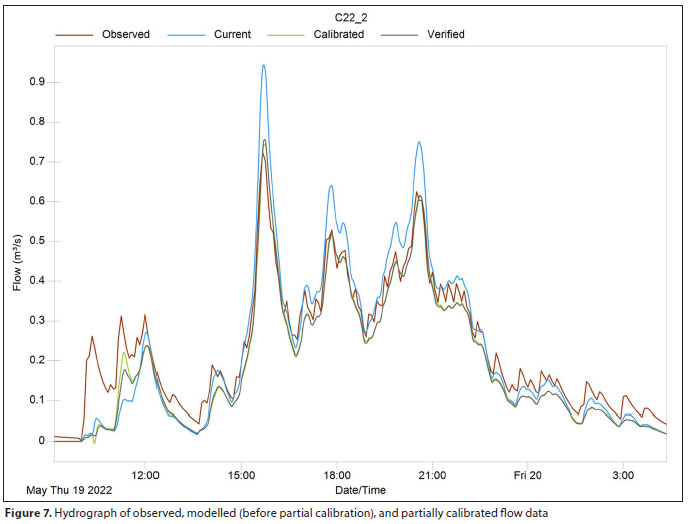
Due to the similarity in peak flow values between the modelled CRC and observed peak flows at the time of data collection, and in the absence of an observed continuous flow time series for calibration, the CRC 'As-Is' model time series for the 7.2 mm storm event (2022/05/19, 17.7 h) was chosen for an event-based calibration of the Bethelsdorp River catchment 'As-Is' model.
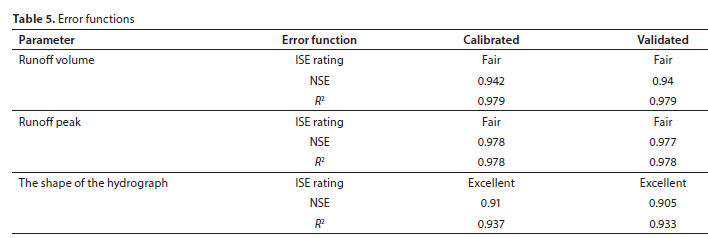
The goodness-of-fit was assessed using the integral square error (ISE), Nash-Sutcliffe efficiency (NSE) and the coefficient of determination (R2) error functions. According to Niazi et al. (2017), error function ratings, NSE and R2, are typically above 0.6 for calibration and validation. Shamsi and Koran (2018) recommend an 'excellent' ISE rating for final design, a 'good' rating for preliminary design, and a 'fair' rating for planning. They suggest an NSE of 0.5-1 as sufficient for models used in planning, preliminary design, and final design. The partial calibration was therefore considered acceptable based on the error function values listed in Table 5. The final verified hydrograph is shown in Fig. 7.
'Pre-Development' scenario model
The model was used to estimate the runofl' and pollutant loads before human intervention. In the absence of historical data, the 'As-Is' BRC model was used as a basis for the development of the 'Pre-Development' BRC model but with the land cover and drainage network properties likely associated with the natural conditions in the catchment. The 'As-Is' engineered channels were converted to natural channels using sections obtained from the available DEM. No calibration could be undertaken.
Water quality analysis
As this project aimed to estimate the potential for SuDS measures to improve the water quality, water quality sampling and testing of the sediment and nutrient loads formed the basis of the water quality modelling.
Water quality sampling and testing
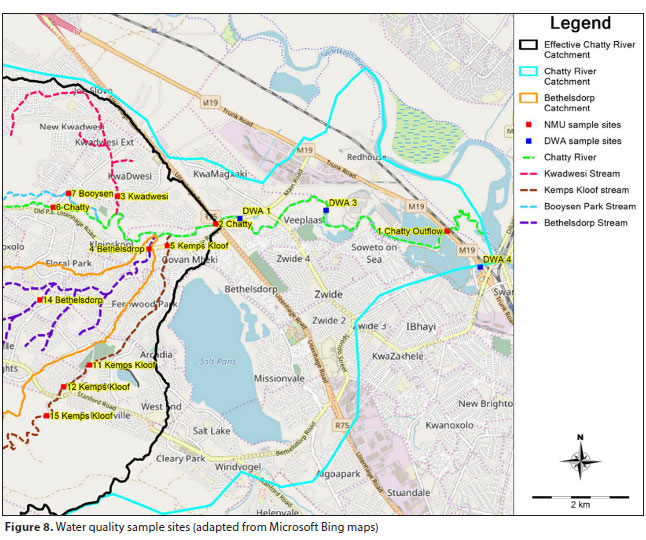
Water quality sampling and testing were carried out biweekly between July 2021 and February 2022 in the Bethelsdorp River catchment at two sample sites along the stream (Sites 4 and 14, Fig. 8) to assess the extent of pollution during the study period and build on existing water quality records. Grab samples were collected from the stream and tested for total suspended solids (TSS), Escherichia coli (E. coli), dissolved inorganic phosphorus (DIP), and dissolved inorganic nitrogen (DIN) in the laboratory. A YSI ProDSS Multiparameter Digital Water Quality Meter was used for the in-situ tests for salinity, dissolved oxygen (DO), turbidity, electrical conductivity (EC), and pH.
As the sampling was undertaken biweekly in dry conditions, the results reflect long-term pollution loads that may not describe the short-term dynamics found in the first flush, i.e., the initial runoff that is likely highly contaminated. Furthermore, water quality was affected by point-source pollution sources, such as a damaged manhole and undocumented land use, e.g. cattle grazing.
Water quality in PCSWMM
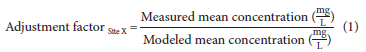
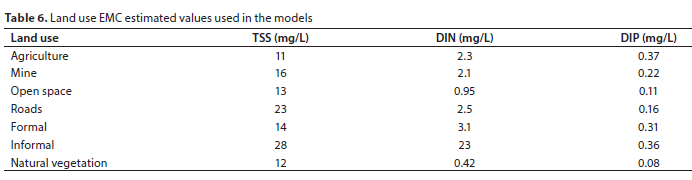
A water quality component using event mean concentration (EMC) values associated with land cover was added into the PCSWMM model. The pollutant indicators modelled were: total suspended solids (TSS), dissolved inorganic phosphorus (DIP) and dissolved inorganic nitrogen (DIN). TSS is a good measure of pollution as it provides an estimate of the overall concentration of solid particles in the water which are potential carriers for pollutants such as heavy metals and other pollutants associated with suspended particles. DIP and DIN are indicators for the nutrients implicated in eutrophication. Preliminary EMC values, derived from literature (Line et al., 2002; Cerfonteyn and Day, 2010; Chow et al., 2013; Song et al., 2019; Wicke et al., 2021), were adjusted using water quality data from the sampling test results using Eq. 1. The final EMC values used in the model are shown in Table 6.
SuDS scenario development
SuDS simulation in PCSWMM
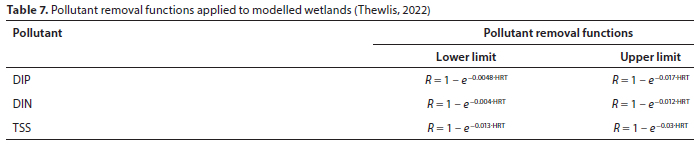
For this project, wetlands and ponds were modelled using storage units in PCSWMM, as was done by Gregory (2014) and recommended by James et al. (2010). Several treatment expressions are recognised in SWMM. This project adapted the k-C* model, a first-order decay model, for pollutant removal. The first-order decay model is a treatment expression commonly used in the treatment performance of wetlands (Rossman and Huber, 2016). It enables estimation of pollutant reduction based on hydraulic retention time (HRT), which is influenced by the inflow and storage characteristics of the wetland or pond. Hydraulic retention in wetlands promotes sedimentation, adsorption, and biological uptake of nutrients, which are crucial for pollutant reduction (Kadlec and Wallace, 2008). In the absence of local data, decay functions developed by Thewlis (2022) from data collected from various international studies (Table 7) were used to model the impact of wetlands and ponds on water quality with respect to the HRT. Any physical differences between Gqeberha and the international sites were accommodated by applying upper and lower treatment limits in the model and reporting on the range of potential treatment. Upon completion of the long-term simulation (2013-2022), the water quality removal was compared to the mandated removal percentages required by the City of Cape Town (2009) 'Management of urban stormwater impacts policy' in the absence of a Gqeberha-specific guideline.
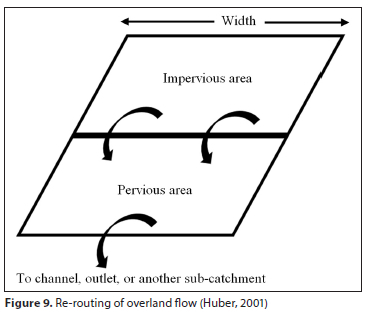
Infiltration practices were modelled through re-routing overland flow in the manner shown in Fig. 9. Runoff from impervious areas was routed to pervious areas where infiltration interventions, for example, rain gardens, bioretention areas, permeable pavements, infiltration trenches, etc., might be located. The WDT was used to identify the contributing areas for the proposed SuDS interventions. The impervious area percentage for each contributing sub-catchment was measured using satellite imagery (Google Maps, 2022). The percentage of runoff from impervious areas routed to the pervious areas was varied up and down by 10% to give an indication of likely range.
SuDS measures treat polluted stormwater using a water quality volume (WQV) that is usually sized to fully accommodate the runoff from frequent storm events only, as this accounts for most of the pollutant discharge while keeping costs down (Smart, 2020). Hatt et al. (2007) recommends using design storm events, such as the 1-in-6-month 24-h event, to determine the WQV. PCSWMM was used to autogenerate events from the PORT rain and interpolate the return periods. The PCSWMM 1-in-6-month rainfall depth, P, of 34 mm was then used for the model in the form of a 24-h Soil Conservation Service (SCS) Type I distribution storm event (Weddepohl, 1988). The additional volume in the conceptual ponds and wetlands, over the permanent depth caused by the 1-in-6-month storm, is the temporary storage depth. The temporary storage time was limited to 24 h as recommended by Armitage at al. (2013), to allow for the storage unit to be emptied ready for a potential next storm. The release of the WQV was modelled using the orifice equation, while the weir equation was used for overflows. The overflow depth was maintained within the recommended depths, that is between 250 and 400 mm (Armitage et al., 2013).
The permanent storage depths for various ponds and wetlands differed from site to site based on the location and site characteristics. A simulation from 2013 to 2022, using the rainfall time series from the PORT rain gauge, was undertaken to ensure that the maximum allowable emergency overflow depth was not exceeded.
SuDS scenarios
Scenario 1 - upstream constructed wetland
A natural ponding area was identified as a potential location for a constructed wetland in the Bethelsdorp catchment and modelled in PCSWMM using the storage creator tool. As the river flows through this naturally ponding area, the constructed wetland was modelled to be within the natural channel (Fig. 10), as guided by the existing topography.
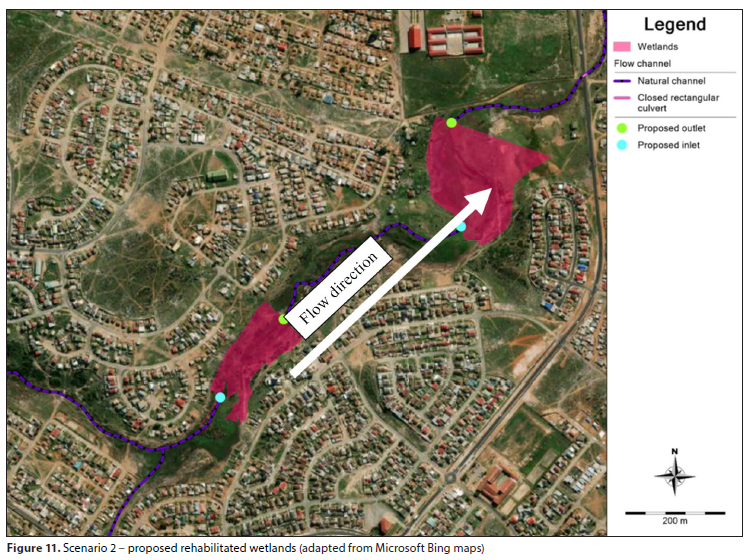
Scenario 2 - rehabilitation of wetlands
Channelled valley-bottom wetland areas in the catchment were identified from the South African National Biodiversity Institute (SANBI) Archived National Wetland Types database. Only a small portion of these historic wetlands were observed on site. The presence of several human pathways indicated the need to consider the movement of people should any interventions go ahead. The area shown in Fig. 11 was desirable as it neighboured the Kleinskool Community School where the development of wetlands could serve as an educational opportunity.
The rehabilitated wetlands were conceived as regional controls that aimed to improve the water quality of runoff from the relatively large catchment. Due to existing infrastructure and encroachment of urban development in the floodplain, the historical outline and shape of the wetlands, recorded by SANBI, could not be replicated exactly in the conceptual scenario. Furthermore, since the topography was relatively steep, the wetlands were modelled as having dam walls with a maximum height of 2 m.
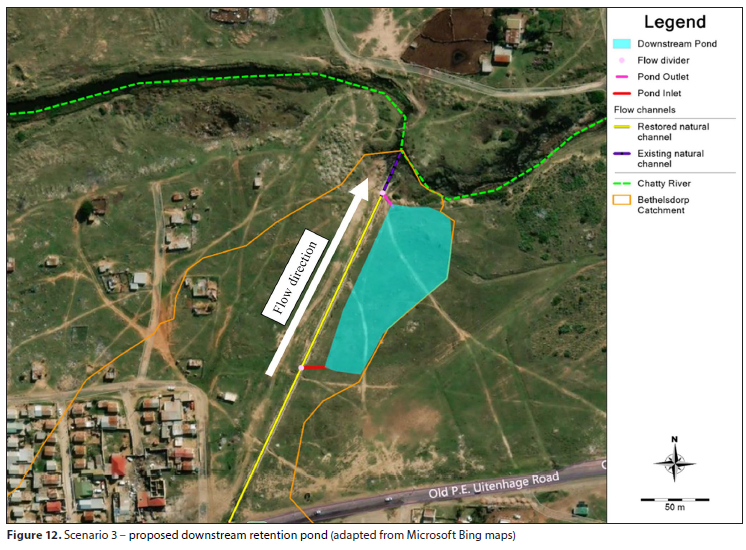
Scenario 3 - downstream retention pond
A downstream retention pond (Fig. 12) was identified as the final opportunity to capture pollutants from the Bethelsdorp catchment. Currently, a semi-circular concrete channel directs runoff out of the catchment and into the Chatty River. Although the channel side slopes are vegetated, constructing a concrete base was a missed opportunity for infiltration, treatment, and attenuation of the flow out of the catchment and into the Chatty River. The surrounding area is low-income residential and undocumented land uses, such as grazing, were observed at the site.
As the area is relatively flat, some excavation would be required to fully develop the ponded area. The concrete channel was thus modelled as a rehabilitated natural channel. Rehabilitation of the stream may be implemented with the assistance of riprap to stabilize the slopes. The pond on the right side of the natural stream was conceptualized to capture low flows, making up the water quality volume (WQV). A flow divider may be used at the inlet to prevent the risk of flooding and bypass larger flows through the stream and into the Chatty River. The pond may require fencing as it could be a potential safety risk in the residential area.
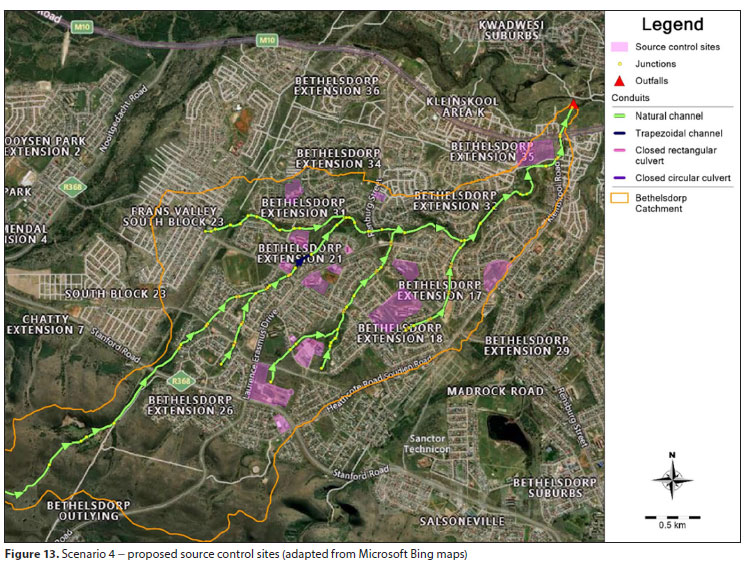
Scenario 4 - infiltration practices
Scenario 4 simulated the use of source and local controls by routing flows from the impervious areas to designated pervious areas. Sub-catchments containing unused areas, lawns, or parking spaces were targeted for this, resulting in 15 sites (Fig. 13). The total area which could potentially be occupied by the infiltration interventions in the sites within the catchment was estimated to be 30 ha, draining an impervious area of 40 ha. In the PCSWMM model, the source and local controls implemented in these areas reduce pollutant loads by virtue of reducing water quantity.
The controls that operate primarily through infiltration are soakaways, bioretention areas, filter strips, permeable pavements, and infiltration trenches.
Ultimately, the source and local control sites in the model were limited to enclosed institutions such as schools, shopping centres and churches. Choosing enclosed sites would facilitate infrastructure protection from damage due to illegal dumping and waste disposal in the catchment. Furthermore, the various institutions would be possible collaborators when it comes to maintaining the interventions and educating the public on the function of SuDS.
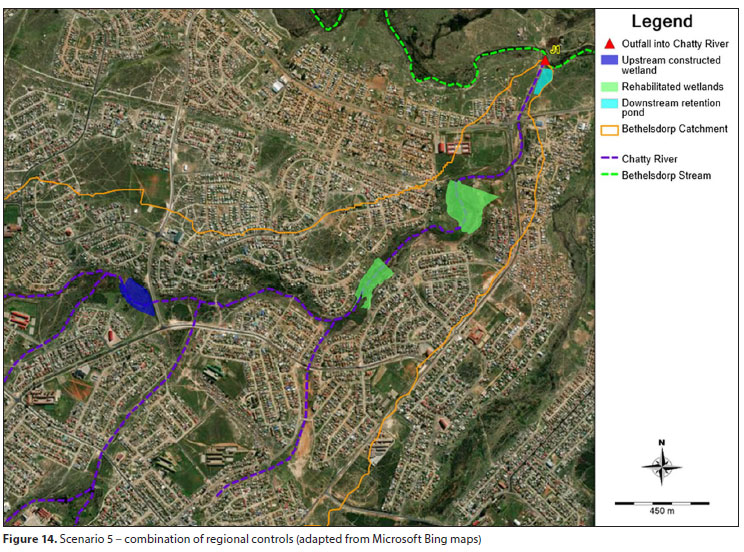
Scenario 5 - regional controls
Treatment trains are used to rehabilitate waterways, enhance water resource management, and promote biodiversity and amenity (Vice, 2011). Scenario 5 assessed the combination of the previously described regional controls to form a treatment train through the catchment. They included: the constructed wetland upstream, the rehabilitated wetlands, and the downstream retention pond, as shown in Fig. 14.
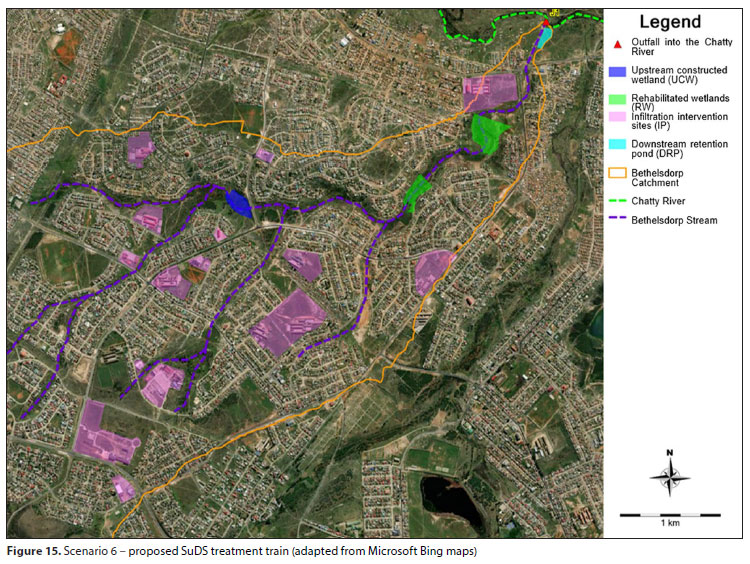
Scenario 6 - combination of all the interventions
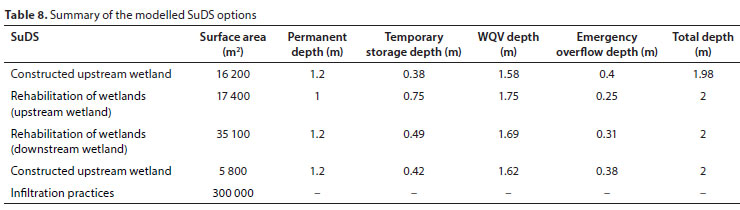
This scenario was used to analyse the additional influence of source and local controls if implemented in the catchment to form a treatment train with a wider variety of interventions. A system with source, local and regional controls reduces shock loads on the system. Improving water quality at the source alleviates the burden on regional controls and promotes better functioning of the interventions by capturing the WQV upstream. Figure 15 gives an overview of the SuDS locations. Table 8 summarises all the SuDS scenarios modelled.
Scenario modelling results
BRC 'As-Is' model
The partially calibrated model of the current As-Is' state of the Bethelsdorp River catchment (BRC), a sub-catchment of the Chatty River catchment, was used as the base for the retrofitted SuDS model interventions. The water quality values at the BRC outlet, where the Bethelsdorp tributary flows into the main Chatty River channel, were compared to the BRC 'As Is' model results over the full 9 years and 5 months simulation period for each of the different modelled SuDS interventions.
BRC 'Pre-Development' model
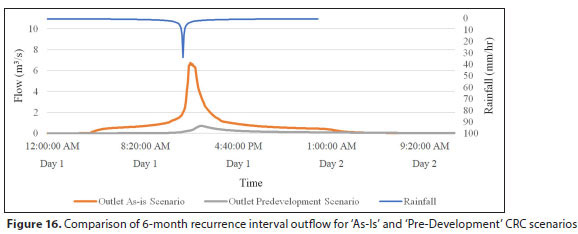
The BRC 'Pre-Development' model was developed to estimate the flow and pollutant load characteristics of the catchment prior to urban development. Due to the lack of flow data for the Bethelsdorp tributary before development, the 'Pre-Development' model was uncalibrated.
Figure 16 shows the influence of urban development on river flow for a 6-month recurrence interval storm. The 'Pre-Development' flow curve is both hugely reduced as well as delayed by around 1 hour compared to the 'As-Is' flow.
Potential impact of SuDS interventions on water quality
Long-term continuous simulation results
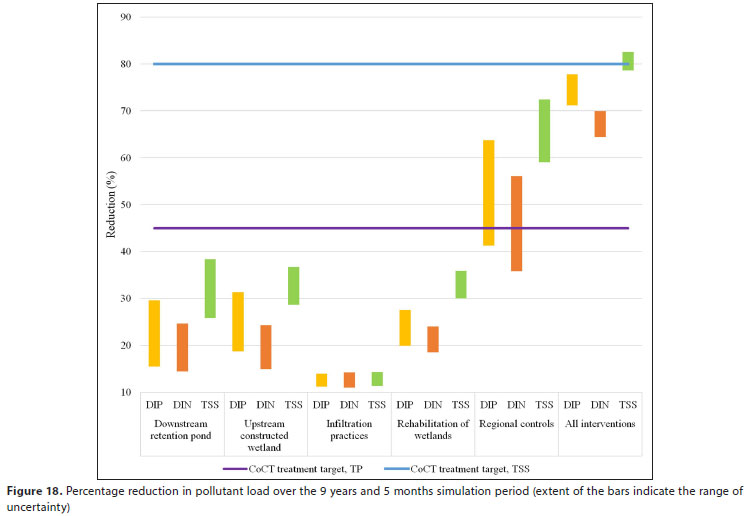
The models were run for an equivalent period of 9 years and 5 months (January 2013 - May 2022). Figure 17 shows the cumulative pollutant loads for DIP estimated from the simulations while Figure 18 presents the percentage of pollutant reduction for the different indicators.
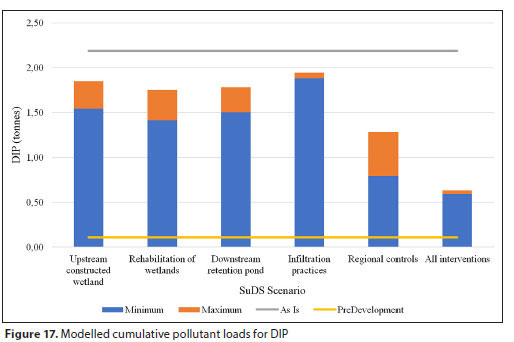
'Infiltration practices' (Scenario 4) had the smallest pollutant reduction impact. These source and local controls treat a relatively small amount of runoff, approximately 10%, compared to the regional controls modelled in the other scenarios, accounting for the relatively low pollution reduction.
'Rehabilitation of wetlands' (Scenario 2), that is the upstream constructed wetland and downstream retention pond, resulted in the highest pollutant load reduction of the individual regional controls evaluated. The higher impact may be due to the large WQV captured compared to the other two regional controls, the upstream constructed wetland and downstream retention pond, and their location in the middle to lower reaches of the catchment.
The combined 'regional controls' (Scenario 5) resulted in increased pollutant removal over Scenarios 1, 2, 3 and 4; however, a complete treatment train, with source, local and regional controls, as modelled in Scenario 6, is necessary to achieve the annual pollutant removal targets mandated in the 'Management of urban stormwater impacts policy' (City of Cape Town, 2009).
Annual simulation results
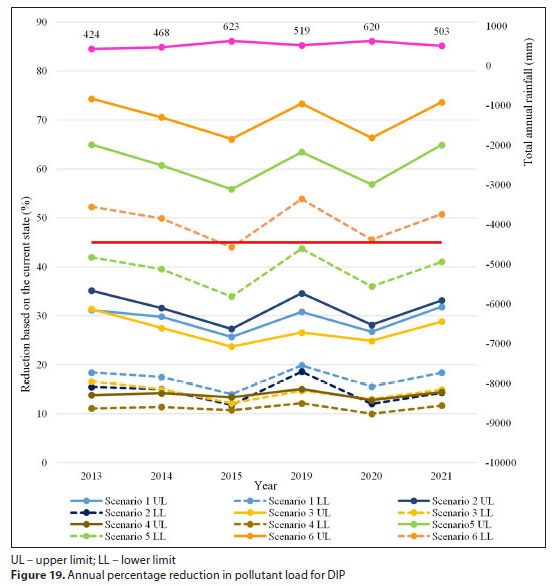
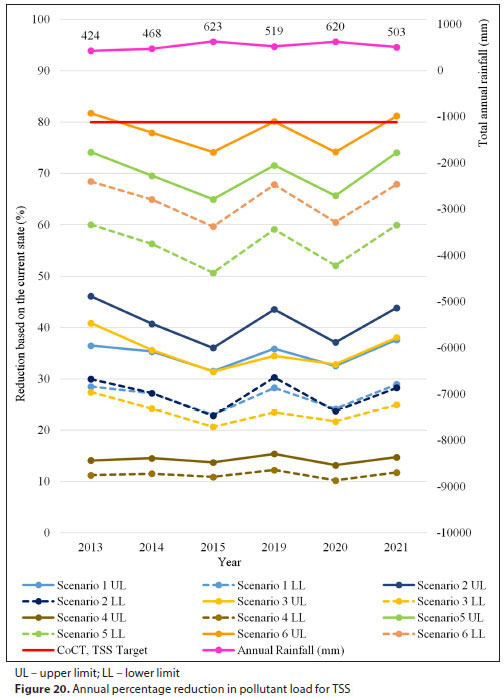
The annual pollutant reduction of DIP, DIN and TSS was assessed to identify a relationship between the annual rainfall and the percentage of pollutant reduction in the various scenarios. The annual rainfall was seen to have an inverse relationship with the percentage of pollutant reduction, with an increase in annual rainfall leading to a reduction in pollutant removal. The modelled SuDS interventions that operate through infiltration showed a higher pollutant removal percentage in years with lower total rainfall. This pattern is likely due to higher relative infiltration rates into less saturated soils.
As shown in Fig. 19, the DIP percentage removal is likely to meet the target set by the City of Cape Town (2009) in 'regional controls' and 'all interventions' (Scenarios 5 and 6, respectively) for the various rainfall conditions when functioning efficiently.
Only the upper treatment limit defined in Scenario 6 met the annual TSS removal target - in 2013, 2019 and 2021 (Fig. 20).
RESULTS
This study identified stormwater pollutant mitigation opportunities in the Bethelsdorp River catchment using SuDS that were then modelled in PCSWMM considering the current scenario ('As-Is'), the likely situation prior to urban development ('Pre-Development'), and 6 intervention scenarios for DIN, DIP and total suspended solids (TSS). The SuDS intervention scenarios included: constructed wetlands, a retention pond, various infiltration practices, and combinations of the individual interventions.
The scenario with the most significant impact was Scenario 6, a combination of all the interventions with the highest pollutant removal when functioning efficiently, of 72% and 80% for DIP and TSS, respectively. However, the TSS removal range in Scenario 6 only partially met the annual targets outlined in the 'Management of urban stormwater impacts policy' of the City of Cape Town (2009) for 2016, 2019 and 2021. Complementary structures such as sedimentation ponds should be considered for additional treatment to meet the pollutant removal targets adequately.
Locating adequate space to treat the runoff flowing from the large catchment was a challenge because of, inter alia, the encroachment of developments in the floodplain, overall limited space due to dense urban development, and relatively steep slopes. Installing a treatment train with a variation of SuDS interventions was identified as the effective strategy to adequately improve water quality in the catchment.
CONCLUSIONS
This study highlights the potential for SuDS to significantly improve water quality in the Bethelsdorp River catchment, with Scenario 6 - the combination of all the interventions - providing the highest levels of pollutant removal. The creation of treatment trains (source, local, and regional controls) therefore proved essential for meeting water quality targets. Regional controls were particularly effective in reducing pollutants due to their ability to capture larger water quality volumes. However, consistent compliance with local water quality standards may require additional structures, such as sedimentation ponds, to achieve full pollutant removal targets.
The project faced study limitations, including the reliance on decay functions from other regions due to limited local treatment performance data. Additionally, identifying sufficient space for interventions was constrained by dense urban development and steep slopes. The following tasks are recommended to provide a better local database for future development and research:
• The establishment of secure flow measurement stations in the lower reaches of the catchment and various tributaries to facilitate the collection of hydrological modelling calibration data.
• Continuous water quality data collection to better understand spatial and temporal variations and the correlation of water quality to land use. This will enable the development of buildup and wash-off factors required for constructing water quality models.
• Only one local rain gauge was identified as operational during the project. This limited the data on the variation of rainfall patterns in the catchment. Furthermore, there were no available and up-to-date temperature and evaporation data. The establishment and maintenance of additional weather stations across the catchment would be a great asset. Weather stations can be set up in various public institutions, such as schools, where they may provide additional benefits for the residents.
While SuDS present a viable approach to improving water quality in the Chatty River, their success will require collaboration among residents, municipalities, and other stakeholders.
This study provides a practical framework for integrating SuDS in highly urbanized contexts of the Global South. It demonstrates the potential for significant pollutant reductions in a highly polluted river system through strategic SuDS combinations. Based on the outcomes, recommendations for future research are:
• Conduct detailed co st-benefit analyses to evaluate the tradeoffs between pollutant reduction and SuDS implementation costs.
• Investigate region-specific build-up and wash-off dynamics and explore novel SuDS interventions for constrained urban environments.
• Utilise community engagement, to identify multifunctional opportunities for the recommended SuDS interventions.
ACKNOWLEDGEMENTS
This research was funded by the Water Research Commission through Contract No. C2020/2021-00076: 'Restoration of estuaries using a socio-ecological systems framework' led by Nelson Mandela University.
AUTHOR CONTRIBUTIONS
Anabel Matalanga was responsible for the collection of the data, the construction and running of the various models, the analysis of the model outputs, and the writing of the draft paper. Neil Armitage was responsible for the conceptualisation of the project, critical intellectual input during the research, and the final editing of the paper.
REFERENCES
ASCE (1982) Gravity Sanitary Sewer Design and Construction, ASCE Manual of Practice No. 60. ASCE, New York. URL: https://ascelibrary.org/doi/pdf/10.1061/9780784409008.fm (Accessed 5 June 2021) [ Links ]
BAHAYA B, AL-QURAISHI M and GRUDEN C (2019) Utilizing SWMM and GIS to identify total suspended solids hotspots to implement green infrastructure in Lucas County, OH. Environ. Progress Sustainable Energ. 38 (6) e13240. https://doi.org/10.1002/ep.13240 [ Links ]
BASTIEN N, ARTHUR S, WALLIS S and SCHOLZ M (2010) The best management of SuDS treatment trains: a holistic approach. Water Sci. Technol. 61 (1) 263-272. https://doi.org/10.2166/wst.2010.806 [ Links ]
CDM (2008) Short duration data disaggregation. URL: http://www.dynsystem.com/netstorm/help/HourlyDisaggregation.html (Accessed 23 August 2022). [ Links ]
CERFONTEYN M and DAY E (2010) Diep River water quality study. Draft report to the City of Cape Town for the project: 'Improving the quality of stormwater discharging into the Diep River, Milnerton'. Catchment, Stormwater and River Management Department. City of Cape Town Metropolitan Municipality, Cape Town. [ Links ]
CHEN J, LIU Y, GITAU MW, ENGEL BA, FLANAGAN DC and HARBOR JM (2019) Evaluation of the effectiveness of green infrastructure on hydrology and water quality in a combined sewer overflow community. Sci. Total Environ. 665 69-79. https://doi.org/10.1016/j.scitotenv.2019.01.416 [ Links ]
CHOW MF, YUSOP Z and SHIRAZI SM (2013) Storm runoff quality and pollutant loading from commercial, residential, and industrial catchments in the tropic. Environ. Monit. Assess. 185 8321-8331. https://doi.org/10.1007/s10661-013-3175-6 [ Links ]
CITY OF CAPE TOWN (2009) Management of urban stormwater impacts policy. URL: https://resource.capetown.gov.za/documentcentre/Documents/Bylaws%20and%20policies/Management%20of%20Urban%20Stormwater%20Impacts%20Policy%20-%20approved%20on%2027%20May%202009.pdf (Accessed 20 June 2022) [ Links ]
CHI (Computational Hydraulics International) (2021) CHI - PCSWMM. URL: https://www.pcswmm.com/ (Accessed 15 June 2021) [ Links ]
CHI (Computational Hydraulics International) (2022) PCSWMM support. URL: https://support.chiwater.com/ (Accessed 15 June 2021) [ Links ]
DE OLIVEIRA JAP, BELLEZONI RA, SHIH W and BAYULKEN B (2022) Innovations in urban green and blue infrastructure: tackling local and global challenges in cities. J. Clean. Prod. 362 132355. https://doi.org/10.1016/j.jclepro.2022.132355 [ Links ]
GOOGLE MAPS (2022) Chatty River. URL: https://goo.gl/maps/WKjSdHXLLAsPHnes9 (Accessed 04 May 2021). [ Links ]
GOULDEN S, PORTMAN ME, CARMON N and ALON-MOZES T (2018) From conventional drainage to sustainable stormwater management: Beyond the technical challenges. J. Environ. Manage. 219 37-45. https://doi.org/10.1016/j.jenvman.2018.04.066 [ Links ]
GREGORY M (2014) Stormwater pond sediment loading and accumulation analysis. J. Water Manage. Model. 22 1-10. https://doi.org/10.14796/jwmm.c378 [ Links ]
HARGREAVES GH and ALLEN RG (2003) History and evaluation of Hargreaves evapotranspiration equation. J. Irrig. Drain. Eng. 129 (1) 53-63. https://doi.org/10.1061/(ASCE)0733-9437(2003)129:1(53) [ Links ]
HATT BE, FLETCHER TD and DELETIC A (2007) Treatment performance of gravel filter media: Implications for design and application of stormwater infiltration systems. Water Res. 41 (12) 2513-2524. https://doi.org/10.1016/j.watres.2007.03.014 [ Links ]
HUBER WC (2001) New options for overland flow routing in SWMM. In: Brashear RW and Maksimović Č (eds) Urban Drainage Modeling: Proceedings of the Specialty Symposium held in Orlando, Florida, May 2001. American Society of Civil Engineers (ASCE), Reston, VA. 22-29. https://doi.org/10.1061/40583(275)3 [ Links ]
HUBER WC, DICKINSON RE, BARNWELL TO Jr and BRANCH A (1992) Storm water management model; version 4. United States Environmental Protection Agency, Washington DC. URL: https://www.casqa.org/wp-content/uploads/2023/03/james_2002_swmm4usermanual.pdf (Accessed 15 August 2022). [ Links ]
JAMES W, ROSSMAN LE and JAMES WR (2010) User's guide to SWMM 5 (13th edn). CHI Press Publication, Ontario. URL: https://www.chiwater.com/Files/UsersGuideToSWMM5Edn13.pdf (Accessed 15 August 2022). [ Links ]
JAMES W (2005) Rules for responsible modeling. URL: https://www.researchgate.net/profile/Mohamed-Mourad-Lafifi/post/How_to_create_hydrograph_using_time_to_peak_peak_discharge_and_duration/attachment/59d6476879197b80779a243c/AS%3A462298184720389%401487231884743/download/R184_CHI_Rules++for+Responsible+Modeling.pdf (Accessed 15 August 2022). 307 pp. [ Links ]
KADLEC RH and WALLACE S (2008) Treatment Wetlands. CRC Press, Boca Raton. https://doi.org/10.1201/9781420012514 [ Links ]
KOZAK D, HENDERSON H, DE CASTRO MAZARRO A, ROTBART D and ARADAS R (2020) Blue-green infrastructure (BGI) in dense urban watersheds. The case of the Medrano stream basin (MSB) in Buenos Aires. Sustainability 12 (6) 2163. https://doi.org/10.3390/su12062163 [ Links ]
LIM HS and LU XX (2016) Sustainable urban stormwater management in the tropics: an evaluation of Singapore's ABC Waters Program. J. Hydrol. 538 842-862. https://doi.org/10.1016/j.jhydrol.2016.04.063 [ Links ]
LINE DE, WHITE NM, OSMOND DL, JENNINGS GD and MOJONNIER CB (2002) Pollutant export from various land uses in the Upper Neuse River Basin. Water Environ. Res. 74 (1) 100-108. https://doi.org/10.2175/106143002X139794 [ Links ]
LIONG S-Y, SHREERAM J and IBRAHIM Y (1995) Catchment calibration using fractional-factorial and central-composite-designs-based response surface. J. Hydraul. Eng. 121 (6) 507-510. https://doi.org/10.1061/(ASCE)0733-9429(1995)121:6(507) [ Links ]
LIU Y, ENGEL BA, COLLINGSWORTH PD and PIJANOWSKI BC (2017) Optimal implementation of green infrastructure practices to minimize influences of land use change and climate change on hydrology and water quality: Case study in Spy Run Creek watershed, Indiana. Sci. Total Environ. 601-602 1400-1411. https://doi.org/https://doi.org/10.1016/j.scitotenv.2017.06.015 [ Links ]
MCCUEN RH, JOHNSON PA and RAGAN RM (1996) Highway hydrology: Hydraulic Design Series No. 2. URL: https://trid.trb.org/View/573518 (Accessed 15 August 2022) [ Links ]
MICROSOFT BING (2022) Bing Maps. URL: https://www.bing.com/maps/ (Accessed 15 October 2022). [ Links ]
MICROSOFT CORPORATION (2022) Microsoft Excel. URL: https://office.microsoft.com/excel (Accessed 2 February 2021). [ Links ]
MUGUME SN, KIBIBI H, SORENSEN J and BUTLER D (2024) Can blue-green infrastructure enhance resilience in urban drainage systems during failure conditions? Water Sci. Technol. 89 (4) 915-944. https://doi.org/10.2166/wst.2024.032 [ Links ]
NEL L (2014) Presence, levels and distribution of pollutants in the estuarine food web - Swartkops River Estuary, South Africa. Masters dissertation, Nelson Mandela University. URL: http://hdl.handle.net/10394/15472 (Accessed 22 May 2022). [ Links ]
NIAZI M, NIETCH C, MAGHREBI M, JACKSON N, BENNETT BR, TRYBY M and MASSOUDIEH A (2017) Storm water management model: Performance review and gap analysis. J. Sustainable Water Built Environ. 3 (2) 04017002. https://doi.org/10.1061/JSWBAY.0000817 [ Links ]
ORMSBEE LE (1989) Rainfall disaggregation model for continuous hydrologie modeling. J. Hydraul. Eng. Am. Soc. Civ. Eng. 115 (4) 507-525. https://doi.org/10.1061/(ASCE)0733-9429(1989)115:4(507) [ Links ]
PRETORIUS L (2015) Spatial and temporal variability in water quality characteristics of the Swartkops Estuary. URL: http://hdl.handle.net/10948/4176 (Accessed 2 May 2021). [ Links ]
QGIS (2022) QGIS User Guide. URL: https://docs.qgis.org/3.22/en/docs/user_manual/ (Accessed 5 November 2021). [ Links ]
RAWLS WJ, BRAKENSIEK DL and MILLER N (1983) Green-Ampt infiltration parameters from soils data. J. Hydraul. Eng. 109 (1) 62-70. https://doi.org/10.1061/(ASCE)0733-9429(1983)109:1(62) [ Links ]
ROSSMAN LA and HUBER WC (2016) Storm water management model reference manual Volume III - water quality. URL: https://nepis.epa.gov/Exe/ZyPDF.cgi/P100P2NY.PDF?Dockey=P100P2NY.PDF (Accessed 15 August 2022). [ Links ]
ROSSMAN LA and SIMON MA (2022) Storm water management model user's manual. Version 5.2. URL: https://www.epa.gov/system/files/documents/2022-04/swmm-users-manual-version-5.2.pdf (Accessed 15 August 2022). [ Links ]
RSA (Republic of South Africa) (1998) National Water Act. Act No. 36 of 1998. Government Gazette 19182. URL: https://www.gov.za/documents/national-water-act. (Accessed 26 May 2021). [ Links ]
SHAMSI UMS and KORAN J (2017) Continuous calibration. J. Water Manage. Model. 25 C414. https://doi.org/10.14796/JWMM.C414 [ Links ]
SMART P (2020) HydroCAD reference manual. HydroCAD Software Solutions LLC. URL: https://www.hydrocad.net/wqv.htm (Accessed 15 July 2022). [ Links ]
SONG H, QIN T, WANG J and WONG THF (2019) Characteristics of stormwater quality in Singapore catchments in 9 different types of land use. Water 11 (5) 1089. https://doi.org/10.3390/w11051089 [ Links ]
SRK CONSULTING (2015) Chatty River: Refinement of 1:50 & 1:100-year Floodlines. SRK Consulting, Gqeberha. [ Links ]
THEWLIS G (2022) Managing the water quality of the Zandvlei Estuary using sustainable drainage systems in the Diep Catchment. Masters dissertation, University of Cape Town. URL: https://open.uct.ac.za/items/e3306146-ffe5-48cb-bc3a-bed69ee4280a (Accessed 15 April 2021). [ Links ]
VAN NIEKERK L and TURPIE JK (2012) National Biodiversity Assessment 2011: Technical report. Volume 3: Estuary component. CSIR Report Number CSIR/NRE/ECOS/ER/2011/0045/B. Council for Scientific and Industrial Research, Stellenbosch. URL: https://rsis.ramsar.org/RISapp/files/43624262/documents/ZA2291_lit160906.pdf (Accessed 22 May 2021). [ Links ]
VICE MAP (2011) Century City as a case study for sustainable drainage systems (SuDS) in South Africa. URL: https://open.uct.ac.za/server/api/core/bitstreams/5c9ec19a-57c1-402b-a083-2405510aba51/content (Accessed 17 June 2021). [ Links ]
WEDDEPOHL JP (1988) Design rainfall distributions for Southern Africa. Unpublished thesis, Department of Agricultural Engineering, University of Natal, Pietermaritzburg. [ Links ]
WICKE D, MATZINGER A, SONNENBERG H, CARADOT N, SCHUBERT R-L, DICK R, HEINZMANN B, DÜNNBIER U, VON SEGGERN D and ROUAULT P (2021) Micropollutants in urban stormwater runoff of different land uses. Water 13 (9) 1312. https://doi.org/10.3390/w13091312 [ Links ]
WOODS-BALLARD B, KELLAGHER R, WOODS BALLARD B, CONSTRUCTION INDUSTRY RESEARCH AND INFORMATION ASSOCIATION, GREAT BRITAIN, DEPARTMENT OF TRADE AND INDUSTRY and ENVIRONMENT AGENCY (2007) The SUDS manual. URL: http://www.persona.uk.com/A47postwick/deposit-docs/DD-181.pdf (Accessed 6 September 2020). 174-180. [ Links ]
XU Z, XIONG L, LI H, XU J, CAI X, CHEN K and WU J (2019) Runoff simulation of two typical urban green land types with the Stormwater Management Model (SWMM): sensitivity analysis and calibration of runoff parameters. Environ. Monit. Assess. 191 1-16. https://doi.org/10.1007/s10661-019-7445-9 [ Links ]
 Correspondence:
Neil Armitage
Email: Neil.Armitage@uct.ac.za
Received: 29 January 2024
Accepted: 26 March 2025
