


Services on Demand
Journal

Article
 English (pdf)
 Article in xml format
 Article references
 Send this article by e-mail
Indicators
Related links
-
 Cited by Google
 -
 Similars in Google
Share

 Permalink
Water SA
On-line version ISSN 1816-7950Print version ISSN 0378-4738
Water SA vol.51 n.2 Pretoria Apr. 2025
https://doi.org/10.17159/wsa/2025.v51.i2.4152
RESEARCH PAPER
The state of wastewater management in South Africa: data gaps, missing wastewater, and Green Drop reporting
P Mark GrahamI, II; Nicholas B PattinsonI, II; David StillIII, IV
IGroundTruth, Pietermaritzburg, KwaZulu-Natal, South Africa
IICentre for Water Resources Research, University of KwaZulu-Natal (UKZN), Pietermaritzburg, KwaZulu-Natal, South Africa
IIIPartners in Development (PID), Pietermaritzburg, KwaZulu-Natal, South Africa
IVDuzi-uMngeni Conservation Trust (DUCT), Pietermaritzburg, KwaZulu-Natal, South Africa
ABSTRACT
Untreated or poorly treated wastewater is a major contributor to freshwater pollution. In South Africa, the Green Drop (GD) assessments report the national status of wastewater management. However, GD reporting was halted between 2013 and 2022. We aimed to determine the consequences of the lengthy cessation in GD monitoring, isolate issues not highlighted in GD reporting, and interrogate the current status of wastewater management in South Africa. The GD reports showcase the dire state of South Africa's wastewater treatment works (WWTW). However, we found that the biggest problem not emphasised in GD reporting is ineffective management of sewage reticulation (i.e., collection and distribution), with evidence that large amounts of wastewater are going missing (i.e., not reaching WWTW for treatment). There was a decrease in the daily volume of wastewater treated (DVT) across South Africa between 2013 and 2021, despite the population increasing by ~5.52 million (10%) during that period. We highlight the severity of this issue through a case study on the city of Pietermaritzburg: we estimated a ~19.66 ML-day-1 deficit between predicted and measured DVT at the Pietermaritzburg Darvill WWTW in 2022, with the deficit correlating to high Escherichia coli concentrations (indicative of raw sewage pollution) in the rivers within the Pietermaritzburg area. If reticulation failures are not addressed, then even if the dismal performance of WWTW in South Africa is remedied, wastewater pollution impacts will persist. The wastewater crisis is creating water scarcity, increasing the difficulty of using and re-using water resources, and poses a substantial health risk. Addressing the crisis requires adequate data. Though the current GD assessments are essential to identifying problematic WWTW, serious data gaps remain that necessitate improved monitoring, potentially augmented by citizen science. Mitigating the wastewater crisis is critical to safeguarding freshwater ecosystems, securing safe and resilient water supplies, and achieving the Sustainable Development Goals (SDGs).
Keywords: citizen science, freshwater pollution, Green Drop report, wastewater monitoring, wastewater reticulation, wastewater treatment works
INTRODUCTION
Freshwater is one of Earth's most critical resources. However, unsustainable use and pollution, among other factors such as climate change, are threatening global water security (M Wang et al., 2024). Poorly treated or untreated wastewater is one of the largest contributors to freshwater pollution, a problem that is being aggravated by increasing populations and migration to urban centres (Jones et al., 2022; Mema, 2010). People are becoming increasingly reliant on water systems receiving a growing volume of wastewater that originates from diverse anthropogenic sources and comprises an increasingly complex suite of pollutants (Bakare and Adeyinka, 2022; Brooks et al., 2006; Naidoo and Olaniran, 2014; Villarín and Merel, 2020). Influent and effluent from wastewater treatment works (WWTW) can have significant pathogen loads (many of which show antimicrobial-resistant traits) and various other contaminants of emerging concern such as antibiotics, antiretrovirals, heavy metals, plastics and microplastics, and pesticides (Abia et al., 2023; Archer et al., 2021; Deblonde et al., 2011; Edokpayi et al., 2017; Ibangha et al., 2023; H Wang et al., 2014).
Depending on the composition, wastewater pollution in aquatic environments can have a variety of negative effects on humans, biodiversity, and ecosystem function (Edokpayi et al., 2017). These are non-mutually exclusive, and can range from more benign effects such as reducing aesthetic appeal, through to more severe consequences such as causing disease outbreaks (Jones et al., 2022; Keshaviah et al., 2023), eutrophication (Tong et al., 2022), or even full-scale ecological collapse (Dyer et al., 2003; Naidoo and Olaniran, 2014). Considering the threat, it is critical that the production, collection, treatment, discharge, and re-use of wastewater are managed effectively and efficiently (Bakare and Adeyinka, 2022; Igbinosa and Okoh, 2009; Montwedi et al., 2021; Omohwovo, 2024). This is acknowledged in Sustainable Development Goal (SDG) 6 ''water and sanitation for all", with specific emphasis within SDG targets 6.2 and 6.3, as well as indicators 6.3.1 and 6.3.2, though improved wastewater management would be central to achieving at least 11 of the SDGs (Obaideen et al., 2022; Sadoff et al., 2020; UN Water, 2016; UNEP and UN Water, 2018; WHO and UNICEF, 2021).
Effective management requires monitoring to identify the problems present; where they are, how they arise, how they change over time, and if remediation interventions are working (Keshaviah et al., 2023). In South Africa, a country with a steadily growing population and severe freshwater stress (Adewumi et al., 2010; Archer et al., 2021; Donnenfeld et al., 2018), the national government's Department of Water and Sanitation (DWS) designed and implemented the Green Drop (GD) programme in 2008 for assessing and monitoring the functionality of WWTW across South Africa (Adewumi and Olanrewaju, 2011). The program assigns a GD score to each WWTW based on an assessment of 'the entire value chain, including aspects of physical infrastructure performance (i.e., sewage collection network, pumping, treatment, and discharge), as well as aspects of administrative and financial performance. Contributing criteria are weighted differently in the calculation of the GD score, with actual effluent quality and compliance status contributing only 30% weight; 70% of the score is dependent on various other criteria, including capacity, environmental, financial, and technical management (DWS, 2022, 2023a). The concept is incentive-based, ideally rewarding WWTW that achieved the GD certification of excellence (requiring a score > 90%). The programme ran for approximately 5 years, consistently indicating that the wastewater treatment systems countrywide were in distressingly poor condition (Ntombela et al., 2016). After the executive summary of the 2013 GD assessment was released, the programme was scrapped for nearly a decade, before being revived in 2021 (DWS, 2022).
In this study, we quantitatively compared the 2013 (DWS, 2013) and 2021 (DWS, 2022) GD assessments. We aimed to:
(i) investigate how the status and performance of WWTWs in South Africa changed over the period when monitoring was halted, (ii) identify where there are data gaps in the current monitoring and reporting framework, and (iii) highlight issues within wastewater monitoring and management that are not currently receiving the requisite attention. To illustrate the issues and data gaps we identified in the national GD data, we specifically interrogated GD data for the Pietermaritzburg city Darvill WWTW and Escherichia coli data from river monitoring sites in Pietermaritzburg as a case study. We also reviewed the most recent 2023 (DWS, 2023a; b) GD reports to contextualise the current status and trends, though we did not perform a qualitative comparison with previous reports. Overall, our objective was to review South Africa's current status regarding wastewater, assess the changes after nearly a decade without reporting, and, based on the trends and issues identified, develop brief recommendations for action going forward.
METHODS
Data availability: GD data
The GD data used in this study were publicly available within the 2013 (DWS, 2013), 2021 (DWS, 2022), and 2023 (DWS, 2023a) GD reports. The datasets included at least partial data on the designed daily capacity, the percentage of the designed daily capacity used (DCU) - giving the daily volume of wastewater treated (DVT), and GD scores for 876 WWTW in South Africa. For discussion on how the GD reports function, see Adewumi et al. (2011), Ntombela et al. (2016), and Kelly (2021).
Data availability: Pietermaritzburg case study
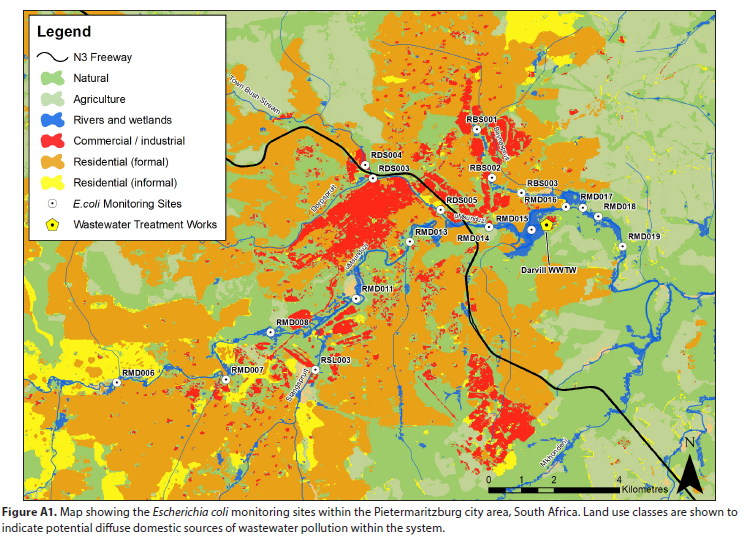
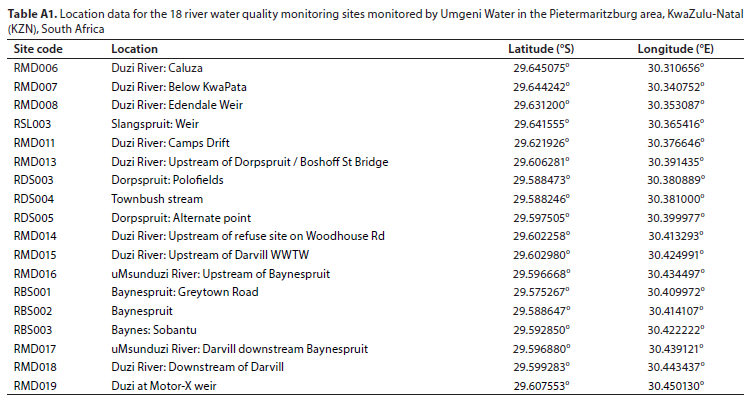
The Pietermaritzburg Darvill WWTW was selected given that (i) it is a large and unusually well-documented site, with over 30 years of inflow history and history of the water quality in the streams in the Darvill catchment, and (ii) it apparently performs relatively well according to the latest GD assessment (DWS, 2023a,b), creating a good contrast between its GD status and the reality of wastewater management in the catchment. Population data for Pietermaritzburg, KwaZulu-Natal Province, South Africa were openly available (www.worldpopulationreview.com). The population estimates and projections are based on census data (Stats SA, 2022) and the UN World Urbanization Prospects (UN, 2019). Inflow data for the Darvill WWTW and E. coli data from the 18 river monitoring sites in Pietermaritzburg (see Appendix; Fig. A1; Table A1) were publicly available within monthly catchment management forum reports and used with permission from uMngeni-uThukela Water who collect the data as part of DWS mandated monitoring. While E. coli counts of >200-400 colony forming units (CFU) per 100 mL are considered a potential health risk in recreational freshwaters (DWAF, 1996; USEPA, 2012), we selected a >10 000 CFU-100 mL-1 count threshold since it unambiguously indicates sewage contamination, while counts > 100 000 CFU-100 mL-1 show extreme sewage pollution (Price and Wildeboer, 2017). Not every site reported E. coli CFU counts every week, though data were reported from >15 sites in 90% of weeks, allowing for robust trend analyses.
Data analysis
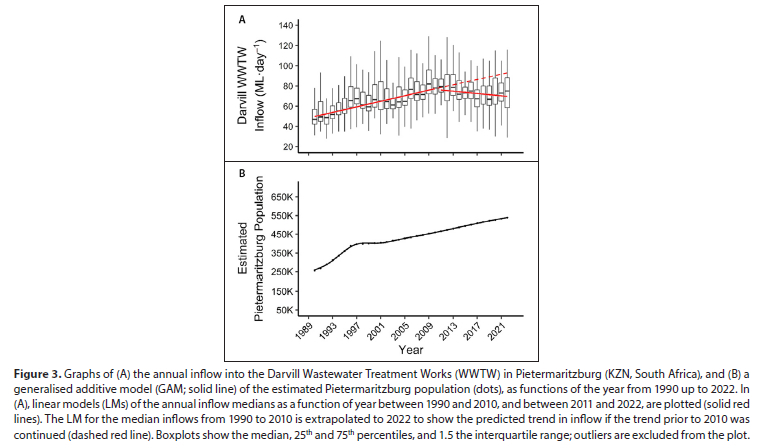
Statistical analyses were conducted in R version 4.2.3 (R Core Team, 2024) within the RStudio environment (RStudio Team, 2024). Graphing was done using the package ggplot2 (Wickham, 2016). Generalised additive models (GAM) in package mgcv (Wood, 2011) were used to model (i) the estimated population of Pietermaritzburg each year as a function of year, from 1990 to 2022, and (ii) the percentage of river monitoring sites in the Pietermaritzburg area (Table A1) that recorded E. coli counts > 10 000 and > 100 000 CFU-100 mL-1 during weekly monitoring, as functions of weekly time intervals from 2006-2022. Linear models (LMs, family Gaussian) were used to model the median inflows at Darvill WWTW as a function of year between 1990 and 2010, and between 2011 and 2022. The time periods chosen for each LM were selected because the transition from 2011 to 2012 represented the start of the decline in the median DVT at Darvill WWTW, and hence a break-point in the trajectory prior to 2011.
RESULTS
South Africa GD status and trends
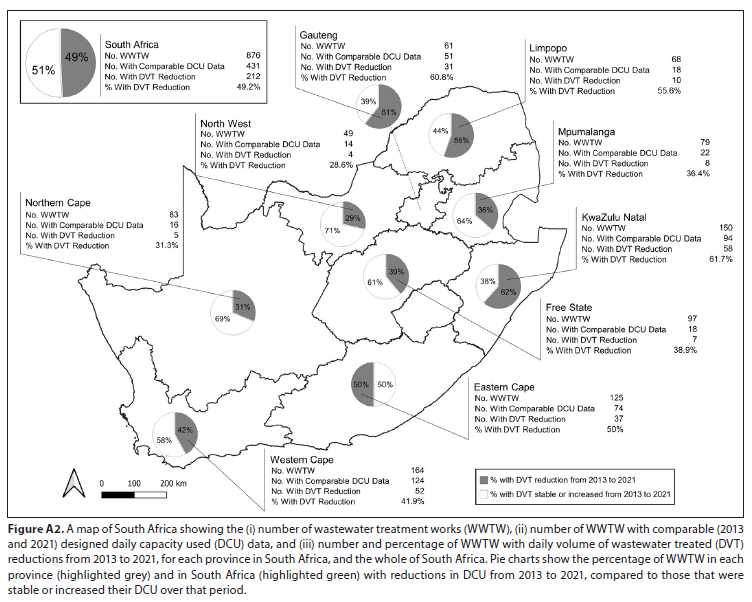
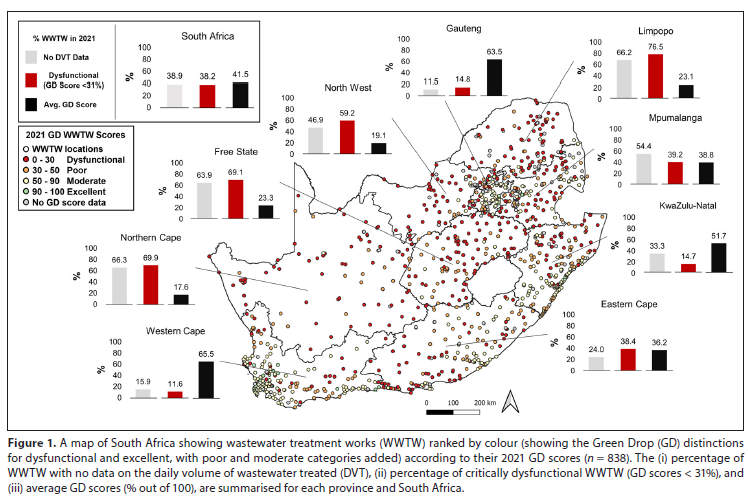
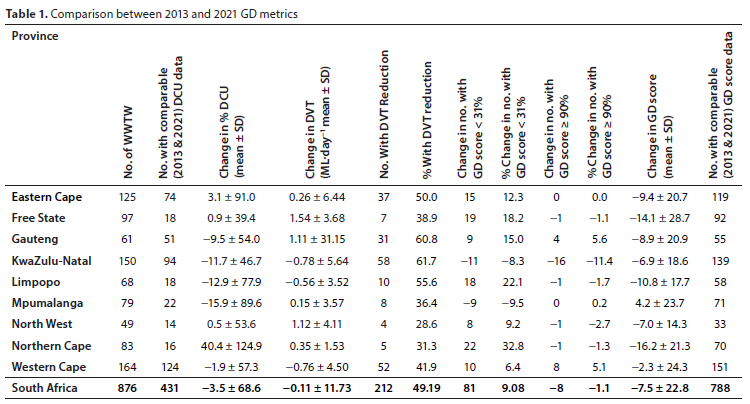
In the 2021 GD report, the nationwide average GD score was 41.6% ± 28.3 standard deviation (SD), compared to 49.8% ± 27.4 SD in 2013, showing an average 8.2% decrease nationwide (Figs 1 and 2; Table 1). There were 335 (40%) critically dysfunctional WWTW (GD scores < 31%) in 2021, up 81 (9.1%) from 254 (30.9%) in 2013. In 2021, GD performance was worst in Limpopo, the Northern Cape, Free State, and North-West provinces, which had 52 (78.8%), 58 (78.4%), 67 (69.8%), and 29 (65.9%) of their WWTW critically dysfunctional (Figs 1 and 2; Tables 1 and 2). Only 59 (7%) WWTW across South Africa achieved GD certificates of excellence (GD score > 90%), down from 67 (8.2%) in 2013. A total of 38 WWTW across South Africa still lacked GD scores in 2021 (showing they were not fully assessed), though the number had decreased compared to the 54 in 2013 (Figs 1 and 2; Table 1).
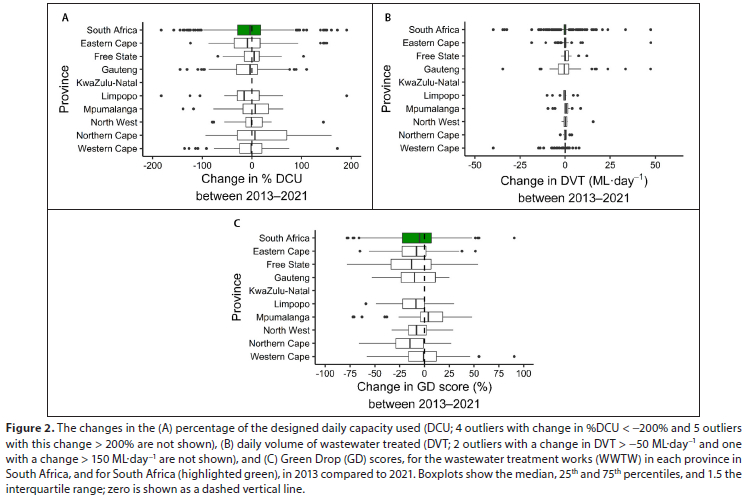
The average percentage of the DCU was similar in 2021 (79.4% ± 59.8 SD) compared to 2013 (80.3% ± 46.6 SD; Figs 2 and A2; Table 1), though in both instances there was a wide range of DCU; for the 535 WWTW with DCU data in 2021, the daily volume of wastewater treated (DVT) ranged from 1-500% of the designed capacity, and of the 587 WWTW with data in 2013, the volume treated ranged from 1.1-415% of the designed capacity. There were 341 WWTW (38.9%) which reported no DCU data in 2021, compared to 289 (33.0%) in 2013, an increase of 52 (5.9%) WWTW not reporting the DVT at the facility (Figs 2 and A2; Table 1).
There were 431 (49.2%) of the 876 WWTW with data on their DCU in 2013 and 2021, showing that >50% of WWTW did not have continuous DCU monitoring. In total, 212 (49.2%) of the 431 WWTW with comparable data showed decreases in their DVT between 2013 and 2021; 6 provinces recorded decreases in the average percentage of their DCU, with average decreases in the DVT of 0.78 million litres (ML)-day-1 ± 5.64 SD, 0.56 ML-day-1 ± 3.52, and 0.76 ML-day-1 ± 4.50, across KZN, Limpopo, and the Western Cape, respectively (Figs 2 and A2; Table 1). Overall, the DVT across South Africa decreased by 0.11 ML-day1 per WWTW ± 11.73 SD between 2013 and 2021, though this was only based on the 431 WWTW with comparable data, so the actual value may be significantly different (Figs 2 and A2; Table 1).
Pietermaritzburg case study
The median inflow in the Darvill WWTW in Pietermaritzburg increased steadily (LM estimate = 1.38 ± 0.16 SE, t = 8.88, p < 0.001) between 1990 (~47.47 ML-day-1) and 2010 (~78.10 ML-day-1), before declining (LM estimate = -0.57 ± 0.28 SE, t = -2.00, p = 0.073) annually between 2011 (~79.40 ML-day-1) and 2022 (~75.00 ML-day-1) (Fig. 3). Over the period from 1990 to 2022, Pietermaritzburg has shown a fairly stable trend of increasing population at ~8 830 people-year-1 ± 6 868 SD (Fig. 3). If the correlation between the increasing median inflow and increasing population had been maintained, Darvill would have been expected to have a median inflow of ~94.66 ML-day-1 in 2022, compared to the actual median inflow of ~75.00 ML-day-1 - a deficit of ~19.66 ML-day-1 (Fig. 3).
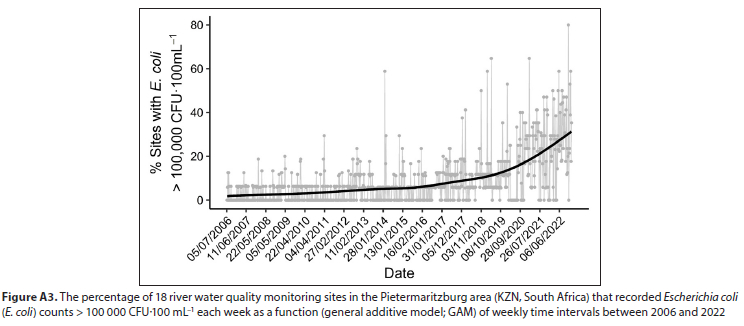
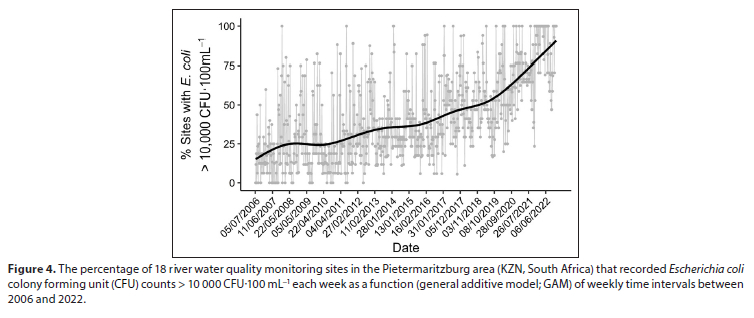
The percentage of the 18 water quality monitoring sites in the Pietermaritzburg area that recorded E. coli counts > 10 000 CFU-100 mL-1 each week increased over time (GAM estimate = 41.52 ± 0.67 SE, t = 62.37, p < 0.001), rising slowly from the start of monitoring in 2006 until late 2007, where it stabilised until mid-2010 before beginning to rise again (Fig. 4). In approximately 2016 the percentage begin to rise steeply, increasing from ~40% of sites to ~90% of sites recording E. coli counts > 10 000 CFU-100 mL-1 weekly by the end of 2022 (Fig. 4). This includes sites across the Pietermaritzburg area, both up- and downstream of the Darvill WWTW (Fig. A1). The pattern was similar with the percentage of sites with E. coli counts > 100 000 CFU-100 mL-1 each week (GAM estimate = 8.40 ± 0.30 SE, t = 27.75, p < 0.001); there was a steady slow increase (from ~1% on average in 2006 to ~5% of sites by 2012), until approximately 2016, when it began to rise more rapidly (Fig. A3). By 2022, ~30% of sites were recording E. coli counts > 100 000 CFU-100 mL-1 each week (Fig. A3).
DISCUSSION
The generally poor GD scores in all GD assessments to date demonstrate the dire state of wastewater infrastructure and governance in South Africa. However, one of the most concerning trends we show is that the volume of wastewater being treated across South Africa decreased over time between 2013 and 2021, despite the South African population having increased by ~5.52 million (10%) during that period (World Bank, 2023). The decrease most likely represents severely failing sewage reticulation infrastructure, with large amounts of wastewater being produced but going missing and not reaching WWTW, causing severe sewage pollution throughout the system. This was exemplified by our Pietermaritzburg case study, where we estimated a sizeable ~19.66 ML-day-1 deficit between the predicted and measured DVT at the Darvill WWTW in 2022. The deficit was matched by a considerable increase in E. coli counts in the rivers within the Pietermaritzburg area. These problems are often not reflected in the GD scores, which can remain the same or even improve despite clear issues with treatment deficits. For example, the Green Drop score for the Pietermaritzburg's Darvill WWTW was essentially unchanged, decreasing marginally from 79% in 2013 to 78% in 2021, despite the evidence for declining performance in the Darvill reticulation network. These serious reticulation issues, leading to untreated sewage entering water systems directly, is not adequately captured in the GD framework partly because holistic site inspections of the 'entire value chain', including the reticulation network, are tedious and expensive (Ntombela et al., 2016). This is exemplified by the fact that only 155 of the 876 WWTW underwent a technical site assessment in the 2022 GD audit (with only 22 WWTW (14.2%) scoring the >80% required to have an 'acceptable level of operational control and functional equipment') (DWS 2023a). However, arguably the larger issue is that reticulation performance is a small and neglected component of the GD evaluation. This allows a WWTW to achieve a high GD score through performing acceptably in facets such as financial and administrative management, while completely neglecting the infrastructure network. Furthermore, the most recent GD audit saw a penalisation for poor effluent compliance and for operating over design capacity, but no penalty for operating below expected intake volume (DWS, 2022, 2023). Consequently, WWTW may actually be motivated to not collect sewage if it would take them over design capacity or create issues with treatment efficiency resulting in a penalisation.
The missing wastewater is potentially the most critical information absent from the GD reports, but it is just one example of the general problem with data gaps. In 2021, there remained 38 WWTW without sufficient data to generate a GD score at all; 341 (38.9%) WWTW, up from 289 (33.0%) in 2013, did not report data on their DCU; and <50% of WWTW had DCU data in both 2013 and 2021. These are crucial failures, since management and remediation interventions cannot begin without adequate monitoring data, or, where the data are being collected locally, without efficient systems in place to report on those data and make them publicly accessible.
Wastewater not reaching WWTW
Based on the DWS (2023a) GD data, only 25% of WWTWs (for which there are data) were reported to be operating at an acceptable (50-100%) percentage of their design capacity. Exceeding design capacity has its own suite of issues, such as poor treatment efficiency and insufficient infrastructural capacity (DWS, 2023a). However, WWTW operating far below their design capacity and showing decreases in their DVT has the more ominous implication that wastewater is not reaching the WWTW. Decreases in DVT were common across South Africa. In some cases, such as in the Western Cape Province, reductions in wastewater could conceivably be partially related to water restrictions and drought (Brühl and Visser, 2021; Millington and Scheba, 2021). However, we suggest that the nationwide reductions are most likely largely associated with sewage reticulation failures. This is supported by an increasing national population not being matched by increasing wastewater treatment volumes. The problem is epitomised by Pietermaritzburg, where national census data show a 44% increase in the number of homes with flush toilets connecting to sewers between 2011 and 2022 (Stats SA, 2022), while Darvill WWTW showed a decrease in treatment volumes over that period. The E. coli counts in the watercourses within the Pietermaritzburg area strongly indicate that large volumes of wastewater are directly entering freshwater systems untreated, causing pervasive, severe sewage pollution. This is cause for serious concern regarding the health and safety of anyone coming into contact with streams and rivers in the region, as well as imminent ecosystem collapse (Ishii and Sadowsky, 2008; Price and Wildeboer, 2017; Some et al., 2021).
The problem is likely aggravated by mismanagement and a lack of maintenance on ageing infrastructure or investment in new infrastructure (Arumugam et al., 2023; Montwedi et al., 2021). As stated, the serious issue of reticulation failures is often not captured by GD scores. Other examples in addition to our Pietermaritzburg Darvill WWTW case study include the Johannesburg Northern Works (South Africa's largest WWTW by some distance, with a design capacity of 405 ML-day-1) which was processing 18% less sewage in 2021 compared with 2013, but which had an unchanged GD score, and eThekwini's Northern Works which was processing 50% less sewage in 2021 than it did in 2013, yet received a GD score only 2% less than it did in 2013. This is the case at various WWTW throughout the country, demonstrating a severe shortcoming of the current GD scoring system for capturing the realities of wastewater management at a catchment scale.
The consequences of inadequate wastewater monitoring and management
Health and biodiversity
Poorly treated or untreated wastewater is one of the largest contributors to disease burden (Jones et al., 2022; Mema, 2010). Approximately 1.5 million people die annually because of poor water, sanitation, and hygiene (WASH) (UN Habitat and WHO, 2018; UNICEF, 2023). Traditionally disadvantaged and marginalised communities are disproportionately affected because they are the most likely to be exposed to, and reliant on, surface water that can become contaminated by wastewater pollution. However, they have the least access to education regarding, or facilities to engage in, good hygiene practices (Amoah et al., 2018; Lee et al., 2023). Consequently, developing nations are where the majority of the deaths, of which approximately 400 000 are children, occur annually because of water-borne diseases (UNICEF, 2023; WHO, 2023).
Ultimately, if wastewater contamination of water resources surpasses critical thresholds, it can cause ecosystem collapse, jeopardising not just the natural biodiversity, but the human socio-economic systems that depend on those ecosystems (Jones et al., 2022). It was interesting that our data showed that E. coli counts > 10 000 CFU-100 mL-1 in Pietermaritzburg appeared to increase several years before the sharp rise in counts > 100 000 CFU-100 mL-1. This may provide empirical evidence for the concept of thresholds for significant deterioration in ecosystem function and self-regulation (Liu et al., 2015; Wagenhoff et al., 2017). This warrants further study. However, generally the threat of imminently crossing thresholds of ecosystem collapse makes addressing wastewater issues a priority for just transitions and environmental justice (Lee et al., 2023), as well as critical to achieving the SDGs (Tortajada, 2020).
Water stress
Water stress in South Africa is growing because of climate change and increasing demand (Rebelo et al., 2021). This is aggravated by poor wastewater management, which makes wastewater significantly more challenging to re-use and contributes towards contamination of high-quality water sources and the associated ecosystems (Montwedi et al., 2021; Tortajada, 2020; M. Wang et al., 2024). Notably, while water scarcity is generally considered from a quantity perspective, poor water quality can contribute significantly to 'clean-water scarcity' as per SDG 6 (Liu et al., 2017; M Wang et al., 2024). Reducing water stress requires efficiently reticulating and treating wastewater. The most recent formal estimate (2009) showed that approximately 14% of South Africa's potable water supply already comes from recycled wastewater (Dungeni et al., 2010).
If properly treated, recycled wastewater can be used for drinking supply (Tortajada and Van Rensburg, 2020). The requirements for treatment to suitable standards for use in agriculture (which accounts for >60% of annual freshwater use in South Africa) are considerably less stringent, increasing potential utility (Edokpayi et al., 2020). There is also a case for using wastewater as a source of renewable energy (Zvimba et al., 2021). Extracting energy during processing could reduce the energy and cost burden of wastewater management, a sector which accounts for up to a quarter of municipal energy usage (Montwedi et al., 2021).
Financial burden
South Africa has reported that it has less than 50% of the financing required to meet WASH targets, with WASH spending already constituting 1.88% of the annual gross domestic product (GDP) (WHO, 2023). However, the failure to invest in WASH ends up costing more than it saves. The costs start, most importantly, with the loss of human lives (Keshaviah et al., 2023). However, there are also substantial financial costs. DeFlorio-Barker et al. (2018) and Collier et al. (2021) conservatively estimated that in the United States of America (USA) the direct health-related annual economic burden of some waterborne diseases was 2.2-8.7 billion USD. This may be significantly higher if all WASH-related illnesses and the associated missed work are accounted for.
Approximately 33% of South African government expenditure is on the healthcare sector, the second highest expense after education (Stats SA, 2020). It is likely that a considerable portion of this money is being spent on preventable WASH-related illnesses. The financial loss is also compounded by the fact that the money spent on avoidable healthcare costs is being taken away from investment in other sectors, slowing economic growth (Naidoo and Olaniran, 2014). Beyond healthcare costs, compromised freshwater threatens industry, commerce, domestic populations, and agriculture reliant on access to safe water (Iloms et al., 2020). Threats to agriculture are particularly important, since agriculture contributes up to 30% of the South Africa's GDP (Bonthuys, 2018). Poor wastewater management also increases the costs of treating and supplying clean water, a necessary cost that would offer significant savings if minimised.
The 2023 GD Assessment Report
The most recent GD report (DWS, 2023a) highlighted that the wastewater situation had deteriorated across almost all sectors compared to 2021. Perceptions of water service delivery, including sanitation, have also declined consistently over the past decade, with dissatisfaction the highest it has been since monitoring began (Slabbert, 2022). Approximately half of users in urban areas in South Africa believe that their municipality rarely or never attends to water and sanitation issues, including broken and leaking pipes, or sewage spills (Slabbert, 2022). The GD statistics showing the poor state, including some comparisons to previous reports, are available in the latest publicly accessible report (DWS, 2023a). Some statistics on missing data and treatment volumes are worth highlighting: (i) despite the fact that it is mandated, 30% (n = 263) of WWTW did not have registered information on what wastewater treatment systems they use, (ii) only 25% (n = 219) of WWTW were reported to be operating at an acceptable hydraulic capacity (50-100% DCU), with 7% (n = 61) providing no information on the design capacity of the facility, and (iii) alarmingly, 43% (n = 377) of WWTW reported having no maintenance teams in place whatsoever. Data gaps make it impossible to determine if the treatment processes are appropriate for the catchment being serviced, to estimate if the volume treated (even if it were measured) is above or below the design capacity, or to identify potential issues.
Addressing wastewater issues
Addressing the drastic wastewater problems requires a range of remediation efforts, including investment in new WWTW infrastructure (e.g., decentralised treatment closer to source such as constructed wetlands) and maintenance of existing infrastructure (Arumugam et al., 2023), reducing waste production (Jones et al., 2022), and implementing changes in governance and accountability throughout the management hierarchy (DWS, 2023b; Lukat et al., 2022; Montwedi et al., 2021). The typically low-priority status given to the wastewater management sector needs to change to get the attention and resources it needs to avoid impending disaster (Edokpayi et al., 2020; Omohwovo, 2024).
Reinstating the GD assessments is a critical step towards addressing the wastewater crisis in South Africa. We now know that there was considerable deterioration during the interim period in which GD monitoring was halted - knowledge that is imperative for developing solutions (Ighalo and Adeniyi, 2020; Keshaviah et al., 2023). However, there are still many gaps in knowledge regarding design capacities, treatment volumes, and the efficiency of the sewage reticulation networks. Improving and upscaling the technical site assessments within the GD framework, used to inform the new 'very rough order of measurement' (VROOM) model for estimating maintenance and refurbishment costs (DWS, 2023a), is essential for improving wastewater management. This study clearly indicates that the technical site assessments require a much stronger focus on sewage reticulation. The performance of a WWTW is almost irrelevant if the sewage does not reach it in the first place, demonstrated by the unchanged GD scores for WWTW with severe reticulation issues discussed here. It is essential that monitoring happens at a much finer resolution, both temporally and spatially, than currently conventionally possible. There is strong potential for citizen science, or community-based monitoring, to aid in generating the monitoring data required to begin improving wastewater management (Quinlivan et al., 2020a,b; Warner et al., 2024). Tools such as the mini stream assessment scoring system (miniSASS) (Taylor et al., 2022), clarity or transparency tubes (Graham et al., 2024), or smartphone applications (Pattinson et al., 2023) can be invaluable augmentations to routine monitoring as first-order indications of problems related to wastewater reticulation and the performance of WWTW. Moreover, community involvement in water resource monitoring, and science more broadly, assists with environmental education and awareness, helping meet SDG 6 (Iroegbu et al., 2020; Quinlivan et al., 2020b).
CONCLUSIONS
Many countries, especially in the developing world, suffer from dysfunctional or corrupt governance, poor or outdated designs, inadequate monitoring, and a lack of well-maintained infrastructure (Büttner et al., 2022; Edokpayi et al., 2020; Ighalo and Adeniyi, 2020). It is estimated that 80-90% of wastewater in the developing world enters natural waterbodies insufficiently treated (AfDB et al., 2020; Jones et al., 2021; UN Habitat and WHO, 2018). There is clearly a need for just transitions to a circular economy and sustainable water resource management practices (Swilling, 2020; UNEP et al., 2010). To uphold its Constitutional right to sufficient and clean water, South Africa now finds itself attempting to remedy a human and ecological disaster. Proactive monitoring will enable an adaptive management response. However, monitoring must reflect the adequacy of wastewater treatment and whether wastewater reaches WWTWs, with the latter overlooked in the current GD assessment system. Turnaround will require significant political will and leadership. Presently, the GD system is incentive based, which appears inadequate to motivate proper performance. Penalties may be required to get the responsible authorities to address wastewater issues. Ultimately, improved wastewater management will save money, conserve water, decrease water scarcity, enhance water security, reduce disease burden, and improve the health of South Africa's people and freshwater ecosystems (Donnenfeld et al., 2018; Jones et al., 2022; Lukat et al., 2022). The same goes for countries worldwide: improving wastewater management is necessary to achieve the SDGs, ensuring safe and secure access to clean water and proper sanitation for all.
ACKNOWLEDGEMENTS
Our gratitude to Carla Hardman and Busisa SR Ntshangase for assistance with data handling and figure creation. We are also grateful to Futhi Vilakazi from uMngeni-uThukela Water, Steve Terry, and colleagues from the uMsunduze Catchment Management Forum who helped arrange access to the data used for the Pietermaritzburg case study. Funding for this research was provided by GroundTruth.
AUTHOR CONTRIBUTIONS
Philip Mark Graham: conceptualization; funding acquisition; investigation; methodology; project administration; writing -review and editing. Nicholas B. Pattinson: conceptualization; data curation; formal analysis; investigation; methodology; project administration; software; visualization; writing - original draft; writing - review and editing. David Still: conceptualization; data curation; formal analysis; investigation; methodology; writing -review and editing.
ORCIDS
P Mark Graham: https://orcid.org/0000-0001-9655-2296
Nicholas B Pattinson: https://orcid.org/0000-0002-2696-9069
REFERENCES
ABIA ALK, BALOYI T, TRAORE AN and POTGIETER N (2023) The African wastewater resistome: Identifying knowledge gaps to inform future research directions. Antibiotics 12 (5) 805. https://doi.org/10.3390/antibiotics12050805 [ Links ]
ADEWUMI JR, ILEMOBADE AA and VAN ZYL JE (2010) Treated wastewater reuse in South Africa: Overview, potential and challenges. Resour. Conserv. Recy. 55 (2) 221-231. https://doi.org/10.1016/j.resconrec.2010.09.012 [ Links ]
ADEWUMI JR and OLANREWAJU OO (2011) Green Drop Certification of wastewater treatment plants in South Africa - an initiative to reduce drinking water sources pollution and bedrock of wastewater reuse. Afr. J. Sci. Technol. Innov. Dev. 3 (4) 65-81. URL: https://hdl.handle.net/10520/EJC120541 (Accessed 7 May 2024). [ Links ]
AFDB, UNEP and GRID-ARENDAL (2020) Sanitation and Wastewater Atlas of Africa. Mafuta C, Goncalves AS, Baker E, Thygesen K, Macmillan-Lawler M and Patterson T (eds). African Development Bank, Abidjan. United Nations Environment Programme (UNEP), Nariobi. GRID-Arendal, Arendal. 284 pp. URL: https://coilink.org/20.500.12592/8hn5qk [ Links ]
AMOAH ID, REDDY P, SEIDU R and STENSTRÖM TA (2018) Removal of helminth eggs by centralized and decentralized wastewater treatment plants in South Africa and Lesotho: Health implications for direct and indirect exposure to the effluents. Environ. Sci. Pollut. Res. 25 12883-12895. https://doi.org/10.1007/s11356-018-1503-7 [ Links ]
ARCHER E, VOLSCHENK M, BROCKER L and WOLFAARDT GM (2021) A two-year study of emerging micro-pollutants and drugs of abuse in two Western Cape wastewater treatment works (South Africa). Chemosphere 285 131460. https://doi.org/10.1016/j.chemosphere.2021.131460 [ Links ]
ARUMUGAM P, ZUMA L, MERCER S, GOVENDER L, POCOCK J, BROUCKAERT CJ and GOUNDEN T (2023) The potential of decentralised wastewater treatment in urban and rural sanitation in South Africa: Lessons learnt from a demonstration-scale DEWATS within the eThekwini Municipality. Water SA 49 (1) 8-18. https://doi.org/10.17159/wsa/2023.v49.i1.3985 [ Links ]
BAKARE BF and ADEYINKA GC (2022) Evaluating the potential health risks of selected heavy metals across four wastewater treatment water works in Durban, South Africa. Toxics 10 (6) 340. https://doi.org/10.3390/toxics10060340 [ Links ]
BONTHUYS J (2018) Irrigation water use: In-depth study sheds light on irrigated farming areas, water use. The Water Wheel 17 (4) 26-29. URL: https://hdl.handle.net/10520/EJC-102901ed39 (Accessed 7 May 2024). [ Links ]
BROOKS BW, RILEY TM and TAYLOR RD (2006) Water quality of effluent-dominated ecosystems: Ecotoxicological, hydrological, and management considerations. Hydrobiologia 556 365-379. https://doi.org/10.1007/s10750-004-0189-7 [ Links ]
BRÜHL J and VISSER M (2021) The Cape Town drought: A study of the combined effectiveness of measures implemented to prevent "Day Zero". Water Resour. Econ. 34 100177. https://doi.org/10.1016/j.wre.2021.100177 [ Links ]
BÜTTNER O, JAWITZ JW, BIRK S and BORCHARDT D (2022) Why wastewater treatment fails to protect stream ecosystems in Europe. Water Res. 217 118382. https://doi.org/10.1016/j.watres.2022.118382 [ Links ]
COLLIER SA, DENG L, ADAM EA, BENEDICT KM, BESHEARSE EM, BLACKSTOCK AJ, BRUCE BB, DERADO G, EDENS C, FULLERTON KE and co-authors (2021) Estimate of burden and direct healthcare cost of infectious waterborne disease in the United States. Emerg. Infect. Dis. 27 (1) 140-149. https://doi.org/10.3201/eid2701.190676 [ Links ]
DEBLONDE T, COSSU-LEGUILLE C and HARTEMANN P (2011) Emerging pollutants in wastewater: A review of the literature. Int. J. Hyg. Environ. Health 214 (6) 442-448. https://doi.org/10.1016/j.ijheh.2011.08.002 [ Links ]
DEFLORIO-BARKER S, WING C, JONES RM and DOREVITCH S (2018) Estimate of incidence and cost of recreational waterborne illness on United States surface waters. Environ. Health 17 (3) 1-10. https://doi.org/10.1186/s12940-017-0347-9 [ Links ]
DONNENFELD Z, CROOKES C and HEDDEN S (2018) A delicate balance: Water scarcity in South Africa. ISS Southern Africa Report 13. March 2018. Institute for Security Studies (ISS), Pretoria. URL: https://hdl.handle.net/10520/EJC-1486c3180a (Accessed 7 May 2024). [ Links ]
DUNGENI M, VAN DER MERWE RR and MOMBA MNB (2010) Abundance of pathogenic bacteria and viral indicators in chlorinated effluents produced by four wastewater treatment plants in the Gauteng Province, South Africa. Water SA 36 (5) 607-614. https://doi.org/10.4314/wsa.v36i5.61994 [ Links ]
DWAF (Department of Water Affairs and Forestry, South Africa) (1996) South African Water Quality Guidelines (2nd edn). Department of Water Affairs and Forestry, Pretoria. URL: https://www.iwa-network.org/filemanager-uploads/WQ_Compendium/Database/Selected_guidelines/041.pdf (Accessed 7 May 2024). [ Links ]
DWS (Department of Water and Sanitation, South Africa) (2013) Green Drop report. Department of Water and Sanitation, Pretoria. URL: https://www.dws.gov.za/Documents/Executive%20Summary%20for%20the%202013%20Green%20Drop%20Report.pdf (Accessed 7 May 2024). [ Links ]
DWS (Department of Water and Sanitation, South Africa) (2018) National water and sanitation master plan: Ready for the future ahead of the curve. Volume 1. Department ofWater and Sanitation, Pretoria. 80 pp. URL: https://www.dws.gov.za/National%20Water%20and%20Sanitation%20Master%20Plan/Documents/NWSMP(Master%20Plan)%20Call%20to%20Action%20v10.1.pdf#page=10 (Accessed 7 May 2024). [ Links ]
DWS (Department of Water and Sanitation, South Africa) (2022) Green Drop report. Department of Water and Sanitation, Pretoria. URL: https://ws.dws.gov.za/iris/releases/Report_DPW_Rev02_29Mar22_MN%20web.pdf (Accessed 7 May 2024). [ Links ]
DWS (Department of Water and Sanitation, South Africa) (2023a) Green Drop Progress Assessment Report. Department of Water and Sanitation, Pretoria. URL: https://ws.dws.gov.za/IRIS/releases/GDPAT_2023_Report.pdf (Accessed 7 May 2024). [ Links ]
DWS (Department of Water and Sanitation, South Africa) (2023b) Green Drop Watch Report. Department of Water and Sanitation, Pretoria. URL: https://ws.dws.gov.za/iris/releases/GDWR.pdf (Accessed 7 May 2024). [ Links ]
DYER SD, PENG C, MCAVOY DC, FENDINGER NJ, MASSCHELEYN P, CASTILLO LV and LIM JMU (2003) The influence of untreated wastewater to aquatic communities in the Balatuin River, The Philippines. Chemosphere 52 (1) 43-53. https://doi.org/10.1016/S0045-6535(03)00269-8 [ Links ]
EDOKPAYI JN, ENITAN-FOLAMI AM, ADEEYO AO, DUROWOJU OS, JEGEDE AO and ODIYO JO (2020) Recent trends and national policies for water provision and wastewater treatment in South Africa. In: SINGH P, MILSHINA Y, TIAN K, GUSAIN D and BASSIN JP (eds) Water Conservation and Wastewater Treatment in BRICS Nations - Technologies, Challenges, Strategies and Policies. Elsevier, Amsterdam. https://doi.org/10.1016/B978-0-12-818339-7.00009-6 [ Links ]
EDOKPAYI JN, ODIYO JO and DUROWOJU OS (2017) Impact of wastewater on surface water quality in developing countries: A case study of South Africa. In: Tutu H (ed.) Water Quality. InTech, Rijeka, Croatia. https://doi.org/10.5772/66561 [ Links ]
GRAHAM PM, PATTINSON NB, LEPHEANA AT and TAYLOR J (2024) Clarity tubes as effective citizen science tools for monitoring wastewater treatment works and rivers. Integr. Environ. Assess. Manage. 20 (5) 1463-1472. https://doi.org/10.1002/ieam.4937 [ Links ]
IBANGHA I-AI, DIGWO DC, OZOCHI CA, ENEBE MC, ATEBA CN and CHIGOR VN (2023) A meta-analysis on the distribution of pathogenic Vibrio species in water sources and wastewater in Africa. Sci. Total Environ. 881 163332. https://doi.org/10.1016/j.scitotenv.2023.163332 [ Links ]
IGBINOSA EO and OKOH AI (2009) Impact of discharge wastewater effluents on the physico-chemical qualities of a receiving watershed in a typical rural community. Int. J. Environ. Sci. Technol. 6 (2) 175-182. https://doi.org/10.1007/BF03327619 [ Links ]
IGHALO JO and ADENIYI AG (2020) A comprehensive review of water quality monitoring and assessment in Nigeria. Chemosphere 260 127569. https://doi.org/10.1016/j.chemosphere.2020.127569 [ Links ]
ILOMS E, OLOLADE OO, OGOLA HJO and SELVARAJAN R (2020) Investigating industrial effluent impact on municipal wastewater treatment plant in Vaal, South Africa. Int. J. Environ. Res. Public Health 17 (3) 1096. https://doi.org/10.3390/ijerph17031096 [ Links ]
IROEGBU AOC, SADIKU RE, RAY SS and HAMAM Y (2020) Plastics in municipal drinking water and wastewater treatment plant effluents: Challenges and opportunities for South Africa-a review. Environ. Sci. Pollut. Res. 27 12953-12966. https://doi.org/10.1007/s11356-020-08194-5 [ Links ]
ISHII S and SADOWSKY MJ (2008) Escherichia coli in the environment: Implications for water quality and human health. Microbes Environ. 23 (2) 101-108. https://doi.org/10.1264/jsme2.23.101. [ Links ]
JONES ER, VAN VLIET MTH, QADIR M and BIERKENS MFP (2021) Country-level and gridded estimates of wastewater production, collection, treatment and reuse. Earth Syst. Sci. Data 13 (2) 237-254. https://doi.org/10.5194/essd-13-237-2021 [ Links ]
JONES ER, BIERKENS MFP, WANDERS N, SUTANUDJAJA EH, VAN BEEK LPH and VAN VLIET MTH (2022) Current wastewater treatment targets are insufficient to protect surface water quality. Commun. Earth Environ. 3 (1) 221. https://doi.org/10.1038/s43247-022-00554-y [ Links ]
KELLY K (2021) Blue Drop and Green Drop certification programme revitalised. Water & Sanitation Africa 16 (4) 52-53. URL: https://hdl.handle.net/10520/ejc-sh_san_v16_n4_a27 (Accessed 7 May 2024). [ Links ]
KESHAVIAH A, DIAMOND MB, WADE MJ and SCARPINO SV on behalf of the GLOBAL WASTEWATER ACTION GROUP (2023) Wastewater monitoring can anchor global disease surveillance systems. The Lancet Glob. Health 11 (6) e976-e981. https://doi.org/10.1016/S2214-109X(23)00170-5 [ Links ]
LEE D, GIBSON JM, BROWN J, HABTEWOLD J and MURPHY HM (2023) Burden of disease from contaminated drinking water in countries with high access to safely managed water: A systematic review. Water Res. 120244. https://doi.org/10.1016/j.watres.2023.120244 [ Links ]
LIU J, KATTEL G, ARP HPH and YANG H (2015) Towards threshold-based management of freshwater ecosystems in the context of climate change. Ecol. Model. 318 265-274. https://doi.org/10.1016/j.ecolmodel.2014.09.010 [ Links ]
LIU J, YANG H, GOSLING SN, KUMMU M, FLÖRKE M, PFISTER S, HANASAKI N, WADA Y, ZHANG X, ZHENG C and co-authors (2017) Water scarcity assessments in the past, present, and future. Earth's Future 5 (6) 545-559. https://doi.org/10.1002/2016EF000518 [ Links ]
LUKAT E, PAHL-WOSTL C and LENSCHOW A (2022) Deficits in implementing integrated water resources management in South Africa: The role of institutional interplay. Environ. Sci. Polic. 136 304-313. https://doi.org/10.1016/j.envsci.2022.06.010 [ Links ]
MEMA V (2010) Impact of poorly maintained wastewater sewage treatment plants-lessons from South Africa: Wastewater management. ReSource 12 (3) 60-65. URL: https://hdl.handle.net/10520/EJC90239 (Accessed 7 May 2024). [ Links ]
MILLINGTON N and SCHEBA S (2021) Day zero and the infrastructures of climate change: Water governance, inequality, and infrastructural politics in Cape Town's water crisis. Int. J. Urb. Regional Res. 45 (1) 116-132. https://doi.org/10.1111/1468-2427.12899 [ Links ]
MONTWEDI M, MUNYARADZI M, PINOY L, DUTTA A, IKUMI DS, MOTOASCA E and DER BRUGGEN B (2021) Resource recovery from and management of wastewater in rural South Africa: Possibilities and practices. J. Water Process Eng. 40 101978. https://doi.org/10.1016/j.jwpe.2021.101978 [ Links ]
NAIDOO S and OLANIRAN AO (2014) Treated wastewater effluent as a source of microbial pollution of surface water resources. Int. J. Environ. Res. Public Health 11 (1) 249-270. https://doi.org/10.3390/ijerph110100249 [ Links ]
NTOMBELA C, FUNKE N, MEISSNER R, STEYN M and MASANGANE W (2016) A critical look at South Africa's Green Drop programme. Water SA 42 (4) 703-710. https://doi.org/10.4314/wsa.v42i4.21 [ Links ]
OBAIDEEN K, SHEHATA N, SAYED ET, ABDELKAREEM MA, MAHMOUD MS and OLABI AG (2022) The role of wastewater treatment in achieving sustainable development goals (SDGs) and sustainability guideline. Energ. Nexus 7 100112. https://doi.org/10.1016/j.nexus.2022.100112 [ Links ]
OMOHWOVO EJ (2024) Wastewater management in Africa: Challenges and recommendations. Environ. Health Insights 18 11786302241289680. https://doi.org/10.1177/11786302241289681 [ Links ]
PATTINSON NB, TAYLOR J, DICKENS CWS and GRAHAM PM (2023) Digital innovation in citizen science water quality monitoring in developing countries. IWMI Working Paper 210. International Water Management Institute (IWMI), Colombo. 52 pp. https://doi.org/10.5337/2024.201 [ Links ]
PRICE RG and WILDEBOER D (2017) E. coli as an indicator of contamination and health risk in environmental waters. In: Samie A (ed.) Escherichia coli - Recent Advances on Physiology, Pathogenesis and Biotechnological Applications. https://doi.org/10.5772/67330 [ Links ]
QUINLIVAN L, CHAPMAN DV and SULLIVAN T (2020a) Applying citizen science to monitor for the Sustainable Development Goal Indicator 6.3. 2: A review. Environ. Monit. Assess. 192 (218) 1-11. https://doi.org/10.1007/s10661-020-8193-6 [ Links ]
QUINLIVAN L, CHAPMAN DV and SULLIVAN T (2020b) Validating citizen science monitoring of ambient water quality for the United Nations Sustainable Development Goals. Sci. Total Environ. 699 134255. https://doi.org/10.1016/j.scitotenv.2019.134255 [ Links ]
R CORE TEAM (2024) R: A language and environment for statistical computing. Version 4.2.3. R Foundation for Statistical Computing, Vienna. URL: https://www.R-project.org/ (Accessed 31 March 2025). [ Links ]
REBELO AJ, HOLDEN PB, ESLER K and NEW MG (2021) Benefits of water-related ecological infrastructure investments to support sustainable land-use: A review of evidence from critically water-stressed catchments in South Africa. R. Soc. Open Sci. 8 (4) 201402. https://doi.org/10.1098/rsos.201402 [ Links ]
RSTUDIO TEAM (2024) RStudio: Integrated Development Environment for R. RStudio, PBC, Boston MA. URL: http://www.rstudio.com/ [ Links ]
SADOFF CW, BORGOMEO E and UHLENBROOK S (2020) Rethinking water for SDG 6. Nat. Sustainability 3 (5) 346-347. https://doi.org/10.1038/s41893-020-0530-9 [ Links ]
SLABBERT S (2022) Barometer study: Users' perceptions on the state of water services. Water Research Commission, Pretoria. WRC Report No. TT 909/22. URL: https://wrc.org.za/?mdocs-file=64405 (Accessed 07 May 2024). [ Links ]
SOME S, MONDAL R, MITRA D, JAIN D, VERMA D and DAS S (2021) Microbial pollution of water with special reference to coliform bacteria and their nexus with environment. Energ. Nexus 1 100008. https://doi.org/10.1016/j.nexus.2021.100008 [ Links ]
STATS SA (Statistics South Africa) (2020) Healthcare and education spending: GP and WC the odd ones out. Statistics South Africa, Pretoria. URL: https://www.statssa.gov.za/?p=14755 (Accessed 7 May 2024). [ Links ]
STATS SA (Statistics South Africa) (2022) Provinces at a glance. Statistics South Africa, Pretoria. URL: https://census.statssa.gov.za/#/ (Accessed 7 May 2024). [ Links ]
SWILLING M (2020) The Age of Sustainability: Just Transitions in a Complex World. Routledge, Abingdon. 338 pp. https://doi.org/10.4324/9780429057823 [ Links ]
TAYLOR J, GRAHAM PM, LOUW AJ, LEPHEANA AT, MADIKIZELA B, DICKENS CWS, CHAPMAN DV and WARNER S (2022) Social change innovations, citizen science, miniSASS and the SDGs. Water Polic. 24 (5) 708-717. https://doi.org/10.2166/wp.2021.264 [ Links ]
TONG Y, WANG X and ELSER JJ (2022) Unintended nutrient imbalance induced by wastewater effluent inputs to receiving water and its ecological consequences. Front. Environ. Sci. Eng. 16 (11) 149. https://doi.org/10.1007/s11783-022-1584-x [ Links ]
TORTAJADA C (2020) Contributions of recycled wastewater to clean water and sanitation Sustainable Development Goals. NPJ Clean Water 3 (1) 22. https://doi.org/10.1038/s41545-020-0069-3 [ Links ]
TORTAJADA C and VAN RENSBURG P (2020) Drink more recycled wastewater. Nature 577 (7788) 26-28. https://doi.org/10.1038/d41586-019-03913-6 [ Links ]
UN (2019) World Urbanization Prospects: The 2018 Revision (ST/ESA/SER.A/420). United Nations, New York. URL: https://population.un.org/wup/Publications/Files/WUP2018-Report.pdf (Accessed 7 May 2024). [ Links ]
UN HABITAT and WHO (2018) Progress on safe treatment and use of wastewater: Piloting the monitoring methodology and initial findings for SDG indicator 6.3.1. United Nations (UN) Habitat & World Health Organisation (WHO): Guidelines on Sanitation and Health. 40 pp. URL: https://iris.who.int/handle/10665/275967 (Accessed 7 May 2024). [ Links ]
UN WATER (2016) Integrated monitoring guide for SDG 6: Targets and global indicators. United Nations (UN) Water, Geneva. 26 pp. URL: https://www.unwater.org/sites/default/files/app/uploads/2017/03/SDG-6-targets-and-global-indicators_2016-07-19.pdf (Accessed 7 May 2024). [ Links ]
UNEP and UN HABITAT (2010) Sick Water? The central role of wastewater management in sustainable development. A rapid response assessment. United Nations Environment Programme (UNEP) and United Nations Human Settlements Programme. 88 pp. URL: https://wedocs.unep.org/20.500.11822/9156 (Accessed 7 May 2024). [ Links ]
UNEP and UN WATER (2018) Progress on ambient water quality. Piloting the monitoring methodology and initial findings for SDG indicator 6.3.2. United Nations Environment Programme (UNEP), Nairobi. URL: https://www.unwater.org/publications/progress-ambient-water-quality-piloting-monitoring-methodology-and-initial-findings (Accessed 7 May 2024). [ Links ]
UNICEF (2023) Triple threat: How disease, climate risks, and unsafe water, sanitation and hygiene create a deadly combination for children. United Nations Children's Fund (UNICEF), New York, USA. 24 pp. URL: https://www.unicef.org/media/137206/file/triple-threat-wash-EN.pdf (Accessed 7 May 2024). [ Links ]
USEPA (United States Environmental Protection Agency) (2012) Recreational water quality criteria. USEPA, Washington DC. URL: https://www.epa.gov/sites/default/files/2015-10/documents/rwqc2012.pdf (Accessed 7 May 2024). [ Links ]
VILLARÍN MC and MEREL S (2020) Paradigm shifts and current challenges in wastewater management. J. Hazardous Mater. 390 122139. https://doi.org/10.1016/j.jhazmat.2020.122139 [ Links ]
WAGENHOFF A, LIESS A, PASTOR A, CLAPCOTT JE, GOODWIN EO and YOUNG RG (2017) Thresholds in ecosystem structural and functional responses to agricultural stressors can inform limit setting in streams. Freshwater Sci. 36 (1) 178-194. https://doi.org/10.1086/690233 [ Links ]
WANG H, WANG T, ZHANG B, LI F, TOURE B, OMOSA IB, CHIRAMBA T, ABDEL-MONEM M and PRADHAN M (2014) Water and wastewater treatment in Africa-current practices and challenges. Clean Soil Air Water 42 (8) 1029-1035. https://doi.org/10.1002/clen.201300208 [ Links ]
WANG M, BODIRSKY BL, RIJNEVELD R, BEIER F, BAK MP, BATOOL M, DROPPERS B, POPP A, VAN VLIET MTH and STROKAL M (2024) A triple increase in global river basins with water scarcity due to future pollution. Nat. Commun. 15 (1) 880. https://doi.org/10.1038/s41467-024-44947-3 [ Links ]
WARNER S, BLANCO RAMÍREZ S, DE VRIES S, MARANGU N, ATEBA BESSA H, TORANZO C, IMARALIEVA M, ABRATE T, KIMINTA E, CASTRO J and co-authors (2024) Empowering citizen scientists to improve water quality: From monitoring to action. Front. Water 6 1367198. https://doi.org/10.3389/frwa.2024.1367198 [ Links ]
WHO (2023) Strong systems and sound investments: Evidence on and key insights into accelerating progress on sanitation, drinking-water and hygiene: UN-water global analysis and assessment of sanitation and drinking-water (GLAAS) 2022 report. World Health Organization (WHO), Geneva. 96 pp. URL: https://apps.who.int/iris/bitstream/handle/10665/365297/9789240065031-eng.pdf?sfvrsn=f6b6f522_13 (Accessed 7 May 2024). [ Links ]
WHO and UNICEF (2021) Progress on household drinking water, sanitation and hygiene 2000-2020: five years into the SDGs. World Health Organization (WHO) and the United Nations Children's Fund (UNICEF), Geneva, 162 pp. URL: https://www.who.int/publications/i/item/9789240030848 (Accessed 7 May 2024). [ Links ]
WICKHAM H (2016) ggplot2: Elegant graphics for data analysis. Springer-Verlag, New York. URL: https://ggplot2.tidyverse.org [ Links ]
WOOD SN (2011) Fast stable restricted maximum likelihood and marginal likelihood estimation of semiparametric generalized linear models. J. R. Stat. Soc. Ser. B: Stat. Method. 73 (1) 3-36. https://doi.org/10.1111/j.1467-9868.2010.00749.x [ Links ]
WORLD BANK (2023) Population, total - South Africa. World Development Indicators. World Bank, Washington DC. URL: https://data.worldbank.org/indicator/SP.POP.TOTL?locations=ZA (Accessed 7 May 2024). [ Links ]
ZVIMBA JN, MUSVOTO E V, NHAMO L, MABHAUDHI T, NYAMBIYA I, CHAPUNGU L and SAWUNYAMA L (2021) Energy pathway for transitioning to a circular economy within wastewater services. Case Stud. Chem. Environ. Eng. 4 100144. https://doi.org/10.1016/j.cscee.2021.100144 [ Links ]
 Correspondence:
P Mark Graham
Email:grahamp@ukzn.ac.za
Received: 10 July 2024
Accepted: 25 March 2025
APPENDIX
Supporting information: methods
Data availability: Pietermaritzburg case study
Inflow data for the Darvill WWTW and Escherichia coli data from the 18 river monitoring sites in Pietermaritzburg (Fig. A1; Table A1) were publicly available within monthly catchment management forum reports and used with permission from Umgeni Water who collect the data as part of DWS-mandated monitoring.
Supporting information: results
The average percentage of the DCU was similar in 2021 (79.4% ± 59.8 SD) compared to 2013 (80.3% ± 46.6 SD; Fig. A2). In total, 212 (49.2%) of the 431 WWTW with comparable data showed decreases in their DVT between 2013 and 2021 (Fig. A2). Overall, the DVT across South Africa decreased by 0.11 ML-day-1 per WWTW ± 11.73 SD between 2013 and 2021, though this was only based on the 431 WWTW with comparable data, so the actual value may be significantly different (Fig. A2).
The percentage of the 18 water quality monitoring sites in the Pietermaritzburg area that recorded E. coli counts > 100 000 CFU-100 mL-1 each week showed a steady slight increase (from ~1% on average to ~5% of sites by 2012) from 2006 until approximately 2016, where it began to rise more rapidly (estimate 8.40 ± 0.30 SE, t = 27.75, p < 0.001; Fig. A3). By 2022, ~30% of sites were recording E. coli counts > 100 000 CFU-100 mL-1 each week (Fig. A3).
