


Services on Demand
Journal

Article
 English (pdf)
 Article in xml format
 Article references
 Send this article by e-mail
Indicators
Related links
-
 Cited by Google
 -
 Similars in Google
Share

 Permalink
South African Journal of Animal Science
On-line version ISSN 2221-4062Print version ISSN 0375-1589
S. Afr. j. anim. sci. vol.55 n.6 Pretoria 2025
https://doi.org/10.17159/sajas.v55i6.02
Body conformation and weight relationships in Dohne Merino sheep: A comparison of measured and subjective traits
M.A. Snyman; W.J. Olivier
Grootfontein Agricultural Development Institute, Private Bag X529, Middelburg (EC), 5900, South Africa
ABSTRACT
The morphometric and type traits of 269 Dohne Merino ram lambs were measured and/or assessed at four, eight, and 12 months of age. Body conformation scores were also awarded independently by three judges at each age. Estimated phenotypic correlations between conformation traits and body weights were significant for most of the measured morphometric traits and body conformation scores but not for the subjectively evaluated traits. Four principal components that accounted for all of the total variances were extracted for each age. Principal component one was more related to traits describing general body size, whereas principal component two was determined by traits describing the body heights of the sheep. In the stepwise regression of the effects of individual conformation traits on body weight, heart girth and body length explained the most variance in body weight at all three ages. Considerable variation between judges was found in the traits contributing most to the body conformation score. At four months of age, the only trait of importance common to all three judges was heart girth, while at eight months of age, conformation of the head, shoulder width, and body condition score were the most important traits. At 12 months of age, body length was the most important trait for all three judges, when assessing body conformation score. The three judges clearly emphasised different traits when assessing body conformation and awarding classification symbols. This would lead to different sires being eligible for selection at different studs, potentially hindering selection progress in the breed.
Keywords: correlations, multivariate regression, principal component analysis, repeatability
Introduction
The visual appraisal of animals during classing and selection has been practiced for as long as animals have been selected for improved performance. Apart from economically important traits such as reproduction, body weight, and fleece weight, as well as objectively measured wool quality traits, subjective traits are also considered during selection. In many instances, more emphasis is placed on subjective traits during selection than on objectively measured traits. Various systems have been developed over the years for different sheep breeds to accommodate the assessment of subjective wool and conformation traits for inclusion in breeding programmes (Snyman & Olivier, 2002; Janssens & Vandepitte, 2004; Mortimer et al., 2010; Zishiri et al., 2013).
The selection of breeding sires and dams in the South African Dohne Merino breed is based on both objective measurements and the subjective assessment of various conformation and performance traits. The selection index for general merit for the breed incorporates a number of performance traits, namely the direct and maternal weaning weight, clean fleece weight, and fibre diameter. A classification symbol is assigned to each animal according to its general merit performance within its wool-test group, and this is referred to as the performance selection index (SIP) value of the animal. A sheep is classified as AA if its SIP >100, A if 90< SIP <100, and B if SIP <90. At selection age, the sheep are classed subjectively, and a final classification symbol is awarded based on this assessment, with consideration of the general merit index symbol the animal qualified for. Sheep that are culled receive a C-symbol, and only rams that received an AA-symbol are eligible to be used as sires in a stud, while A and B rams may be used as sires in commercial flocks.
Body conformation, as an indication of carcass conformation, is one of the subjective traits on which considerable emphasis is placed during selection. A subjective wool score and subjective conformation score are awarded during classing, and both play an important role in determining the animal's final classification symbol. In some Dohne Merino studs, up to 45% of the rams that qualified for an AA-symbol based on their general merit index, are not awarded an AA classification symbol upon subjective evaluation. This could lead to animals with superior genetics for economically important production traits being culled based on subjectively assessed traits and the personal preference of the judge.
It has also been observed that the classification symbol awarded to an animal often changes when the animal is assessed again at an older age. This change could be partly ascribed to the changes in body dimensions that occur over time, secondary to the relative growth patterns of the different parts of the body. This is supported by the significant effect of age on measured morphometric body conformation traits reported in the literature (López-Carlos et al., 2010; Yakubu et al., 2011; Birteeb & Ozoje, 2012). Knowledge of the patterns of development of contributing morphometric traits will thus be useful in the assessment of body conformation. However, the repeatability of the judge and changing environmental conditions could also play a role. Furthermore, definitions of body conformation in the literature vary from quite simple to more complex, and, according to Nsoso et al. (2002), the challenge is that there is no single universally accepted definition of the term 'body conformation' across the sheep industry. In many instances, the assessment of body conformation is therefore influenced by the individual interpretation of the judge.
The measurement of various body size and form traits (morphometric traits), in addition to body weight, can describe an animal more comprehensively than weight and grading alone (Salako, 2006a). Morphometric body conformation traits regularly recorded in other studies are body length (BLEN), wither height (WHEIGHT), rump height (RHEIGHT), heart girth (HGIRTH), abdominal circumference (ABDOM), rump width (RWIDTH), shoulder width (SWIDTH), rump length (RLEN), front cannon bone length (CBLEN), head length (HEADLEN), head width, tail length, and ear length. In most of the reported studies, HGIRTH had the highest correlation with body weight, of these recorded traits (Oke & Ogbonnaya, 2011; Birteeb & Ozoje, 2012; Temoso et al., 2017). However, there is a dearth of information on the relationship between the body conformation score and these individual morphometric traits. Positive phenotypic correlations between most of these measured body conformation traits were obtained by various authors for various breeds (Salako, 2006b; Yakubu, 2010; Abbasi & Ghafouri-Kesbi, 2011; Okpeku et al., 2011; Yakubu & Mohammed, 2012; Mavule et al., 2013; Yakubu, 2013; Jafari et al., 2014). Measured morphometric body conformation traits have also been used for the prediction of body weight (Dekhili & Aggoun, 2013; Tyasi et al., 2015; Ambarcioğlu et al., 2017; Tesfay et al., 2017) and carcass characteristics in the live animal (Tatum et al., 1998). Additionally, these traits can be used as indicators of type and function in domestic animals (Salako, 2006a).
In this study, a number of morphometric and type traits, as well as body conformation, were measured and/or assessed in Dohne Merino ram lambs at various ages. A Dohne Merino Breeders' Society classification symbol was also awarded to each animal at 12 months of age. The objectives of the study were to determine which of the measured and subjective body conformation traits or trait combinations contributed the most to the subjective body conformation score, classification symbol, and body weight, and how this was influenced by the different judges involved.
Materials and methods
Ethical clearance for the study was obtained from the Grootfontein Agricultural Development Institute (GADI) (AP2/22).
The 2018-born ram lambs (n = 269) of the Grootfontein Dohne Merino stud at GADI were used for this study. The lambs were born during August and September of 2018, and the existing pasture management and animal health programmes were followed. All lambs were identified and tagged at birth, and were weaned in December 2018, at 90 to 100 days of age. All progenies were kept until the age of 14 months. It is important to note that none of the lambs were culled at weaning, contrary to the normal farming practice of culling approximately 55% of ram lambs. All lambs and two-tooth sheep were kept on the veld throughout the year, where they received an energy-protein production lick, depending on the prevailing veld conditions.
Data collection
The following performance data, which are routinely collected for the GADI flock, were used in this study:
• Four-, eight-, and 12-month body weight (kg)
• Greasy fleece weight at 12 months of age (kg)
• Wool score and creeping belly score, awarded at 12 months of age.
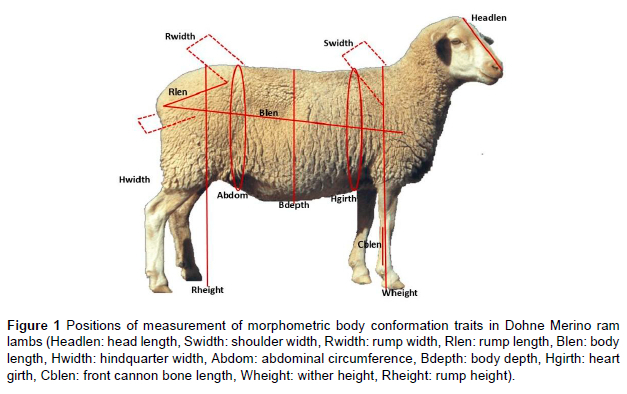
The morphometric body conformation traits measured are illustrated in Figure 1 and are listed below. These were recorded on all the ram lambs at four, eight, and 12 months of age.
The following morphometric body conformation traits were recorded:
• BLEN, measured from the tip of the scapula to the pin bone (Tuber ischii) (cm);
• WHEIGHT, measured vertically from the highest palpable spinous process to the ground (cm);
• RHEIGHT, measured vertically from the top of the pelvic girdle to the ground (cm);
• HGIRTH, measured as the body circumference immediately behind the forelegs (cm);
• ABDOM, measured as body circumference immediately in front of the hind legs (cm);
• Body depth (BDEPTH), measured vertically halfway between the HGIRTH and the ABDOM (cm);
• RWIDTH, measured between the left and right hip bones (Tuber coxae) (cm);
• SWIDTH, measured between the processes on the left and right scapulae (cm);
• Hindquarter width (HWIDTH), measured between the mid-left and mid-right positions of the femur (widest part of the hindquarters) (cm);
• RLEN, measured from the hip bone (Tuber coxae) to the pin bone (Tuber ischii) (cm);
• CBLEN, measured from the proximal to the distal end of the metacarpus (cm);
• HEADLEN, measured from between the ears (poll) to the tip of the nose (cm).
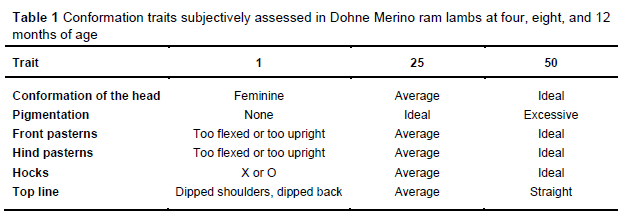
A graduated measuring stick with an attached calliper was used for the height, length, and width measurements. A flexible measuring tape was used for the circumference measurements. At four and 12 months of age, these measurements were taken after shearing the animals. When taking the measurements at eight months of age with a longer wool growth, the tips of the calliper were placed against the skin when taking the measurements. All measurements were carried out by the same person in order to eliminate operator variance. The conformation traits indicated in Table 1 were also assessed on a linear scale from 1 to 50 at four, eight, and 12 months of age.
The body condition score (BCS) of each animal was also recorded at each recording age. Body condition score was assessed on a scale of one to five, with one being an emaciated sheep, three being a sheep in average condition, and five being an obese sheep (Thompson & Meyer, 1994). Only one person assigned the BCS in order to eliminate operator variance.
Each animal was awarded a subjective body conformation score on a scale from one to nine by each of three judges at four, eight, and 12 months of age. The judging took place at consecutive times to avoid the judges being influenced by each other's scoring. At the 12-month assessment, a classification symbol according to the Dohne Merino Breeders' Society was awarded to each animal by each of the judges. These symbols were awarded taking only the conformation of the animal into account, as performance data were not available at this stage. A final classification symbol, taking all conformation and wool traits into consideration, was awarded at 14 months of age by Judge A. A classification symbol awarded based only on the general merit index of the Dohne Merino Breeders' Society was also determined for each animal.
Statistical analyses
The means, standard deviations, and coefficients of variation (CV) of the various traits recorded at four, eight, and 12 months of age, as well as those of the measured performance traits, were obtained using the PROC MEANS function of SAS (2016). The general linear model (GLM) procedure of SAS (SAS, 2016) was used to obtain the least-square means of the conformation traits at four, eight, and 12 months of age, as well as the phenotypic trends in each trait over the recorded age period. Least-square means of the different traits for the final classification symbol categories awarded at 12 months of age were also obtained using the GLM procedure of SAS (SAS, 2016). The following model was used to obtain the least-square means:
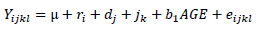
Where:
Yijkl = the trait of the lth animal, assessed by the kth judge, with the jth dam age and the ith rearing status;
μ = the overall mean;
ri = the fixed effect of the ith rearing status;
dj = the fixed effect of the jth dam age;
jk = the fixed effect of the kth judge (only for body conformation and classification symbols);
b1 = the linear regression coefficient of the age of the animal in days at the time of recording the specific trait; and
eijkl = the random error with zero mean and variance lσ2e
The phenotypic correlations between traits were obtained using the MANOVA/PRINTE option within the GLM procedure of SAS (2016). Models included the age and rearing status of the animal. The age of the dam had no effect on any of the traits and was excluded from the final models. These analyses included:
• Pearson correlations between conformation traits and body weights recorded at four, eight, and 12 months of age;
• Pearson correlations between conformation traits recorded at four, eight, and 12 months of age and the respective body conformation scores and classification symbols;
• Pearson correlations between conformation traits recorded at four months of age;
• Pearson correlations between conformation traits recorded at eight months of age; and
• Pearson correlations between conformation traits recorded at 12 months of age.
The results of the latter four analyses are not presented in this publication, but are included in the Discussion.
According to Yakubu et al. (2011), principal components are linear combinations of the original variables and are estimated in such a way that the first principal component explains the largest percentage of the total phenotypic variance. The varimax criterion of the orthogonal rotation method was employed for the rotation of the factor matrix. The choice of the varimax rotation was informed by its ability to maximise the sum of the variances of the squared loadings within each column of the loading matrix. This tends to produce some higher loadings and some loadings near zero, resulting in a simple structure that enhances the interpretability of the factors.
The following model was applied:
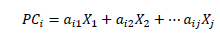
With:
i = 1,2 --- n principal components; and
j = 1,2 --- p original variables.
Where:
aij = the jth component of the coefficient vector of the linear transformation ; and
Xj = the original variable.
Principal component factor analyses were performed using the PROC FACTOR function of SAS (2016). The Kaiser-Meyer-Olkin measures of sampling adequacy were computed to test the validity of the data set. The cumulative proportion of variance criterion was employed in determining the number of factors to extract. The varimax criterion of the orthogonal rotation method was employed for the rotation of the factor matrix. Three principal component analyses were performed, namely analysis of the conformation traits measured and assessed at four, eight, and 12 months of age, excluding the body conformation scores.
A stepwise multiple regression procedure was used to obtain models for predicting the body weight, the body conformation as scored by the different judges, and the classification symbols, using the individual recorded traits (Equation 1) or the principal component factor scores (Equation 2):
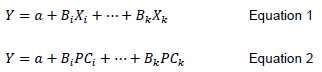
Where:
Y = the body weight, the body conformation as scored by the different judges, or the various classification symbols;
a = the regression intercept, and
Bi = the ith partial regression coefficient of the ith recorded individual trait (Xi), or the ith principal component (PCi).
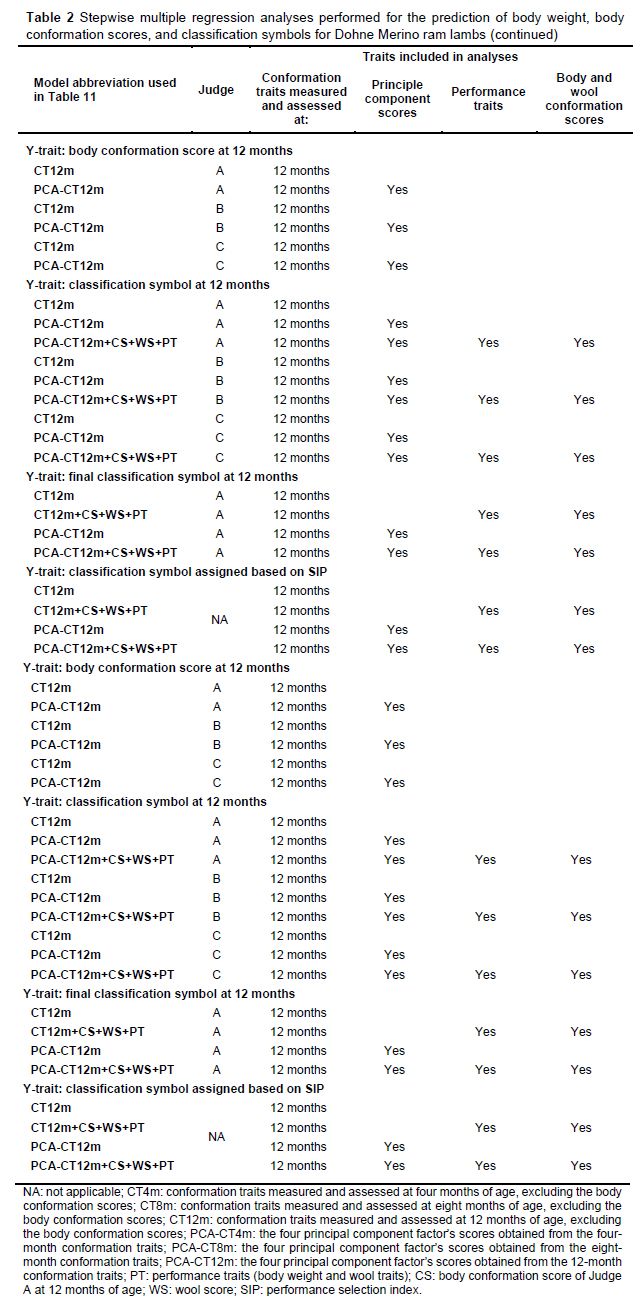
The PROC REG procedure of SAS (SAS, 2016), with the STEPWISE option, was applied for these analyses. Variables had to meet the P <0.05 significance level for entry into the model. Only traits that contributed more than 1% to the model were included in the final model. The various stepwise multiple regression analyses performed are summarised in Table 2.
Results
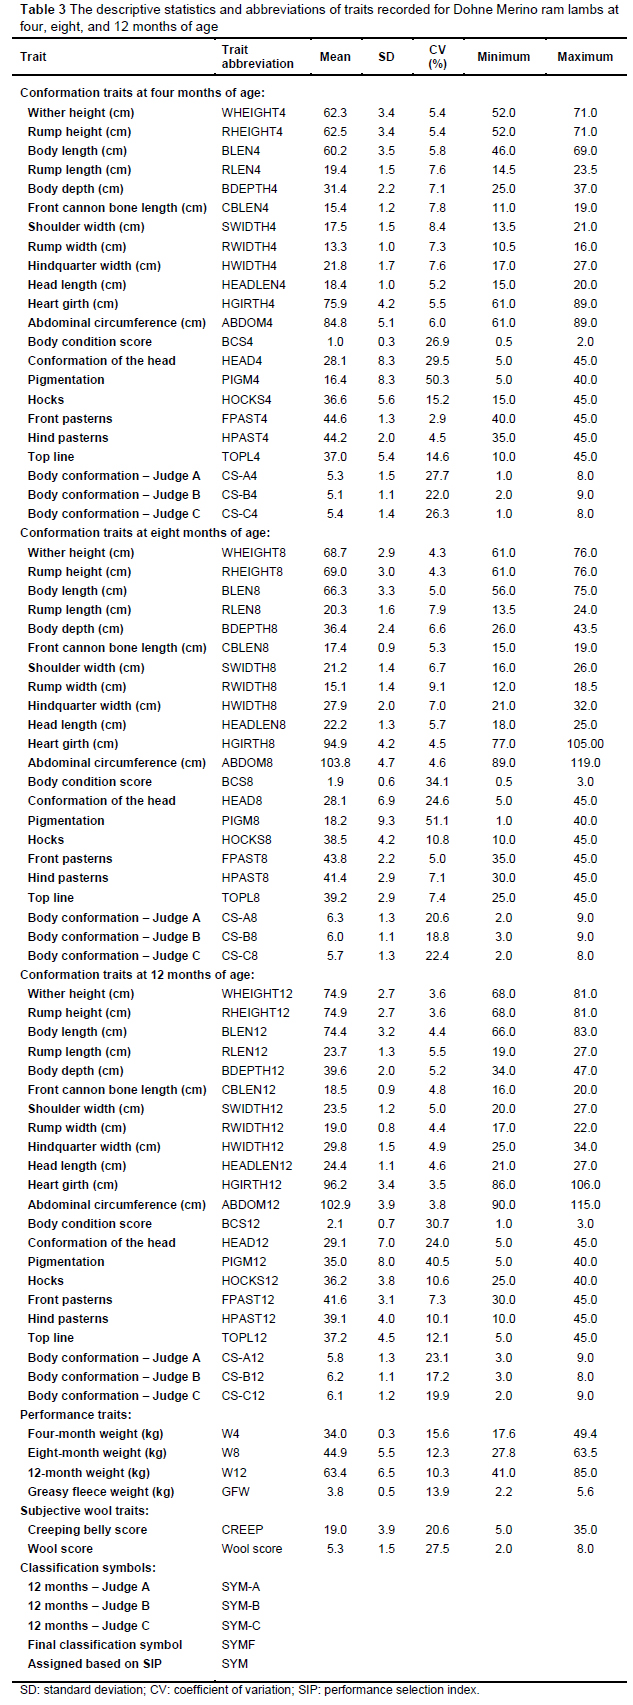
The recorded traits and the abbreviations used for the traits in the text, as well as the descriptive statistics for the traits at the various ages, are given in Table 3. Most of the conformation traits describing body measurements at all three ages had relatively low CV values, in comparison to those for the body weight, BCS, and body conformation score. Pigmentation had the highest CV, ranging between 51.1% at eight months of age and 40.5% at 12 months of age.
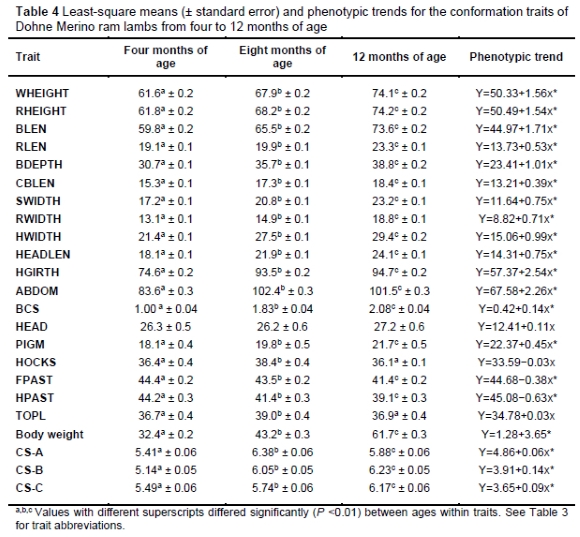
The least-square means of the conformation traits at four, eight, and 12 months of age, as well as the phenotypic trends for each trait over the recorded time period, are presented in Table 4. Significant trends were observed for all traits, apart from for the conformation of the head (HEAD), hocks (HOCKS), and top line (TOPL).
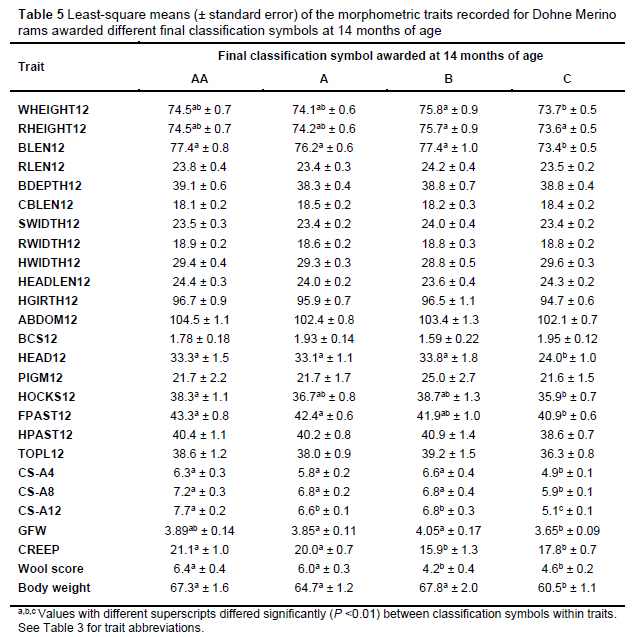
The least-square means of the morphometric traits of the rams awarded different final classification symbols at 14 months of age are presented in Table 5. For most of the morphometric traits, there were no differences between the rams awarded different symbols. No differences between AA, A, and B animals in any of the objectively measured conformation or performance traits were recorded.
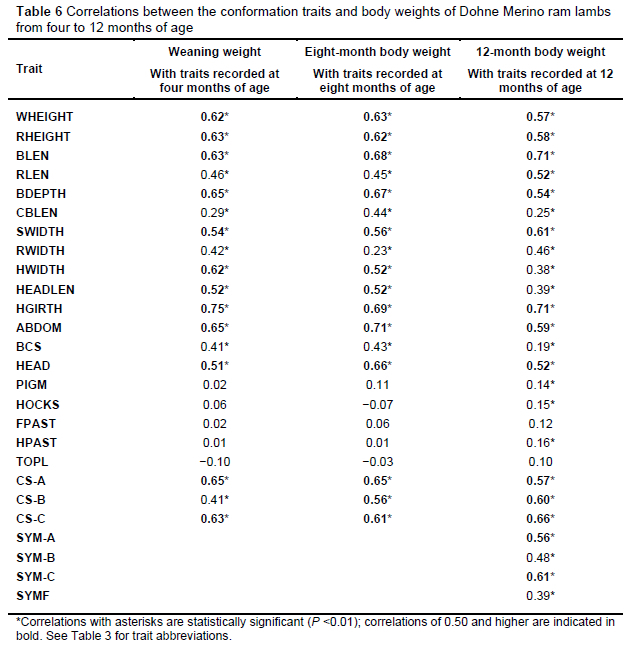
The phenotypic correlations between conformation traits and body weights are presented in Table 6. The magnitude of the correlations between the conformation traits and the respective body weights declined from four to 12 months of age. Favourable positive correlations higher than 0.50 were estimated between body weight and the conformation scores and symbols allocated by the various judges, apart from for the final classification symbol (SYMF).
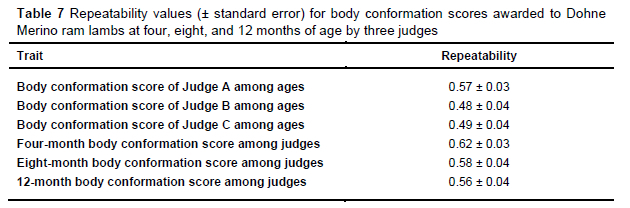
The repeatability values for the body conformation scores awarded at four, eight, and 12 months of age by the three judges are presented in Table 7. Judge A had the highest repeatability of body conformation scores between successive assessments (0.57). The highest repeatability among the judges was achieved at the four-month assessment.
The results of the principal component analyses for conformation traits recorded at four, eight, and 12 months of age are presented in Tables 8, 9, and 10, respectively. Partial correlations were low at all ages, indicating that true factors existed in the data sets. This was supported by the Kaiser-Meyer-Olkin overall measures of sampling adequacy of 0.91, 0.85, and 0.79, for four, eight, and 12 months of age, respectively, revealing the proportion of the variance in the body measurements caused by the underlying factor. The Kaiser-Meyer-Olkin measures of sampling adequacy for all individual traits were sufficiently high, with only the pigmentation (PIGM4), front pasterns (FPAST4), hind pasterns (HPAST4), and TOPL4 at four months of age, the pigmentation (PIGM8), HOCKS8, and hind pasterns (HPAST8) at eight months of age, and pigmentation at 12 months of age (PIGM12) having values below 0.60.
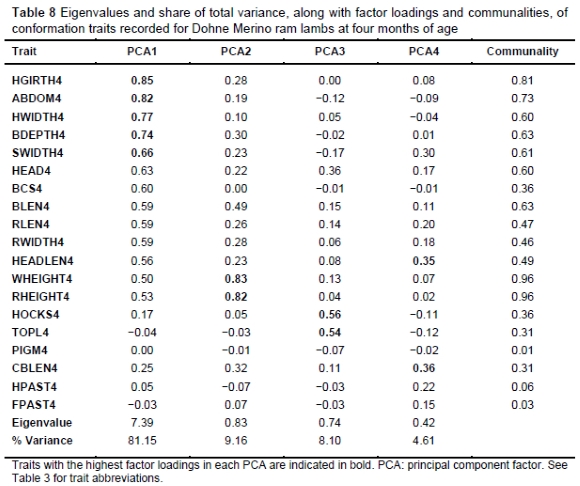
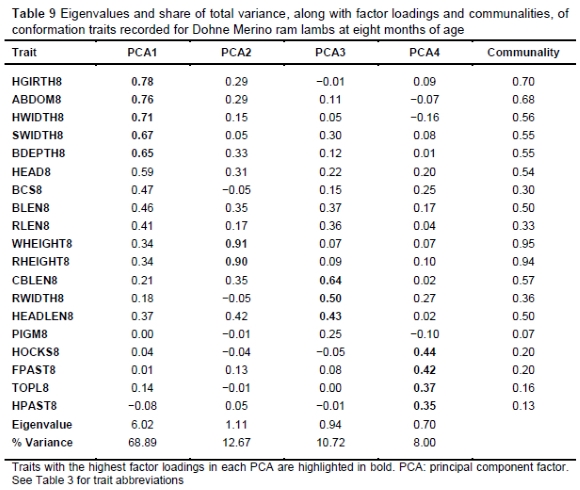
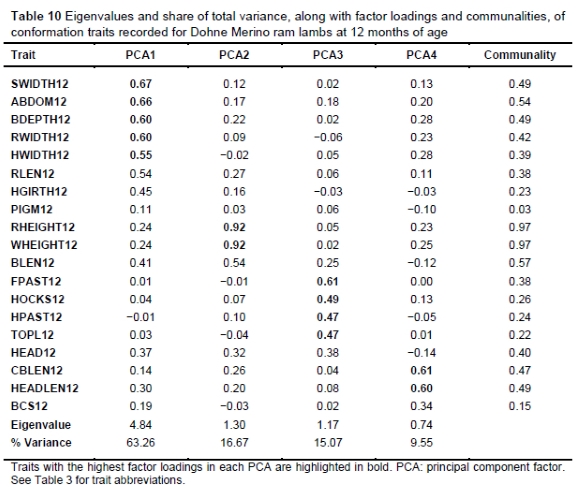
After varimax rotation of the component matrix, four principal components were extracted for each age, which accounted for all of the total variance. The first principal component (PCA1) was more related to those traits describing general body size, and contributed the most to the total variance at all three ages (81.15% at four months, 68.89% at eight months, and 63.26% at 12 months of age). The second principal component (PCA2) was primarily determined by RHEIGHT and WHEIGHT at all ages, and was thus related to the body heights of the sheep, and contributed between 9.16% and 16.67% to the total variance. Either a combination of various subjectively assessed traits (including HOCKS, FPAST, HPAST and/or TOPL) or HEADLEN and CBLEN had the highest loadings in the third (PCA3) and fourth principal components (PCA4) at all three ages. The communality values (which represent the proportion of variance of each variable that can be jointly explained by all the components) of several of the traits at each age were more than 50%.
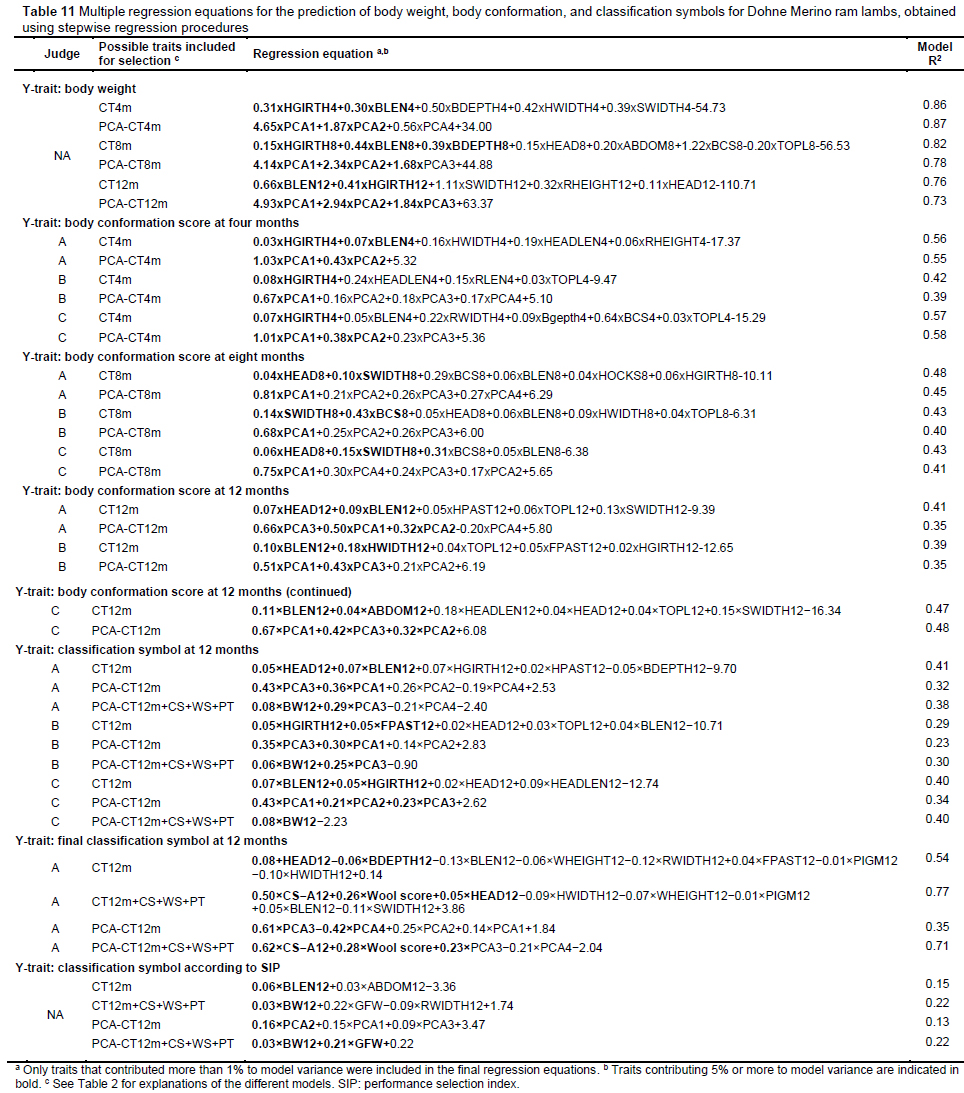
The results of the various stepwise analyses are presented in Table 11. The threshold of significance for the inclusion of traits in the final models was P <0.05. Only traits that contributed 1% or more to the variance of the respective model were included in the models discussed here. For explanations of the model abbreviations and the possible traits included in each model, see Table 2.
Heart girth and BLEN explained the most variance in body weight at all three ages, while BDEPTH8 also explained more than 5% of the variance in body weight at eight months of age. Heart girth explained the most variance in the body conformation scores of all judges at four months of age, while PCA1 explained the most variance for all judges when the PCA scores were included. Head conformation and SWIDTH8 explained the most variance in the body conformation scores of Judges A and C at eight months of age, while SWIDTH8 and BCS8 were the most important traits for Judge B. Again, PCA1 explained the most variance when the PCA scores were included for all judges. Body length at 12 months of age explained the most variance in the body conformation scores of Judges B and C at 12 months of age, while HEAD12 was the trait emphasised the most by Judge A. Consequently, PCA3 explained the most variance in the body conformation scores of Judge A at 12 months of age (CS-A12), when the PCA scores were included, while PCA1 explained the most variance for the body conformation scores at 12 months of age awarded by Judges B (CS-B12) and C (CS-C12). The final models differed between the judges, and various subjectively assessed traits were included. Many of the traits explained only 1% of the model variance.
As far as the results of the stepwise regression for the effects of conformation traits recorded at 12 months of age on the classification symbol awarded by the judges are concerned, although BLEN12, HGIRTH12, and HEAD12 were included in the models for all judges, it is evident that emphasis was placed on different traits by the different judges, when awarding the classification symbols. Only HEAD12 and BDEPTH12 contributed more than 5% of the variance in the final classification symbol, when only the conformation traits were included. When the conformation score, wool score, and performance traits were included as possible predictors, the conformation score (CS-A12), HEAD12, and wool score explained most of the variance in the final classification symbol, with conformation and wool scores contributing 65% of the variance. Body length at 12 months of age explained 13% of the variance in the classification symbol based on the SIP, when only the conformation traits were available as possible predictors for inclusion in the model.
Discussion
In this study, various measured and subjective body conformation traits or trait combinations were evaluated to determine the impact of different judges on subjective body conformation scores and classification symbols in the South African Dohne Merino breed. The South African Dohne Merino Breeders' Society has a single selection index based on performance data that all Dohne Merino breeders must use when selecting breeding sires and dams. However, in addition to selection based on this index, breed judges perform subjective assessments of various conformation and wool traits. In many cases, animals with superior performance traits are culled based on these subjective conformation assessments.
The CV of the measured conformation traits recorded in this study fell within the 4%-12% range reported for these traits in other sheep breeds in the literature (Cam et al., 2010; Yakubu, 2010; Abbasi & Ghafouri-Kesbi, 2011; Yakubu & Mohammed, 2012; Dekhili & Aggoun, 2013; Mavule et al., 2013; Yakubu, 2013; Jafari et al., 2014; Temoso et al., 2017). Most of the conformation traits describing body measurements at all three ages had relatively low CV, when compared to the CV found for body weight, BCS, and body conformation score. Higher CV were observed for the subjectively assessed traits HEAD, HOCKS, TOPL, and pasterns (front and hind), than for the measured conformation traits, and these values were also in line with the ranges reported in other studies (Snyman & Olivier, 2002; Matebesi et al., 2009).
Significant trends were observed for all conformation traits, with the exception of HEAD, HOCKS, and TOPL. Positive trends were observed for the traits related to skeletal dimensions, namely WHEIGHT, RHEIGHT, BLEN, RLEN, CBLEN, and HEADLEN, as well as for the traits that are more dependent on muscle and fat growth, namely BDEPTH, SWIDTH, RWIDTH, HWIDTH, HGIRTH, and ABDOM. The traits HOCKS (P >0.01), FPAST, and HPAST showed negative trends with age, possibly because any potential problems in these anatomical areas become more pronounced as the animal gets heavier with age. The body conformation scores also showed positive trends with age, most probably because of an association with the increase in body weight with age.
As far as the means of the recorded traits for the different final classification symbols awarded at 14 months of age are concerned, most of the traits did not differ between the rams awarded different classification symbols. The only trait that differed between the AA and A rams was the body conformation score at 12 months of age (CS-A12). The CS-A12 value, in turn, was influenced by BLEN12 and HEAD12, for which there was no difference between AA and A animals. Thus, the distinction between the AA and A classification could not be explained by these data. Similarly, B-category animals only differed from AA and A animals in the CS-A12 value, the creeping belly score, and the wool score, which are all subjectively assessed traits. No differences between the AA, A, and B rams in any of the objectively measured conformation or performance traits were recorded. More differences between the C-category and the AA, A, and B animals were observed. Animals awarded a C-symbol had shorter BLEN, poorer HEAD, FPAST, and HOCKS scores, lower wool scores, and inferior wool quality traits than rams classified as AA and A. The C-category rams also had lower body conformation scores, body weights, and greasy fleece weights than animals with the higher classification symbols. These differences were to be expected, as C rams are inferior animals and are considered cull animals.
Estimated phenotypic correlations between conformation traits and body weights in the current study were significant for most of the measured morphometric traits and body conformation scores, but were not significant for the subjectively evaluated traits. As found in the current study, HGIRTH had the highest correlation with body weight in most previously reported studies (Sowande & Sobola, 2008; Cam et al., 2010; Abbasi & Ghafouri-Kesbi, 2011; Oke & Ogbonnaya, 2011; Birteeb & Ozoje, 2012; Moela, 2014; Ambarcioğlu et al., 2017; Temoso et al., 2017). The previously reported correlations between WHEIGHT, RHEIGHT, BLEN, HGIRTH, BDEPTH, SWIDTH, and RWIDTH, and body weights at various ages, are similar to those estimated in the current study, and ranged from 0.53 to 0.84. Phenotypic correlations between the body weight and the subjectively assessed traits HOCKS (0.28), TOPL (0.21), PIGM (0.04), HEAD (0.55), and PAST (0.04) in Merino sheep were also lower than those obtained for the measured traits (Matebesi et al., 2009).
The high positive correlations of 0.41 to 0.66 between the body weight and the conformation scores and classification symbols allocated by the various judges estimated in the current study indicate that higher scores were allocated to heavier animals. Furthermore, all the traits related to general body size, skeletal dimensions, and the body conformation scores of all the judges showed positive trends with the increase in age during the trial period. The generally higher body conformation scores awarded to older rams could thus be linked to the larger body sizes and higher body weights of the animals at the later ages.
Phenotypic correlations between the recorded conformation traits within the same age (not reported here), as well as between the recorded traits at the different ages, were positive and significant for most of the measured morphometric traits, but were not significant for the subjectively evaluated traits HOCKS, FPAST, HPAST, and TOPL. Positive phenotypic correlations between most of the measured body conformation traits have been previously reported by various authors for various breeds (Salako, 2006a, 2006b; Sowande & Sobola, 2008; Cam et al., 2010; Yakubu, 2010; Abbasi & Ghafouri-Kesbi, 2011; Oke & Ogbonnaya, 2011; Okpeku et al., 2011; Yakubu & Mohammed, 2012; Dekhili & Aggoun, 2013; Mavule et al., 2013; Yakubu, 2013; Jafari et al., 2014; Ambarcioğlu et al., 2017; Temoso et al., 2017; Tesfay et al., 2017). Phenotypic correlations between the measured and assessed conformation traits recorded at four, eight, and 12 months of age and the respective body conformation scores and classification symbols (not reported here) were significant for most of the measured morphometric traits and body conformation scores, but were not significant for most of the subjectively evaluated traits (PIGM, HOCKS, FPAST, HPAST, and TOPL). Although the negative trends observed with age for HOCKS, FPAST, and HPAST might be explained by the fact that any possible problems with these traits became more pronounced as the animals got heavier with age, the influence of the judge on the subjective assessment of these traits should not be ignored. The moderate repeatability (ranging from 0.48 to 0.62) of body conformation scores between and among judges is a cause for concern. This emphasises the fact that there is no universal definition for body conformation on which judges can base their assessment.
Four PCAs were identified during the factor analyses at the various ages. The first PCA at all ages described general body size and contributed between 63% and 81% of the total variance. Traits included in PCA1 were HGIRTH, ABDOM, BDEPTH, HWIDTH, SWIDTH, and RWIDTH. The second PCA was determined by RHEIGHT and WHEIGHT at all ages, thus indicating the body height of the sheep. This factor contributed between 9% and 17% of the total variance. The third and fourth PCAs varied among the ages, but these two PCAs were either described by HOCKS, FPAST, HPAST, and TOPL (subjective conformation traits) or by HEADLEN and CBLEN (measurements of secondary skeletal dimensions). Various previous studies on conformation traits in sheep have reported that PCA1 had high factor loadings for traits representing general body size (Salako, 2006b; López-Carlos et al., 2010; Yakubu et al., 2011; Yakubu, 2013; Nunes et al., 2020). In some of these studies, these traits were more related to muscle and fat (carcass conformation) and were separated from those related to body height, while in others, these traits were combined in the first PCA. According to Salako (2006b), the separation of traits into the different PCAs might be due to the different association of each trait with bone, maturation rate, or common causative genes. Furthermore, very high correlations between RHEIGHT, WHEIGHT, and BLEN were estimated at all three ages, but lower correlations between the height traits and the width and circumference traits were obtained at eight and 12 months of age than at four months of age. As the width and circumference traits were not associated with body height and body length, selection for an altered body shape to obtain a tall animal with characteristic meat animal traits would theoretically be possible (Yakubu, 2013).
Various stepwise regression analyses were done to determine which traits contributed the most to body weight, body conformation score, and the classification symbols. In the stepwise regression of individual conformation traits on body weight, HGIRTH and BLEN explained the most variance in body weight at all three ages, while BDEPTH8 also explained more than 5% of the variance in body weight at eight months of age. Heart girth was also a major contributor to variance in the multiple regression models predicting body weight in West African Dwarf sheep (Sowande & Sobola, 2008; Birteeb & Ozoje, 2011; Oke & Ogbonnaya, 2011), indigenous sheep in Botswana (Temoso et al., 2017), and Karayaka ewes (Cam et al., 2010). Multiple regression models reported in previous studies and explaining between 95% and 97% of variance in body weight included traits such as HGIRTH, WHEIGHT, BLEN, RHEIGHT, HEADLEN, RWIDTH, and BCS (Sowande & Sobola, 2008; Cam et al., 2010; Birteeb & Ozoje, 2011; Oke & Ogbonnaya, 2011; Temoso et al., 2017). Thus, it was the objectively measured traits that contributed the most to body weight. Similar results have been reported in the literature for various sheep breeds (Sowande & Sobola, 2008; Cam et al., 2010; Yakubu, 2010; Birteeb & Ozoje, 2012; Dekhili & Aggoun, 2013; Tyasi et al., 2015; Ambarcioğlu et al., 2017; Temoso et al., 2017; Tesfay et al., 2017). Body weight was the only trait explaining more than 5% of the variance in the classification symbol awarded according to the general merit index, which in turn is also based on objective performance data.
It is evident that there was much variation between the judges in the traits contributing the most to the body conformation score. At four months of age, the only trait of importance common to all three judges was HGIRTH4. At eight months of age, HEAD8, SWIDTH8, and BCS8 were the traits all judges placed the most emphasis on when awarding eight-month body conformation scores. At 12 months of age, BLEN12 was the most important trait for all three judges when assessing body conformation scores. It is therefore clear that, apart for BLEN at four and 12 months of age and HEAD at eight and 12 months of age, there was no consistency in the traits that were considered when awarding the body conformation scores. Thus, a combination of traits indicating general body size, as well as the subjective trait HEAD, was emphasised when assessing body conformation over the trial period.
There was also variation between the judges in the traits contributing to the classification symbol awarded at 12 months of age. Traits contributing significantly to the awarding of the classification symbols at 12 months were HEAD12, BLEN12, HGIRTH12, and FPAST12. This indicates that different judges awarded different symbols to the same animal, which could severely impact selection progress, as widely divergent sires were eligible for selection. The results for the final classification symbol awarded at 14 months of age indicated that body conformation score, HEAD12, and wool score explained the most variance, with body conformation and wool scores contributing 65% of the variance. These results further emphasise that the subjective impressions of the judge played the biggest role in the final classification at 14 months of age, as these are all subjectively evaluated traits.
Significant correlations of above 0.50 were estimated between most of the conformation traits. As multicollinearity undermines the statistical significance of an independent variable and has been shown to be associated with unstable estimates of regression coefficients (Malau-Aduli et al., 2004; Okpeku et al., 2011), the use of such interdependent explanatory variables should be treated with caution in multiple regression models. Principal component factor scores are orthogonal to each other and are more reliable in factor weight estimation. This justifies the use of PCA scores for model prediction. Using these factors will also reduce the number of variables in cases where a large number of possible variables are involved. For the models where the PCA scores were included as possible traits, PCA1 explained the most variance in the final models for the predictions of body weights at the various ages. The first PCA also explained the most variance for all judges when the PCA scores were included in the models predicting body conformation scores at four and eight months of age. Heart girth had the highest factor loadings (0.85 and 0.79 respectively) in PCA1 at four and eight months of age. PCA3 explained the most variance in CS-A12 when the PCA scores were included, while PCA1 explained the most variance in CS-B12 and CS-C12. Therefore, the most suitable models for predicting body weight and conformation scores for all the judges at all ages would be the models including the PCAs (PCA-CT4m/8m/12m). Similarly, the model PCA-CT12m+CS+WS+PT could be regarded as the most suitable model for the classification symbol awarded by the judges at 12 months of age, as well as for the final classification symbol. As PCA1 or PCA3 explained the most variance in body conformation scores at all ages and in classification symbols at 12 months of age for all three judges, this should decrease the variation due to the effect of the different emphasis that the three judges placed on the different individual traits.
The results of this study emphasise the fact that there is no clear definition of body conformation, and each judge has their own interpretation of body conformation. The fact that the opinion of the judges, based on a largely undefined trait or concept, plays a major role in the final decision of which animals will be allowed to be retained as breeding stock, is contradictory to the aim of the Dohne Merino Breeders' Society to have a common breeding objective.
Conclusions
The traits that received the most emphasis in assessing body conformation were BLEN, HGIRTH, and HEAD. Body length and HGIRTH, in turn, contributed the most to predicting body weight, thus indirectly placing emphasis on bigger animals. The final classification symbol was awarded based mainly on the subjective traits body conformation score, HEAD12, and wool score. It was also obvious that the three judges emphasised different traits when assessing body conformation and awarding classification symbols. This would lead to different sires being eligible for selection in different studs. As PCA1 explained the most variance in body conformation score for all the judges, including the measurable conformation traits related to body size and skeletal dimensions in the principal component analysis for the prediction of body conformation could alleviate the problem of personal preference of the judges.
If the Dohne Merino Sheep Breeders' Society aims to have common breeding objectives, it is imperative that the subjective trait evaluation aspects should be refined and standardised, as judges currently have a major impact on the final selection of breeding sires.
Acknowledgements
The judges are acknowledged for their contribution to this study through the assessment of the body conformation scores and the awarding of the classification symbols. Mr Marius van Heerden and the GADI and Small Stock Research Trust employees are acknowledged for their contribution to this project through the maintenance of the animals and the collection of the data.
Conflict of interest declaration
The authors have no conflicts of interest to declare.
Author contributions
Conception and design: MAS; data collection: MAS and WJO; data analysis: MAS; drafting of paper: MAS; critical revision and final approval of version to be published: MAS and WJO.
References
Abbasi, M-A. & Ghafouri-Kesbi, F., 2011. Genetic (co)variance components for body weight and body measurements in Makooei sheep. Asian-Australasian Journal of Animal Science, 24(6):739-743. DOI: 10.5713/ajas.2011.10277 [ Links ]
Ambarcioğlu, P., Kaya, U., Özen, D., & Gürcan, I.S., 2017. An examination of the relationships between live weight and body measurements in Karacabey Merino sheep through the path analysis approach. Kafkas Üniversitesi Veteriner Fakültesi Dergisi, 23(6):857-863. DOI: 10.9775/kvfd.2017.17659 [ Links ]
Birteeb, P.T. & Ozoje, M.O., 2012. Prediction of live body weight from linear body measurements of West African Long-Legged and West African Dwarf sheep in Northern Ghana. Online Journal of Animal and Feed Research, 2(5):427-434. [ Links ]
Cam, M.A., Olfaz, M., & Soydan, E., 2010. Body measurements reflect body weights and carcass yields in Karayaka sheep. Asian Journal of Animal and Veterinary Advances, 5(2):120-127. DOI: 10.3923/ajava.2010.120.127 [ Links ]
Dekhili, M. & Aggoun, A., 2013. Path coefficient analysis of body weight and biometric traits in Ouled-Djellal breed (Algeria). Agriculture, 4(2):41-46. http://dspace.univ-setif.dz:8888/jspui/handle/123456789/429 [ Links ]
Jafari, S., Hashemi, A., Darvishzadeh, R., & Manafiazar, G., 2014. Genetic parameters of live body weight, body measurements, greasy fleece weight, and reproduction traits in Makuie sheep breed. Spanish Journal of Agricultural Research, 12(3):653-663. DOI: 10.5424/sjar/2014123-4564 [ Links ]
Janssens, S. & Vandepitte, S.W., 2004. Genetic parameters for body measurements and linear type traits in Belgian Bleu du Maine, Suffolk and Texel sheep. Small Ruminant Research, 54:13-24. DOI: 10.1016/j.smallrumres.2003.10.008 [ Links ]
López-Carlos, M.A., Ramírez, R.G., Aguilera-Soto, J.I., Aréchiga, C.F., & Rodríguez, H., 2010. Size and shape analyses in hair sheep ram lambs and its relationships with growth performance. Livestock Science, 131:203-211. DOI: 10.1016/j.livsci.2010.04.001 [ Links ]
Malau-Aduli, A.E.O., Aziz, M.A., Kojina, T., Niibayashi, T., Oshima, K., & Komatsu, M., 2004. Fixing collinearity instability using principal component and ridge regression analyses in the relationship between body measurements and body weight in Japanese Black cattle. Journal of Animal and Veterinary Advances, 3:856-863. [ Links ]
Matebesi, P.A., Van Wyk, J.B., & Cloete, S.W.P., 2009. Relationships of subjectively assessed wool and conformation traits with objectively measured wool and live weight traits in the Tygerhoek Merino flock. South African Journal of Animal Science, 39(3):188-196. https://hdl.handle.net/10520/EJC94621 [ Links ]
Mavule, B.S., Muchenje, V., Bezuidenhout, C.C., & Kunene, N.W., 2013. Morphological structure of Zulu sheep based on principal component analysis of body measurements. Small Ruminant Research, 111:23-30. DOI: 10.1016/j.smallrumres.2012.09.008 [ Links ]
Moela, A.K., 2014. Assessment of the relationship between body weight and body measurements in indigenous goats using path analysis. Master of Agricultural Management thesis. University of Limpopo, Mankweng, South Africa. [ Links ]
Mortimer, S.I., Atkins, K.D., Semple, S.J., & Fogarty, N.M., 2010. Predicted responses in Merino sheep from selection combining visually assessed and measured traits. Animal Production Science, 50:976-982. DOI: 10.1071/AN10085 [ Links ]
Nsoso, S.J., Young, M.J., & Beatson, P.R., 2002. A review of carcass conformation in sheep: Assessment, genetic control and development. Small Ruminant Research, 35:89-96. DOI: 10.1016/S0921-4488(99)00095-4 [ Links ]
Nunes, S.F., Ferreira, J., Silveira, R.M.F., Sales, D.C., De Sousa, J.E.R., Paiva, S.R., & Façanha, D.A.E., 2020. Morphometric characterization and zoometric indices of white Morada Nova breed: The first step for conservation. Small Ruminant Research, 192:106178. DOI: 10.1016/j.smallrumres.2020.106178 [ Links ]
Oke, U.K & Ogbonnaya, E.O., 2011. Application of physical body traits in the assessment of breed and performance of WAD sheep in a humid tropical environment. Livestock Research for Rural Development, 23(2):Article #24. Retrieved January 9, 2019, from http://www.lrrd.org/lrrd23/2/oke23024.htm [ Links ]
Okpeku, M., Yakubu, A., Peters, S.O., Ozoje, M.O., Ikeobi, C.O.N., Adebambo, O.A., & Imumorin, I.G., 2011. Application of multivariate principal component analysis to morphological characterization of indigenous goats in southern Nigeria. Acta Agriculturae Slovenica, 98(2):101-109. DOI: 10.2478/v10014-011-0026-4 [ Links ]
Salako, A.E., 2006a. Application of morphological indices in the assessment of type and function in sheep. International Jouranal of Morphology, 24(1): 13-18. [ Links ]
Salako, A.E., 2006b. Principal component factor analysis of the morphostructure of immature Uda sheep. International Jouranal of Morphology, 24(4):571-774. [ Links ]
Sowande, O.S. & Sobola, O.S., 2008. Body measurements of West African dwarf sheep as parameters for estimation of live weight. Tropical Animal Health and Production, 40:433-439. DOI: 10.1007/s11250-007-9116-z [ Links ]
SAS Institute Inc., 2016. SAS OnlineDoc® 9.4 Procedures Guide, 6th edition. SAS Institute Inc., Cary, NC, USA. [ Links ]
Snyman, M.A. & Olivier, W.J., 2002. Correlations of subjectively assessed fleece and conformation traits with production and reproduction in Afrino sheep. South African Journal of Animal Science, 32(2):88-96. DOI: 10.4314/sajas.v32i2.3750 [ Links ]
Tatum, J.D., Samber, J.A., Gillmore, B.R., LeValley, S.B., & Williams, F.L., 1998. Relationship of visual assessments of feeder lamb muscularity to differences in carcass yield traits. Journal of Animal Science, 76:774-780. DOI: 10.2527/1998.763774x [ Links ]
Temoso, O., Coleman, M., Baker, D., Morley, P., Baleseng, L., Makgekgenene, A., & Bahta, S., 2017. Using path analysis to predict bodyweight from body measurements of goats and sheep of communal rangelands in Botswana. South African Journal of Animal Science, 47(6):854-863. DOI: 10.4314/sajas.v47i6.13 [ Links ]
Tesfay, H.H., Banerjee, A.K., & Mummed, Y.Y., 2017. Live body weight and linear body measurements of indigenous sheep population in their production system for developing suitable selection criteria in Central Zone of Tigray, Northern Ethiopia. African Journal of Agricultural Research, 12(13):1087-1095. DOI: 10.5897/AJAR2016.11927 [ Links ]
Thompson, J. & Meyer, H., 1994. Body condition scoring of sheep. Extension Service, Oregon State University, Oregon, USA. [ Links ]
Tyasi, T.L., Tyasi, Y.F., Tyasi, A.L., Lagu, S., & Ngambu, S., 2015. A study of relationship between body weight and morphological traits by using path analysis in South African indigenous sheep. Journal of Biology, Agriculture and Healthcare, 5(10):1-5. [ Links ]
Yakubu, A., 2010. Path coefficient and path analysis of body weight and biometric traits in Yankasa lambs. Slovak Journal of Animal Science, 43(1):17-25. [ Links ]
Yakubu, A., 2013. Principal component analysis of the conformation traits of Yankasa sheep. Biotechnology in Animal Husbandry, 29(1):65-74. DOI: 10.2298/BAH1301065Y [ Links ]
Yakubu, A. & Mohammed, G.L., 2012. Application of path analysis methodology in assessing the relationship between body weight and biometric traits of Red Sokoto goats in northern Nigeria. Biotechnology in Animal Husbandry, 28(1):107-117. DOI: 10.2298/BAH1201107Y [ Links ]
Yakubu, A., Salako, A.E., & Abdullah, A-R., 2011. Varimax rotated principal component factor analysis of the zoometrical traits of Uda sheep. Archivos de Zootecnia, 60(231):813-816. [ Links ]
Zishiri, O.T., Cloete, S.W.P., Olivier, J.J., & Dzama, K., 2013. Genetic parameter estimates for subjectively assessed and objectively measured traits in South African Dorper sheep. Small Ruminant Research, 109:84-93. DOI: 10.1016/j.smallrumres.2012.07.014 [ Links ]
Submitted 25 October 2021
Accepted 27 May 2025
Published 17 June 2025
# Corresponding author: GrethaSn@nda.agric.za
