


Services on Demand
Journal

Article
 English (pdf)
 Article in xml format
 Article references
 Send this article by e-mail
Indicators
Related links
-
 Cited by Google
 -
 Similars in Google
Share

 Permalink
South African Journal of Science
On-line version ISSN 1996-7489Print version ISSN 0038-2353
S. Afr. j. sci. vol.122 n.1-2 Pretoria Jan./Feb. 2026
https://doi.org/10.17159/sajs.2026/21915
RESEARCH ARTICLE
Growth and physiological responses of two sugarcane cultivars exposed to elevated surface ozone
Tracey L. LabanI, II; Pieter G. van ZylIII; Shawn C. LiebenbergIV; Johan P BeukesIII; Jacques M. BernerII; PD. Riekert van HeerdenV, VI; Caradee Y WrightI, VII, VIII
IEnvironment and Health Research Unit, South African Medical Research Council, Pretoria, South Africa
IIUnit for Environmental Sciences and Management, North-West University, Potchefstroom, South Africa
IIIAtmospheric Chemistry Research Group, Chemical Resource Beneficiation, North-West University, Potchefstroom, South Africa
IVSchool of Mathematical and Statistical Sciences, North-West University, Potchefstroom, South Africa
VSouth African Sugarcane Research Institute, Durban, South Africa
VIDepartment of Plant and Soil Sciences, University of Pretoria, Pretoria, South Africa
VIIDepartment of Geography, Geoinformatics and Meteorology, University of Pretoria, Pretoria, South Africa
VIIIDepartment of Environmental Health, University of Johannesburg, Johannesburg, South Africa
ABSTRACT
Surface ozone (O3) pollution is known to have a detrimental effect on agriculture whilst rising carbon dioxide (CO2) concentrations are sometimes found to offer plants protection against O3 effects. Considering the important role of sugarcane (Saccharum spp. hybrids) as a major food crop in South Africa and its contribution to the national economy, the tolerance of this crop to O3 damage must be established. A pilot study using open-top chambers was conducted whereby two local commercial sugarcane cultivars (NCo376 and N31) were fumigated during the summer growth season to explore the effects of elevated O3 as well as the interacting effects of O3 and CO2 on various stress and crop quality indicators. Statistical significance of differences in treatment means was analysed by hierarchical linear modelling to account for variability between chamber and pots in explaining changes across individual plants. The results revealed a significant reduction in the number of dead leaves (senescing) for the N31 cultivar exposed to elevated O3 compared with the other treatments. There was also a statistically significant decrease in chlorophyll fluorescence (used to assess photosynthetic performance) in the O3-treated NCo376 plants. This pilot study shows limited effects of O3 fumigation on growth and physiology, with preliminary indications that sugarcane is less sensitive to O3 than other crops. An increase in O3 concentrations associated with future climate change is expected, which will have implications for cultivar selection as a possible adaptation strategy to reduce susceptibility of this crop to O3.
SIGNIFICANCE:
• This article adds to the existing literature on sugarcane and ozone (O3). We present a pilot study for two cultivars of sugarcane and explore interacting effects of O3 and carbon dioxide (CO2) on various stress and crop quality indicators.
• We employed a mixed effects model to account for variability between chamber and pots, a challenge when working with plants.
• This is the first time African sugarcane has been investigated and, although the findings show limited statistical effect of O3 and CO2, future studies can vary the conditions of this experiment to produce more data points for a dose-response function.
Keywords: sugarcane, surface ozone, growth, physiology, South Africa
Introduction
High levels of ozone (O3) air pollution occur in southern Africa, particularly during late winter and spring from August to November where the maximum O3 concentrations can range between 40 and 60 parts per billion (ppb) and have been found to reach more than 90 ppb in mid-spring.1-3 The 'O3 peak season' overlaps with the summer growth season of various agricultural crops that extends from October to April of the following year.4 Elevated concentrations of O3 are recognised as posing a threat to the health of vegetation and agricultural crops.5-7 O3 stress effects include foliar injuries8,9, impairment of physiological functions such as reduced photosynthesis10 and reductions in both growth and yield of crops11-13, although the extent of the effects varies between species and varieties/cultivars6.
The main entry of ozone into the leaves is through the stomata whilst entry through the cuticle constitutes a negligible part of the O3 uptake pathway by plants.14 The effect of O3 may also be influenced by other environmental factors such as soil water content, temperature, solar radiation intensity and vapour pressure deficit, which can cause reductions in stomatal conductance and, subsequently, O3 uptake by plants.15,16 For instance, in low-humidity (high vapour pressure deficit) environments, plants close their stomata to reduce plant transpiration and loss of water, which results in reduced O3 uptake from the air, whereas plants in high-humidity (low vapour pressure deficit) environments open their stomata and unintentionally take up O3.17 Another environmental factor is atmospheric CO2 concentrations, which are steadily rising and are projected to reach between 700 and 800 parts per million (ppm) by the year 2100.18 Both these gases have been shown to affect plant growth and productivity but in opposing ways. Elevated CO2 on its own results in increased growth and yields in most crop species19, whereas elevated O3 alone has demonstrated reduced growth and yield of important crops20,21. However, the combination of elevated CO2 and O3 could offset the harmful effects of O3 damage. Some studies have shown that elevated CO2 affords plants more protection against O3 because of lower stomatal conductance, lower O3 uptake into leaves and increased provision of substrates for detoxification and repair processes.15 However, other studies found that the combined effects of elevated O3 and CO2 on plants provided no ameliorating effects.22
Sugarcane (Saccharum spp. hybrids) is an important agricultural crop in the tropical and subtropical regions of the world, especially for producing sucrose (sugar) and ethanol. In addition to sugar being a raw material for foods, sugarcane mills have learned to harness the energy stored inside the plant to produce high-grade fuels for transport, heat or power applications.23 Due to its importance as a source of food and renewable energy, it is important to know how this crop will respond to O3 pollution. Being a C4 (i.e. produces a four-carbon molecule as the first product of photosynthesis) plant, it is assumed that sugarcane will exhibit tolerance to O3 compared with C3 (i.e. produces a three-carbon molecule as the first product of photosynthesis) crop species that are more O3 sensitive.24 In C3 plants, studies have shown that photosynthesis is affected by a lower carboxylation efficiency induced by O3. This means the enzyme Rubisco, which fixes atmospheric CO2 as part of the Calvin cycle in photosynthesis, is affected. On the other hand, C4 plants have evolved a mechanism to enhance the efficiency of Rubisco by 'concentrating' CO2 around Rubisco so that these plants can function optimally at lower stomatal conductance than C3 plants.25 This also implies that C4 photosynthesis is less responsive to higher CO2 levels than C3 photosynthesis but evidence supporting these assumptions is still being collected. In more recent years, studies have been published on the sensitivity or tolerance of sugarcane to O323,26,27; however, empirical evidence from Africa as a sugarcane growing region is still unavailable28.
We aimed to assess the sensitivity of South African sugarcane cultivars to elevated atmospheric O3 concentrations, as well as the moderating effects of elevated atmospheric CO2 concentrations on plant response to high O3. By investigating the direct effects of O3 and interactive effects between O3 and CO2 on plant growth and photosynthesis in sugarcane plants, we can increase our understanding for crop modelling purposes and compare the findings with existing literature on sugarcane and O3. These findings could inform the importance of breeding selection of commercial cultivars that are tolerant to O3 and assist sugarcane producers adapt to climate change threats and O3 air pollution.
Materials and methods
Site characteristics and plant material
An open-top chamber (OTC) research facility situated at North-West University, Potchefstroom, South Africa (26°40'50"S, 27°05'48"E, altitude 1348 m above sea level) was used to conduct the O3 fumigation trial with two sugarcane cultivars. These OTCs are essentially transparent plastic cylinders having a volume of 5 m3, ventilated by a fan that can enclose plants and allow for concentrations of air pollutants to be controlled whilst maintaining natural climatic conditions close to field conditions.29 Each of the 12 chambers accommodated eight potted plants; therefore, four plants of each cultivar were placed within each chamber, giving a total of 96 plants used in the study.
Two commercial sugarcane cultivars in South Africa, NCo376 and N31, which were obtained from the South African Sugarcane Research Institute (SASRI), were used in the trial. Cultivar N31 has the ability to grow rapidly and produce an extremely high yield after an 18- to 24-month cycle but has a fairly low sucrose content.30 Cultivar NCo376 produces good yields (although not as high as N31) and has a higher sucrose content than N31, but its growth during severe water stress is poorer compared with N31.31 Seedlings of N31 and NCo376 were planted into pots and placed inside the OTCs. Irrigation was carried out every morning and evening to grow the plants under well-watered conditions. Fertiliser solution containing macro- and micronutrients ideal for sugarcane growth was applied to all pots once every 3 weeks and dissolved by irrigation.32 Fumigation of the plants was initiated 5 weeks after planting. The plants were exposed to elevated O3 and elevated CO2 concentrations for 7 months.
Treatments
Four chambers served as the control chambers (no fumigants) and received only charcoal-filtered air (<4 ppb O3 and 400 ppm CO2) by passing ambient air through a Purafil filter, which effectively removes the O3 and other contaminants present in the air stream. The eight remaining OTCs were designated as the treatment chambers. Four were used for CO2 fumigation involving 750 ppm alone ('elevated CO2'), two for fumigation involving 80 ppb O3 alone ('elevated O3') and two for fumigation involving a mixture of 80 ppb O3 and 750 ppm CO2 ('elevated CO2 plus O3'). Fumigation was maintained in the designated chambers during daylight hours (08:00-17:00) for the duration of the growth period of 7 months. The choice of 80 ppb O3 exposure was guided by other exposure-response data available for other South African crops at this level.33,34 The selection of the 750 ppm CO2 level was based on the two upper representative concentration pathways (RCP 6.0 and 8.5) future scenarios used in the Intergovernmental Panel on Climate Change assessment report.18
Growth measurements
The growth measurements, taken twice a month, included the number of green and dead leaves, top visible dewlap (TVD) leaf length and width, stalk height and number of tillers. The TVD leaf blade is the plant tissue often used in sugarcane studies and refers to the uppermost fully expanded leaf with a clearly visible dewlap or collar (as can be seen in McCray et al.35). The number of green and dead leaves was counted, starting from the base of the stalk to the TVD leaf. The stalk height was measured from the soil surface to the TVD leaf. The number of tillers present for each plant was counted, excluding the main tiller (primary shoot or stalk).
Chlorophyll a fluorescence measurements
Chlorophyll (chl) a fluorescence was measured using a Handy Plant Efficiency Analyzer (Hansatech Instrument Ltd, UK) portable fluorimeter and conducted at night to ensure that the sample leaves had already been dark-adapted for at least 1 h. The first step in the measurement process using the fluorimeter was to cover the measurement area of the TVD leaf blade with a small, lightweight leaf clip. A high intensity (3500 μMol/m2/s), short flash (1 s) of light was applied to the measurement area, which transiently closes all PSII reaction centres, reducing the overall photochemical efficiency so that fluorescence levels rise for 1-2 s.36 Following on from this, however, the fluorescence level typically starts to fall again, over a time scale of a few minutes.36 Measurements of chl a fluorescence were taken monthly, starting at 8 weeks after planting with three replicates per plant.
The most commonly used chl fluorescence measuring parameter is F/Fm37, with the dark-adapted value of FJFm signifying the maximum potential quantum efficiency of PSII in plants if all capable reaction centres were open.38
The normalised ratio FJFm is created by dividing variable fluorescence by maximum fluorescence:
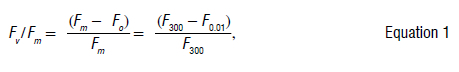
where
F/Fm is the maximum quantum yield of PSII photochemistry measured in the dark-adapted state,
Fo is the initial or minimum fluorescence intensity at 0.01 ms when light is first applied,
Fm is the maximum or peak fluorescence intensity at 300 ms and
Fv is the variable fluorescence, the difference between maximum fluorescence and minimum fluorescence.
The ratio F/Fm measures plant photosynthetic activity, with reduced values possibly indicating stress, photoinhibition and photosynthesis downregulation.38 An F/Fm value in the range of 0.79-0.83 is the approximate optimal value for many plant species, with lowered values indicating plant stress, particularly the occurrence of photoinhibition.38
Stomatal conductance measurements
To assess O3 uptake, stomatal conductance was measured once a month using a handheld porometer (Model AP4, Delta-T Devices, Cambridge, UK). Three measurements were taken per plant along the length of the TVD leaf. The measurements were taken between 12:00 and 14:00.
Chlorophyll content measurements
Chl content (measured in units of mg/m2) was measured once a month, starting at about 17 weeks after planting. Measurements were made using a handheld meter (Model CCM 300, Opti-Sciences, USA) by placing the leaf clip on the TVD leaf. Three measurements were taken per potted plant.
Statistical analyses
All measured data were downloaded using the data logger software of each instrument and saved as a text/csv file on a laptop computer. The data were sorted and processed in Microsoft Excel. All measurement results were subjected to statistical analysis methods to determine the statistical significance of the differences between treatment means. Hierarchical linear mixed models (HLMs) are a class of statistical models that allow for the analysis of nested data. These models are useful when dealing with data where observations are not independent of each other. These models account for variability at different levels, from individual measurements to overall groupings.39,40 In addition to these advantages, HLMs were selected as the estimation of individual change over time can be modelled and fewer assumptions need to hold for the procedure to be valid.41
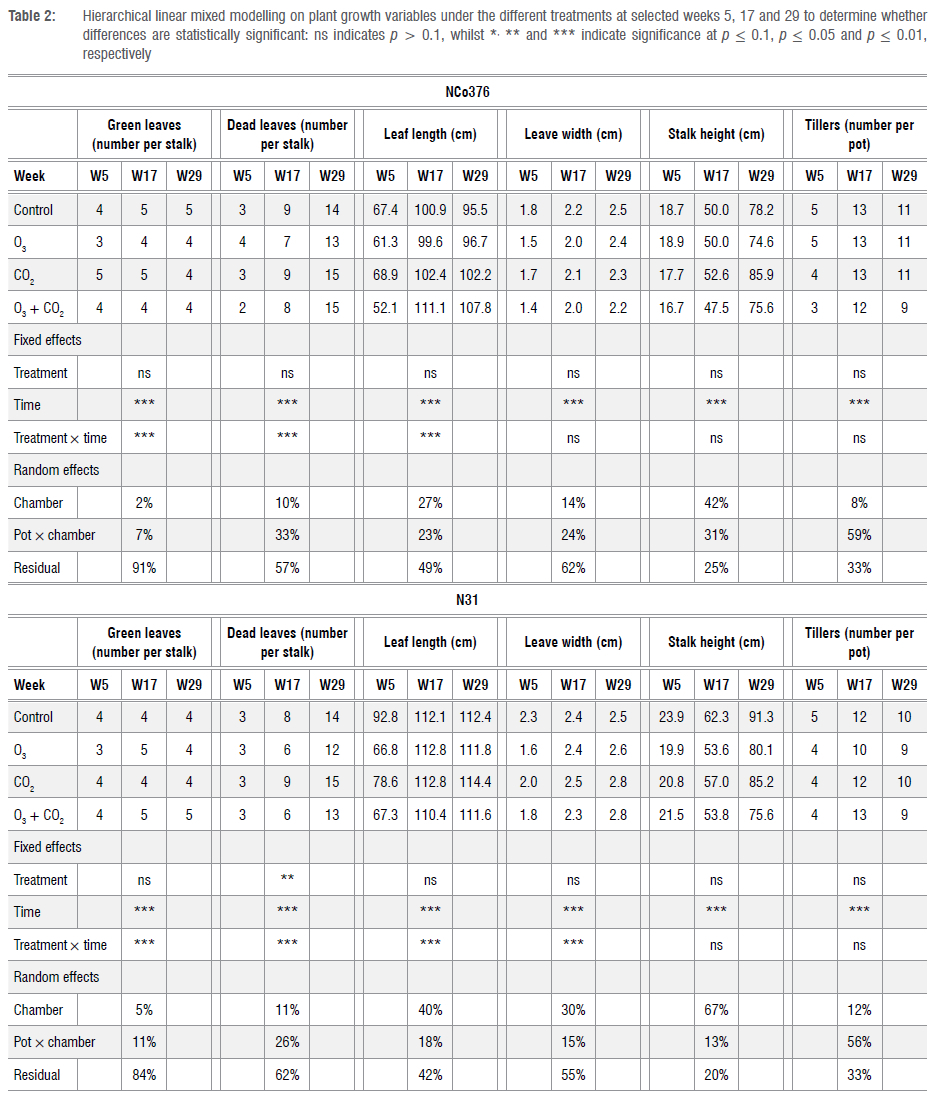
In this study, HLM was conducted to analyse several variables in relation to the fixed effects of treatment and time, as well as their interaction. The growth and physiological variables were separately used as dependent variables in the HLMs. Two random intercepts (random effects) were included in each model, i.e. one at the chamber level and another at the nested pot level. The average of each treatment group for each dependent variable is provided for selected time points. The p-values for the predictors ('treatment' and 'time') are denoted as non-significant when p > 0.1, with increasing numbers of asterisks indicating significance levels at p < 0.1, p < 0.05 and p < 0.01, respectively. These p-values test whether the predictors, 'treatment', 'time' or their interaction (treatment χ time) has a statistically significant effect on the dependent variable. For the random effects, the estimate of the proportion of variance in the outcome variable accounted for at each level of the model is provided. This gives a measure of the importance of each random effect ('chamber' and 'pot') by dividing the effect's variance estimate by the total variance estimate. A larger percentage indicates a more important random effect.
Results
Ambient conditions
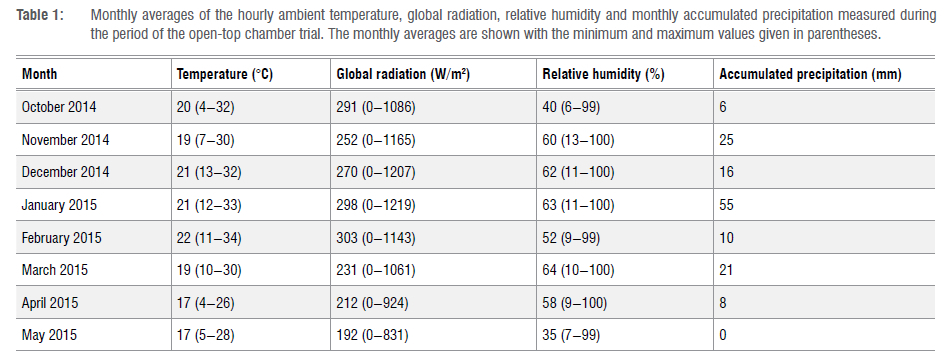
Near-site meteorological data for the period of the trial were obtained from the Welgegund Atmospheric Research Station (http://www.welgegund.org), which is located at 26.57°S and 26.94°E with an elevation of 1480 m above sea level. The highest temperatures and relative humidities occurred during summer (December, January and February), with global radiation being the highest during spring (September, October and November) and summer (Table 1). Rainfall occurred predominantly from November to March. A comparison of ambient temperature and relative humidity levels with measurements taken inside the OTCs indicated that the temperature and relative humidity were higher (by 2-5 °C and 10-20%, respectively) inside the chambers compared with the outside. Additional data obtained from the station were ambient O3 concentrations that were used to calculate AOT40 values (Supplementary figure 1).
Growth parameters
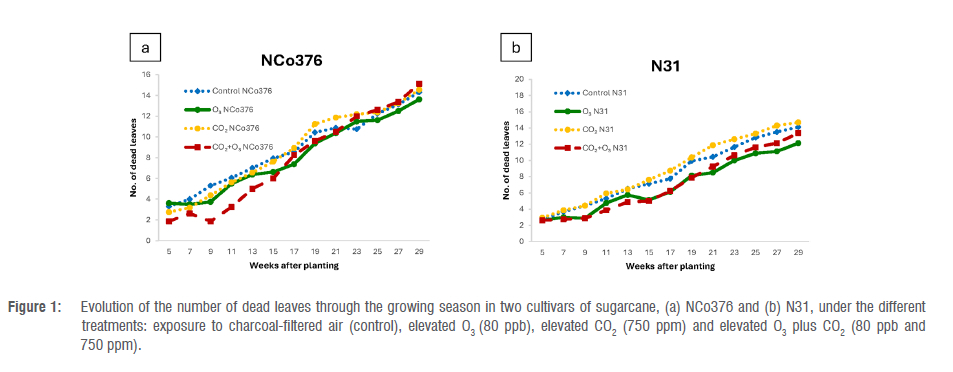
The data for all plant growth parameters measured can be found in the supplementary material (Supplementary figure 2) and are summarised in Table 2. Overall, green leaves, dead leaves, TVD leaf length and stalk height were slightly higher in the elevated CO2 (i.e. elevated CO2 and elevated O3 plus CO2) treatments than in the elevated O3 treatment (Supplementary figure 2 and Table 2). However, the data in Table 2 indicate that whilst the predictor variable 'time' was statistically significant for all models, 'treatment' was only significant in predicting the number of dead leaves on the N31 cultivar. The results for dead leaves presented in Figure 1 show that the number of dead leaves was significantly higher for CO2-treated plants than for the control plants, which can be interpreted as natural ageing (senescence) of leaves. On the other hand, the O3-treated plants have fewer dead leaves than the other treatments. A lower number of dead leaves on the treated plants compared with the control implies that the treatments do not result in earlier ageing of leaves (accelerated leaf senescence). The treatment χtime interaction was significant for green leaves, dead leaves and leaf length for both varieties. It was also observed that the 'chamber' effect accounts for 30% or more of the variation in predicting leaf length, leaf width and stalk height variables for the N31 variety and 42% of the variation in stalk height for the NCo376 variety. The 'pot level' accounts for substantial variation across all growth variables, with 'tillers' accounting for 59% (NCo376) and 56% (N31), respectively. Interestingly, for NCo376 the number of tillers was the highest in the elevated O3 treatment than in the other treatments, whereas the reverse situation applied for N31 over time (Supplementary figure 2), which could relate to the sensitivity of the two sugarcane cultivars to O3. However, the differences were not statistically significant.
Physiological responses
Relative maximal variable fluorescence
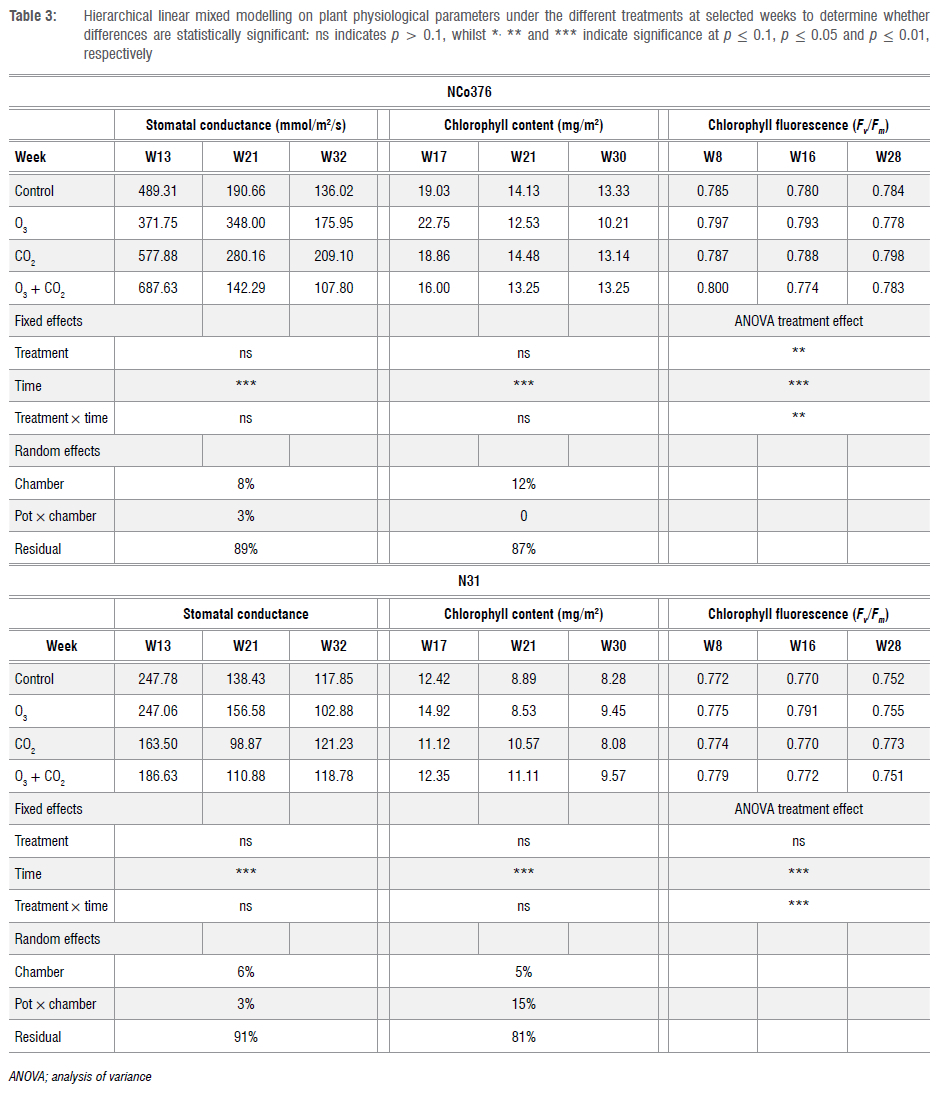
Mixed model analysis to determine statistical significance showed that the chambers did not contribute any variation to the relative maximal variable fluorescence (F/Fm) for NCo376 and N31. Consequently, disregarding the influence of the chambers reduces the statistical analysis to a two-way repeated measures analysis of variance, which was performed to assess whether there is a difference in the treatment effect (Table 3). No significant differences were found between the treatments for N31, but the differences between the treatments for NCo376 were statistically significant. A decrease in F/Fm with elevated O3 over time and increase in F/Fm values with elevated CO2 over time was observed for NCo376. There was a statistically significant effect of the factor 'time' for both NCo376 and N31 and a significant (but lower) treatment χ time interaction, suggesting that 'time' was a better predictor of changes in photosynthetic activity than 'treatment' in this pilot trial (Table 3 and Supplementary figure 3).
Stomatal conductance
The evolution of stomatal conductance of sugarcane through the growing season shows a decreasing trend (Supplementary figure 4), which suggests the stomata become more closed over the life cycle of the plants. In addition, NCo376 was found to have a higher stomatal conductance than N31 at each stage of development. For N31, O3 exposure decreased stomatal conductance to levels lower than the control and CO2 treatment, particularly in the advanced phenological stages (Supplementary figure 4). However, the differences between the treatments were not statistically significant (Table 3). Neither the 'chamber' nor 'pot' levels accounted for any noticeable variation in predicting the stomatal conductance.
Chlorophyll content
It can be observed from the controls that, in general, NCo376 has a higher chl content value than N31 (Supplementary figure 5). Chl content tended to drop significantly in NCo376 close to harvest, although the treatment difference was not statistically significant (Table 3). 'Chamber' effects (e.g. reduced solar radiation, higher temperature or more watering) accounted for 12% of the variation whereas 'pot in chamber' contributed 15% of the variation in predicting the chl content variable, for NCo376 and N31, respectively.
Discussion
HLMs were used in this study to statistically evaluate the influence of various parameters, i.e. pots, chambers, treatments and time effects, and to determine whether there is a statistically significant difference between 'treatment' and 'time', as well as the interaction of 'treatment' over 'time'. The analysis indicates that the factor that most influenced the growth and physiological response of each variety was 'time', whilst 'treatment' was only significant in predicting the dead leaves in the N31 cultivar. The 'chamber' effect influenced the variation in leaf length, leaf width and stalk height in the N31 variety, whilst affecting stalk height in the NCo376 variety. The 'pot' level also explains some amount of variation in the growth variables, particularly in 'tillers' for both cultivars. However, neither the 'chamber' nor 'pot' level contributed significantly to variations in stomatal conductance and chl content. As given by the residuals in the statistical analysis (statistical variation that could not be accounted for), over 80% of the variation was unexplained in the stomatal conductance and chl content data. For chl a fluorescence, the 'treatment' effect was significant for NCo376, with increased O3 exposure decreasing the F/Fm vratio whilst elevated CO2 increased F/Fm. A reduction in the F/Fm values indicate damage to the PSII II photosynthetic machinery.
The mixed model in terms of stalk height and tillers fits very well (about 70-80% of the variation in stalk height and tillers are explained by 'chamber' and 'pot' within the chambers). These variables could potentially be used as predictors in mixed models and are important factors related to sugarcane yield. For the sugarcane industry, a 15% reduction in stalk height could translate to a significant amount in terms of yield and profitability loss of the crop. In terms of tillers, multiple studies have shown that elevated CO2 levels stimulates tillering in crops42-44, which, in turn, provides the crop with a suitable number of stalks and forms the foundation of a good crop.45 The specific time at which the tillers are produced is also of importance as observed in rice plants with more tillers at the early stage usually indicating they are on a healthy developmental path towards higher yield.42
Although the HLM approach has benefits, there are also some disadvantages especially when dealing with small sample sizes. With a limited number of chambers, a choice must be made either to reproduce conditions in multiple chambers or produce more data points by varying conditions in each chamber. In this case, reproducing the conditions in multiple chambers resulted in too few data points to produce a dose-response function. If non-linear responses are expected gradient experimental designs are especially important to consider.46 Another limitation to this study is that biomass yield and cane quality measurements of the O3-treated sugarcane cultivars were not undertaken at the end of season although various articles highlight crop yield and quality affected by O3 exposure. Yield loss due to surface O3 is a major concern for developing countries such as South Africa and holds direct relevance for future local sugarcane production.
We piloted an in-field measurement approach on local sugarcane cultivars and, based on what we learned, can make recommendations to optimise the research protocol in a larger study as follows: (1) reduce the number of pots in each chamber to ensure they all receive solar radiation; (2) increase the number of chambers per treatment to make the results more robust; (3) improve the irrigation system to remove water stress as a factor and (4) measure additional yield and quality (e.g. sugar content) variables to assess productivity.
Conclusions
In this pilot trial, we set out to investigate whether O3 air pollution has adverse effects on selected growth and physiological parameters in sugarcane. At the same time, the direct benefits of elevated CO2 concentration was investigated to determine whether elevated CO2 levels could offset the deleterious effects of O3 damage. Preliminary indications are that the two cultivars of sugarcane are less sensitive to O3 than other crops such as rice, wheat and potato. When the data were analysed statistically, O3 had limited effects on growth and physiology parameters in sugarcane, although a significant decrease in dead leaves and a small decrease in chl fluorescence were detected in both cultivars. Elevated CO2 concentrations did not significantly ameliorate the negative effects of O3 for sugarcane. Notwithstanding, with the threat of other aspects of climate change such as multi-year droughts in semi-arid regions such as South Africa, future studies should evaluate the effect of elevated O3 on sugarcane in different water regimes. In addition, future investigations should focus on obtaining more data points for producing O3 dose-response functions and critical levels for sugarcane that can be used as a policy tool to improve air quality and vegetation health in the region. The relevance of this study can also be further enhanced by combining the interaction between current O3 levels and other climate stressors, notably drought, in the derivation of sugarcane O3 dose-response functions. This can guide the development of agricultural practice and cultivar selection to reduce the production risk posed by rising O3 pollution and climate change.
A novel contribution in this paper was the motivation for mixed models to be used in dose-response chamber studies as a reliable statistical tool. The traditional repeated-measures analysis of variance does not take into account the effect of the chambers, so this piece of information in the data is lost. HLM is recommended as a more suitable method to analyse repeated-measures data as it accounts for variability between chamber and pots, a challenge when working with plants. This study used HLM analysis to account for variance introduced by these unobserved random effects, in addition to the fixed effects of treatment, time and interaction between treatment and time.
Acknowledgements
The financial assistance of the South African National Research Foundation towards this research is acknowledged. Opinions expressed and conclusions arrived at are those of the authors and are not necessarily to be attributed to the National Research Foundation. We are grateful to SASRI for supplying the plant materials. We thank Prabhu Inbaraj, Charné Malan, Monja Gerber and Mmbulaheni Netshimbupfe for assistance with field work and data processing. This publication forms part of the output of the Biogeochemistry Research Infrastructure Platform (BIOGRIP) of the Department of Science, Technology and Innovation of South Africa, which supports the Welgegund station.
Funding
This work is based on the research supported in part by the National Research Foundation of South Africa (grant numbers 97006 and 111287).
Data availability
The data supporting the results of this study are available upon request to the corresponding author.
Declarations
We have no competing interests to declare. We have no AI or LLM use to declare. This paper was part of the doctoral thesis of T.L.L (https://repository.nwu.ac.za/items/a430bd9b-ef76-4370-a2d3-18f52b26836d) but has since been significantly revised for publication in this journal.
Authors' contributions
T.L.L.: Conceptualisation, methodology, investigation, formal analysis, validation, visualisation, data curation, writing - original draft, writing -review and editing. PG.v.Z.: Supervision, writing - review and editing. S.C.L.: Formal analysis, writing - review and editing. J.PB.: Supervision, writing -review and editing. J.M.B.: Conceptualisation, methodology, writing - review and editing. PD.R.v.H.: Conceptualisation, methodology, writing - review and editing. C.YW.: Writing - review and editing. All authors read and approved the final manuscript.
References
1. Laban TL, Van Zyl PG, Beukes JP Vakkari V Jaars K, Borduas-Dedekind N, et al. Seasonal influences on surface ozone variability in continental South Africa and implications for air quality. Atmos Chem Phys. 2018;18(20):15491-15514. https://doi.org/10.5194/acp-18-15491-2018 [ Links ]
2. Laakso L, Beukes JP, Van Zyl PG, Pienaar JJ, Josipovic M, Venter AD, et al. Chapter 20 - Ozone concentrations and their potential impacts on vegetation in southern Africa. In: Matyssek R, Clarke N, Cudlin P Mikkelsen TN, Tuovinen J-P Wieser G, et al. editors. Developments in environmental science 13. Amsterdam: Elsevier; 2013. p. 429-150. https://doi.org/10.1016/B978-0-08-098349-3.00020-7 [ Links ]
3. Zunckel M, Venjonoka K, Pienaar JJ, Brunke EG, Pretorius O, Koosialee A, et al. Surface ozone over southern Africa: Synthesis of monitoring results during the cross border air pollution impact assessment project. Atmos Environ. 2004;38(36):6139-6147. https://doi.org/10.1016/j.atmosenv.2004.07.029 [ Links ]
4. Wessels KJ, Prince S, Malherbe J, Small J, Frost P Van Zyl D. Can human-induced land degradation be distinguished from the effects of rainfall variability? A case study in South Africa. J Arid Environ. 2007;68(2):271-297. https://doi.org/10.1016/j.jaridenv.2006.05.015 [ Links ]
5. Fuhrer J. Ozone risk for crops and pastures in present and future climates. Sci Nat. 2009;96(2):173-194. https://doi.org/10.1007/s00114-008-0468-7 [ Links ]
6. Feng Z, Kobayashi K. Assessing the impacts of current and future concentrations of surface ozone on crop yield with meta-analysis. Atmos Environ. 2009;43(8):1510-1519. https://doi.org/10.1016/j.atmosenv.2008.11.033 [ Links ]
7. Ainsworth EA. Understanding and improving global crop response to ozone pollution. Plant J. 2017;90(5):886-897. https://doi.org/10.1111/tpj.13298 [ Links ]
8. De Temmerman L, Karlsson GP Donnelly A, Ojanperä K, Jäger H-J, Finnan J, et al. Factors influencing visible ozone injury on potato including the interaction with carbon dioxide. Eur J Agron. 2002;17(4):291-302. https://doi.org/10.1016/S1161-0301(02)00067-9 [ Links ]
9. Benton J, Fuhrer J, Gimeno B, Skärby L, Palmer-Brown D, Ball G, et al. An international cooperative programme indicates the widespread occurrence of ozone injury on crops. Agric Ecosyst Environ. 2000;78(1):19-30. https://doi.org/10.1016/S0167-8809(99)00107-3 [ Links ]
10. Karnosky DF, Skelly JM, Percy KE, Chappelka AH. Perspectives regarding 50 years of research on effects of tropospheric ozone air pollution on US forests. Environ Pollut. 2007;147(3):489-506. https://doi.org/10.1016/j.envpol.2006.08.043 [ Links ]
11. Biswas D, Xu H, Li Y Sun J, Wang X, Han X, et al. Genotypic differences in leaf biochemical, physiological and growth responses to ozone in 20 winter wheat cultivars released over the past 60 years. Glob Change Biol. 2008;14(1):46-59. https://doi.org/10.1111/j.1365-2486.2007.01477.x [ Links ]
12. Piikki K, Vorne V Ojanperä K, Pleijel H. Potato tuber sugars, starch and organic acids in relation to ozone exposure. Potato Res. 2003;46(1-2):67-79. https://doi.org/10.1007/BF02736104 [ Links ]
13. Fuhrer J, Skärby L, Ashmore MR. Critical levels for ozone effects on vegetation in Europe. Environ Pollut. 1997;97(1-2):91-106. https://doi.org/10.1016/S0269-7491(97)00067-5 [ Links ]
14. Castagna A, Ranieri A. Detoxification and repair process of ozone injury: From O3 uptake to gene expression adjustment. Environ Pollut. 2009;157(5):1461-1469. https://doi.org/10.1016/j.envpol.2008.09.029 [ Links ]
15. Fiscus EL, Booker FL, Burkey KO. Crop responses to ozone: Uptake, modes of action, carbon assimilation and partitioning. Plant Cell Environ. 2005;28(8):997-1011. https://doi.org/10.1111/j.1365-3040.2005.01349.x [ Links ]
16. Pochanart P Akimoto H, Kinjo Y Tanimoto H. Surface ozone at four remote island sites and the preliminary assessment of the exceedances of its critical level in Japan. Atmos Environ. 2002;36(26):4235-4250. https://doi.org/10.1016/S1352-2310(02)00339-4 [ Links ]
17. Kavassalis SC, Murphy JG. Understanding ozone-meteorology correlations: A role for dry deposition. Geophys Res Lett. 2017;44(6):2922-2931. https://doi.org/10.1002/2016GL071791 [ Links ]
18. Intergovernmental Panel on Climate Change (IPCC). Climate change 2021: The physical science basis: Contribution of Working Group I to the Sixth Assessment Report of the Intergovernmental Panel on Climate Change. Cambridge and New York: Cambridge University Press; 2021. https://doi.org/10.1017/9781009157896 [ Links ]
19. Erda L, Wei X, Hui J, Yinlong X, Yue L, Liping B, et al. Climate change impacts on crop yield and quality with CO2 fertilization in China. Philos Trans R Soc B Biol Sci. 2005;360(1463):2149-2154. https://doi.org/10.1098/rstb.2005.1743 [ Links ]
20. Feng Z, Kobayashi K, Ainsworth EA. Impact of elevated ozone concentration on growth, physiology, and yield of wheat (Triticum aestivum L.): A meta-analysis. Glob Change Biol. 2008;14(11):2696-2708. https://doi.org/10.1111/j.1365-2486.2008.01673.x [ Links ]
21. Craigon J, Fangmeier A, Jones M, Donnelly A, Bindi M, De Temmerman L, et al. Growth and marketable-yield responses of potato to increased CO2 and ozone. Eur J Agron. 2002;17(4):273-289. https://doi.org/10.1016/S1161-0301(02)00066-7 [ Links ]
22. Rebbeck J, Scherzer A. Growth responses of yellow-poplar (Liriodendron tulipifera L.) exposed to 5 years of O3 alone or combined with elevated CO2. Plant Cell Environ. 2002;25(11):1527-1537. https://doi.org/10.1046/j.1365-3040.2002.00933.x [ Links ]
23. Cheesman AW, Brown F, Farha MN, Rosan TM, Folberth GA, Hayes F, et al. Impacts of ground-level ozone on sugarcane production. Sci Total Environ. 2023;904, Art. #166817. https://doi.org/10.1016/j.scitotenv.2023.166817 [ Links ]
24. Grantz D, Vu HB. O3 sensitivity in a potential C4 bioenergy crop: Sugarcane in California. Crop Sci. 2009;49(2):643-650. https://doi.org/10.2135/cropsci2008.04.0210 [ Links ]
25. Lara MV Andreo CS. C4 plants adaptation to high levels of CO2 and to drought environments. In: Shanker A, Venkateswarlu B, editors. Abiotic stress in plants - mechanisms and adaptations. London: InTechOpen; 2011. p. 415-428. https://doi.org/10.5772/24936 [ Links ]
26. Moura BB, Hoshika Y Silveira NM, Marcos FC, Machado EC, Paoletti E, et al. Physiological and biochemical responses of two sugarcane genotypes growing under free-air ozone exposure. Environ Exp Bot. 2018;153:72-79. https://doi.org/10.1016/j.envexpbot.2018.05.004 [ Links ]
27. Moura BB, Hoshika Y Ribeiro RV Paoletti E. Exposure-and flux-based assessment of ozone risk to sugarcane plants. Atmos Environ. 2018;176:252-260. https://doi.org/10.1016/j.atmosenv.2017.12.039 [ Links ]
28. The Royal Society. Ground-level ozone in the 21st century: Future trends, impacts and policy implications. London: The Royal Society; 2008. [ Links ]
29. Heyneke E, Smit P Van Rensburg L, Kruger G. Open-top chambers to study air pollution impacts in South Africa. Part I: Microclimate in open-top chambers. S Afr J Plant Soil. 2012;29(1):1-7. https://doi.org/10.1080/02571862.2012.688372 [ Links ]
30. South African Sugar Research Institute. Information sheet: Variety N31 [document on the Internet]. c2006 [cited 2025 Oct 08]. Available from: https://sasri.org.za/wp-content/uploads/Information_Sheets/IS_13.18-Variety-N31.pdf [ Links ]
31. South African Sugar Research Institute. Information sheet: Variety NCo376 [document on the Internet]. c2006 [cited 2025 Oct 08]. Available from: https://sasri.org.za/wp-content/uploads/Information_Sheets/IS_13.1-Variety-NCo376.pdf [ Links ]
32. Malan C. Influence of elevated CO2 on the growth, yield and photosynthesis of sugarcane [MSc dissertation]. Potchefstroom: North-West University; 2017. [ Links ]
33. Berner J, Maliba B, Inbaraj P. Impact of elevated levels of CO2 and O3 on the yield and photosynthetic capabilities of Brassica napus. Procedia Environ Sci. 2015;29:255. https://doi.org/10.1016/j.proenv.2015.07.191 [ Links ]
34. Scheepers CCW. Physiological and biochemical constraints on photosynthesis of leguminous plants induced by elevated ozone in open-top chambers [MSc dissertation]. Potchefstroom: North-West University; 2011. [ Links ]
35. McCray JM, Rice RW, Ezenwa IV. Sugarcane leaf tissue sample preparation for diagnostic analysis [document on the Internet]. c2005 [cited 2025 Oct 08]. Available from: https://edis.ifas.ufl.edu/publication/SC076 [ Links ]
36. Maxwell K, Johnson GN. Chlorophyll fluorescence - a practical guide. J Exp Bot. 2000;51(345):659-668. https://doi.org/10.1093/jexbot/51.345.659 [ Links ]
37. Murchie EH, Lawson T. Chlorophyll fluorescence analysis: A guide to good practice and understanding some new applications. J Exp Bot. 2013; 64(13):3983-3998. https://doi.org/10.1093/jxb/ert208 [ Links ]
38. Bartold M, Kluczek M. Estimating of chlorophyll fluorescence parameter Fv/Fm for plant stress detection at peatlands under Ramsar Convention with Sentinel-2 satellite imagery. Ecol Inform. 2024;81, Art. #102603. https://doi.org/10.1016/j.ecoinf.2024.102603 [ Links ]
39. Reckhow K, Qian S, Harmel R. A multilevel model of the impact of farm-level best management practices on phosphorus runoff 1. J Am Water Resour Assoc. 2009;45(2):369-377. https://doi.org/10.1111/j.1752-1688.2008.00298.x [ Links ]
40. Gili AA, Noellemeyer EJ, Balzarini M. Hierarchical linear mixed models in multistage sampling soil studies. Environ Ecol Stat. 2013;20:237-252. https://doi.org/10.1007/s10651-012-0217-0 [ Links ]
41. Lininger M, Spybrook J, Cheatham CC. Hierarchical linear model: Thinking outside the traditional repeated-measures analysis-of-variance box. J Athl Train. 2015;50(4):438-441. https://doi.org/10.4085/1062-6050-49.5.09 [ Links ]
42. Zhou J, Gao Y, Wang J, Liu C, Wang Z, Lv M, et al. Elevated atmospheric CO2 concentration triggers redistribution of nitrogen to promote tillering in rice. Plant-Environ Interact. 2021;2(3):125-136. https://doi.org/10.1002/pei3.10046 [ Links ]
43. McMaster G, LeCain D, Morgan J, Aiguo L, Hendrix D. Elevated CO2 increases wheat CER, leaf and tiller development, and shoot and root growth. J Agron Crop Sci. 1999;183(2):119-128. https://doi.org/10.1046/j.1439-037x.1999.00325.x [ Links ]
44. Mulholland B, Craigon J, Black C, Colls J, Atherton J, Landon G. Effects of elevated carbon dioxide and ozone on the growth and yield of spring wheat (Triticum aestivum L.. J Exp Bot. 1997;48(1):113-122. https://doi.org/10.1093/jxb/48.1.113 [ Links ]
45. Bonnett GD. Chapter 3 - Developmental stages (phenology). In: Moore PH, Botha FC, editors. Sugarcane: Physiology, biochemistry, and functional biology. Ames, IA: John Wiley & Sons, Inc; 2013. p. 35-53. https://doi.org/10.1002/9781118771280.ch3 [ Links ]
46. Kreyling J, Schweiger AH, Bahn M, Ineson P, Migliavacca M, Morel-Journel T, et al. To replicate, or not to replicate - that is the question: How to tackle nonlinear responses in ecological experiments. Ecol Lett. 2018;21(11):1629-1638. https://doi.org/10.1111/ele.13134 [ Links ]
 Correspondence:
Pieter van Zyl
Email: pieter.vanzyl@nwu.ac.za
Received: 10 Apr. 2025
Revised: 23 Sep. 2025
Accepted: 26 Sep. 2025
Published: 29 Jan. 2026
Editor: Teresa Coutinho
Funding: South African National Research Foundation (97006, 111287)
Supplementary Data
The supplementary data is available in pdf: [Supplementary data]
