



Services on Demand
Journal

Article
 English (pdf)
 Article in xml format
 Article references
 Automatic translation
 Send this article by e-mail
Indicators
Related links
-
 Cited by Google
 -
 Similars in Google
Share

 Permalink
South African Journal of Science
On-line version ISSN 1996-7489Print version ISSN 0038-2353
S. Afr. j. sci. vol.121 n.11-12 Pretoria Nov./Dec. 2025
https://doi.org/10.17159/sajs.2025/20710
RESEARCH ARTICLE
Spatio-temporal behaviour of the brown hyena (Parahyaena brunnea) in the Fish River Canyon, Namibia
Veronica RamelloI; Ibra E. MontiI; Davide SoglianiI, III; Len le RouxIV; Valentina IsajaV; Uakendisa MuzumaVI, VII; Donato A. GrassoVIII; Maila CiceroI, IX; Marta BormioliX; Marcello FranchiniI, XI, *; Claudio AugugliaroX, XII, *
IDepartment of Research and Conservation, Wildlife Initiative, Verona, Italy
IIDepartment of Veterinary Medicine, University of Sassari, Sassari, Italy
IIIDepartment of Biology and Biotechnology, University of Pavia, Pavia, Italy
IVCanyon Nature Trust, Windhoek, Namibia
VZoom Foundation, Turin, Italy
VIDirectorate of Scientific Services, Ministry of Environment, Forestry and Tourism, Windhoek, Namibia
VIISchool of Animal, Plant and Environmental Sciences, University of the Witwatersrand, Johannesburg, South Africa
VIIIDepartment of Chemistry, Life Sciences and Environmental Sustainability, University of Parma, Parma, Italy
IXDepartment of Biological, Geological and Environmental Sciences, University of Bologna, Bologna, Italy
XNakupenda Wildlife, Windhoek, Namibia
XIDepartment of Agrifood, Environmental and Animal Sciences, University of Udine, Udine, Italy
XIIWildlife Initiative, Ulaanbaatar, Mongolia
ABSTRACT
The brown hyena (Parahyaena brunnea) is inherently challenging to study owing to its secretive nature and nocturnal activity. Available literature predominantly examines the dietary overlap with co-occurring predators, emphasising the species' ecological role as a scavenger, whilst research focused on the species' spatio-temporal behaviour remains limited. To address this gap, we used camera-trap data from a survey conducted in southern Namibia to investigate the effects of different biotic and abiotic factors on the species' occupancy and detection probability, as well as the activity rhythm and temporal overlap between P. brunnea and other co-occurring species, including humans. Brown hyena's occupancy and detection probability were mainly shaped by environmental factors. The species showed a preference for the upper plateau and was more easily detected in secondary canyons leading to the uplands. Human activity did not influence occupancy, although we detected a clear temporal partitioning. Brown hyenas were most active during the central hours of the night, with a single broad activity peak suggesting increased foraging effort, independent of leopard activity patterns. This study represents the first fine-scale investigation of brown hyenas' spatio-temporal behaviour within the Fish River Canyon. Our findings effectively reduce the knowledge gap on brown hyenas' spatial niche and activity within arid inland ecosystems of southern Namibia, characterised by the absence of larger predators, such as lions (Panthera leo) and spotted hyenas (Crocuta crocuta), and scarcely affected by human disturbance.
SIGNIFICANCE:
As a near-threatened and understudied species, the brown hyena represents an ideal candidate for investigating the spatio-temporal activity of a large carnivorous species in a complex arid ecosystem. Findings from this study fill the knowledge gap on the species ecology in inland desert ecosystems with unstable food availability and highlight the importance of accounting for different abiotic and biotic factors when investigating highly adaptable elusive species. Moreover, we advise that conservation and management programmes account for both sympatric predator and prey species when planning conservation strategies, considering that the ecological role of brown hyenas may vary.
Keywords: brown hyena, occupancy probability, activity, camera trapping, carnivore
Introduction
In southern Africa, biodiversity is declining proportionally to human expansion.1 Historically, carnivore decline has been particularly pronounced in the region, with species from the Hyaenidae family experiencing the most significant losses.2 Currently, these species face various threats, with habitat loss and human-wildlife conflict amongst the main factors threatening population survival.3
Among the Hyaenidae family, the brown hyena (Parahyaena brunnea) is globally classified as Near Threatened by the International Union for Conservation of Nature (lUCN).4 Its estimated population ranges between 4365 and 10 111 mature individuals, and the overall population trend is considered stable. Over the last century, the species has significantly reduced its historical geographical range.5 Currently, P brunnea is extant in Angola, Botswana, Namibia, South Africa and Zimbabwe4, with Namibia alone hosting nearly one-third of the species' global population3. Although the local population trend is deemed stable, the species faces various increasing anthropogenic threats across the country.3,5
Brown hyenas are inherently challenging to study owing to their secretive nature and nocturnal activity6, which often results in the species being overlooked in wildlife research. Compared to other co-occurring large carnivores such as leopards (Panthera pardus) and spotted hyenas (Crocuta crocuta), brown hyenas have been scarcely studied7, despite growing pressure to prioritise conservation efforts towards the species3,4.
Several contemporary studies on brown hyena focus on the dietary overlap between the scavenger and co-occurring predators.8-10 Research focused on spatio-temporal activity, specifically occupancy analysis, is still widely overlooked, with inconsistent results about the effect of biotic and abiotic factors shaping the species' habitat requirements.11,12 Several studies have reported a positive relationship between the presence of brown hyenas and other sympatric large carnivores8-10,13, as expected by the hyena's trophic role as a scavenger seeking feeding opportunities in leftover carcasses and its tendency to kleptoparasitise kills6. Although there is some evidence to sustain these conclusions, it is essential to underline that (1) these studies6,8-11,13,14 have been conducted in different ecological contexts with different carnivore guild compositions, and (2) the brown hyena's spatial ecology is, to the best of our knowledge, still largely understudied.
In Namibia, most studies on brown hyenas have been performed along the coast and in northern and central continental regions.14-16 Considering the ecological plasticity of brown hyenas6,17, gathering data along its geographical range to understand their adaptability to various ecological contexts is of paramount importance.
In this study, we explored the spatio-temporal activity of the brown hyena through a camera-trapping survey conducted in the Fish River Canyon, Namibia. This area, although within the distribution range of the species4, has not been recorded as part of the range in the most recent distribution assessment3. The species persists in neighbouring properties; however, the general area marks the limit of the recorded national distribution range of the brown hyena.3 In this context, understanding the species spatio-temporal behaviour is crucial for obtaining insights into its habitat requirements and interspecific interactions. This knowledge will aid in detailing accurate conservation strategies, ultimately facilitating a future dispersion to the east.
Specifically, we aimed to (1) determine the influence of environmental, biological and anthropogenic factors on brown hyena's occupancy and detection probability, (2) investigate the activity rhythms and temporal overlap between brown hyena and leopard, selected potential prey species (i.e. springbok (Antidorcas marsupialis) and Leporidae (i.e. Lepus capensis and Pronolagus sp.))8,14,18, and humans.
We predicted that the brown hyena's occupancy probability would be positively affected by the leopard's relative abundance, reflecting the positive interaction between these two species.11 Accordingly, we anticipated significant overlap in the activity patterns of the two predators as brown hyenas actively seek scavenging opportunities from leopards.8 We also expected that the relative abundance of prey species would positively affect brown hyena's occupancy probability, as they might seek feeding opportunities through scavenging and kleptoparasitism.6,8,10 We predicted low temporal overlap between predators and prey, reflecting a common anti-predatory strategy.19 As for anthropogenic disturbance, we predicted a negative impact on brown hyena's occupancy probability along with a low temporal overlap with humans on foot and vehicles, given the elusive nature of the species and the already known negative effects induced by human presence.11,20 Furthermore, we included key habitat and topographical indexes in the analysis to account for the environmental complexity of the study area (i.e. the clear ecological and geographical gradient between upland and lowland areas). As the effect of environmental variables on brown hyena's occupancy probability greatly depends on habitat types12, we predicted an uncertain directional effect of Topographic Position Index (TPI), Topographic Ruggedness Index (TRI) and elevation. Finally, for Topographic Wetness Index (TWI), we anticipated a positive effect, as brown hyenas use drainage lines for movements across areas.21
Materials and methods
Study area
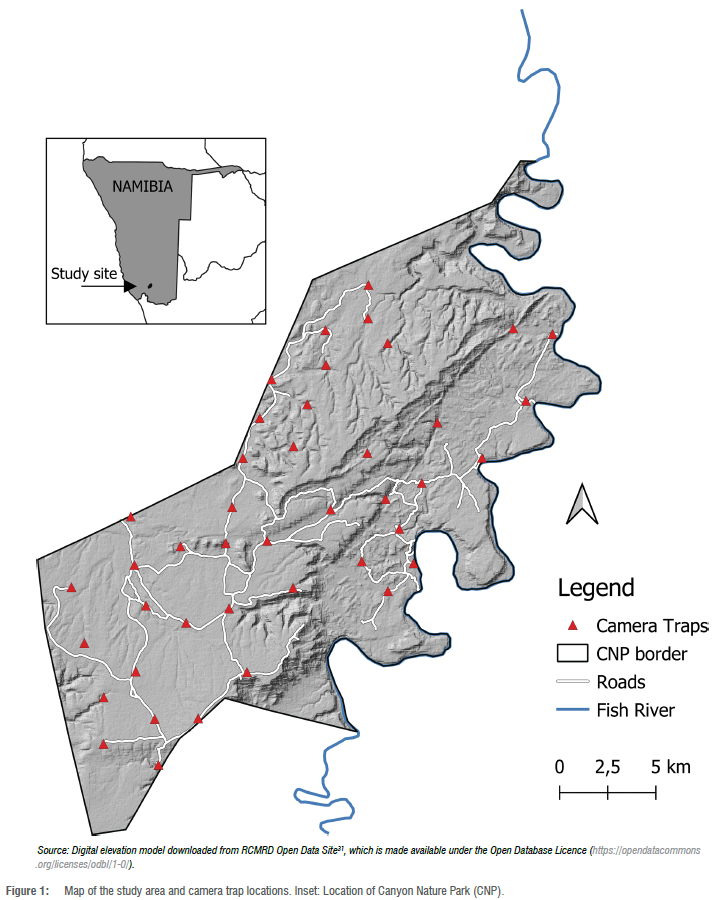
The study was carried out in the Canyon Nature Park (-17°35'E; 27°26'N, datum WGS84; hereafter CNP), a privately owned protected land located within the Greater Fish River Canyon landscapein southwest Namibia (Figure 1). The property covers an area of approximately 450 km2, neighbouring the /Ai-/Ais Richtersveld Transfrontier Park along its southwestern and southeastern boundaries, and five privately owned farms. From its foundation in 1995, CNP has been dedicated to sustainable tourism, wildlife conservation and research practices. Human activities are restricted to a few ecotourism vehicles, trekking parties and field researchers. The property can be divided into two topographically distinct areas (i.e. the upper plateau and the main canyon) separated by an elevation gradient ranging from 400 m to 500 m. The area encompasses several mountain ridges, rocky outcrops, plains, riverbeds and drainage lines. The mean annual rainfall varies in the range 0-100 mm, with average annual temperatures ranging from 16 °C to 20 °C.22 The flora of the region is dominated by formations of dwarf shrubs interspersed with woody vegetation along riverbeds and kloofs, reflecting the typical landscape of the Nama Karoo biome, which covers the northern areas of the Greater Fish River Canyon landscape.22
Because of the previous extensive small-stock farming and hunting practices, the mammalian diversity, especially the carnivore guild, has been severely altered during the last century with the eradication of larger predators such as lions (Panthera leo) and spotted hyenas, and the indirect killing of scavenging species through poison and non-selective traps.23 However, a consistent recovery of mammals has been taking place since multiple protected areas were established, forming the Greater Fish River Canyon landscape. To date, the carnivore guild within CNP consists of leopards, cheetahs (Acinonyx jubatus), brown hyenas, aardwolves (Proteles cristata), black-backed jackals (Lupulella mesomelas), African wild cats (Felis lybica), caracals (Caracal caracal), honey badgers (Mellivora capensis), small-spotted genets (Genetta genetta), Cape foxes (Vulpes chama), striped polecats (Ictonyx striatus), and Cape grey mongooses (Herpestes pulverulentus).
Data collection
From May to October 2023, 42 camera traps were placed in the field: 36 Wosports Mini Trail and 6 Bolyguard SG520. Camera traps were located at a minimum distance of 2 km from each other to guarantee the independence of each site while taking into account the home range size of the target species.24 The total sampling area covered about 302 km2, calculated through the minimum convex polygon.
Owing to the expected low density of the target species, detection probability was maximised by preferentially placing cameras along game paths, forced passages, marking spots, roads, riverbeds, natural springs and artificial waterholes.24 To include the topographical variability of the study area in the sampling design, cameras were evenly distributed between the plateau and the canyon areas. Cameras were placed at 30-40 cm above ground and at a 2-4 m distance from the target spot, and secured with straps on rocks or trees, following the protocol for medium-to large-sized mammals.24 All cameras were set to operate 24 h per day, recording a sequence of three pictures with a 5-min interval between bursts. Camera sites were checked every 26-30 days to download data, check functionality, and replace the rechargeable batteries.
Data analysis
All the analyses were performed in the software R (v. 4.3.2).25 Filtering of photos and species identification were performed manually. To reduce pseudoreplication bias, all observations of the same species at the same site, which were spaced less than 15 min between each other, were collapsed into one single event, defined as 'independent detection'.24 All images were filtered to obtain an all-species data set of independent detection events using the 'camtrapR' package in R.26
The naïve occupancy and the Relative Abundance Index (RAI)27 were calculated for all species across sites, and site-by-site for biological and anthropogenic covariates. The naïve occupancy was calculated as the number of detection/total number of camera sites, while the RAI was calculated as follows:

where i represents the ith species, sampling effort is the total number of camera-trap days at each camera site, n detection is the sum of the independent events for the target species at the corresponding site, and 100 camera trap nights is a unit of standardisation for data comparison.
A binary matrix of detection/non-detection events (i.e. 0 = non-detection, 1 = detection) was created for the brown hyena for each camera site and day (i.e. 24-h camera activity). Thereafter, the data set was discretised by grouping the camera days into sampling occasions of five consecutive days each.19 To assess the species occupancy and detection probability, we ran single-season single-species occupancy models28 implemented in the 'unmarked' R package29. Because many mammalian species exhibit seasonal patterns in their behaviour in relation to changing environmental/ecological conditions and because data were collected during one season (i.e. the dry season), the closure assumption of occupancy models was not violated. Therefore, findings were interpreted in terms of probability of occupancy.28 To account for the unbalanced sampling effort among cameras, the variable 'sampling effort' was included in the occupancy models as a survey covariate to explore its effect on the detection probability. As the number of brown hyena's detections was limited, and to avoid overfitting, we restricted the number of site covariates for each occupancy model.
Three key categories of site covariates were selected for the analysis: environmental/topographical, biological and anthropogenic. To encourage the maximum likelihood estimate of parameters, all covariates were standardised at z-scores using the mutate_at function in the 'dplyr' package.30
Environmental covariates were extracted using the QGIS (v.3.28.0) open access software and SAGA GIS (v.7.8.2). Covariates were extracted starting from the Namibia digital elevation model31 Shuttle Radar Topographic Mission, at 30 m spatial resolution, using the geoprocessing tools found in the SAGA NextGen Processing provider (9.1.0).
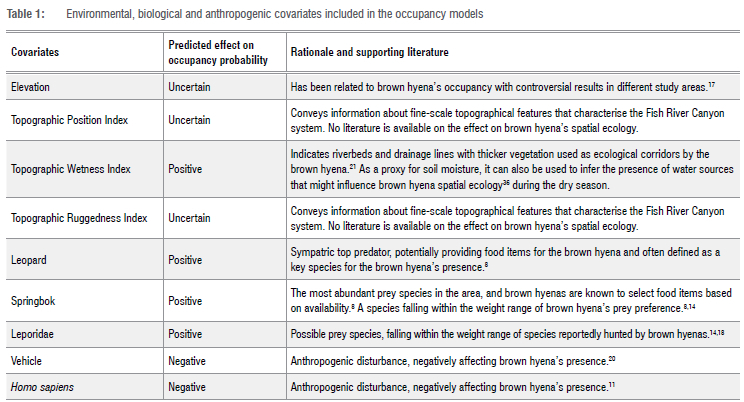
Covariate selection was made based on the information reported in the available literature6,11,17,20,32 and the ecological needs of the target species. Four suitable environmental covariates were selected to test the occupancy probability: (1) elevation, (2) TPI, calculated as the difference in elevation between a central pixel and the mean of its surrounding cells33, (3) TRI, which conveys the amount of elevation difference between neighbouring cells of a digital elevation model, a proxy for topographic heterogeneity34, and (4) TWI, which conveys the relative wetness or moisture conditions of a landscape based on its topography35.
Biological and anthropogenic covariates were calculated as RAIs at each camera site. The leopard was included as a sympatric top predator. Cheetahs were excluded from the analysis as the number of detections was too low to be included as a covariate (Supplementary table 1). Springbok were selected among other larger herbivores as they were the most abundant prey species (supplementary table 1). Leporidae was selected to include prey species that fall within the weight range of reportedly hunted species.14,18 Anthropogenic disturbance was divided into 'humans' (i.e. people on foot such as trekkers, maintenance workers, staff, researchers) and 'vehicles' (i.e. staff and maintenance cars, game drives) to account for the species sensitivity towards different human activities.11,20 Predicted effects of covariates on brown hyena's occupancy probability are summarised in Table 1.
Multicollinearity among covariates was tested through the Variance Inflation Factor (VIF), implemented in the 'usdm' R package37, with a VIF>3 considered to indicate severe collinearity38. The null model was created by keeping both detection probability (p) and occupancy probability (Ψ or psi) constant, to explore the contribution of each covariate in the overall model performance. The most parametrised single-season single-species occupancy models for both occupancy and detection were created by maintaining Ψ and p constant, respectively (Supplementary table 2). Covariates were divided into key categories and tested separately for Ψ and p to avoid model overfitting. Consequently, detection and occupancy models were tested for environmental, biological and anthropogenic covariates.
All complex models were tested for goodness-of-fit using the parboot function implemented in the 'unmarked' R package29 based on the chi-square statistic, to reproduce the parametric bootstrap method for fitted models set at 1000 replicates. These models were then simplified following the principle of parsimony by removing non-significant covariates at each step.
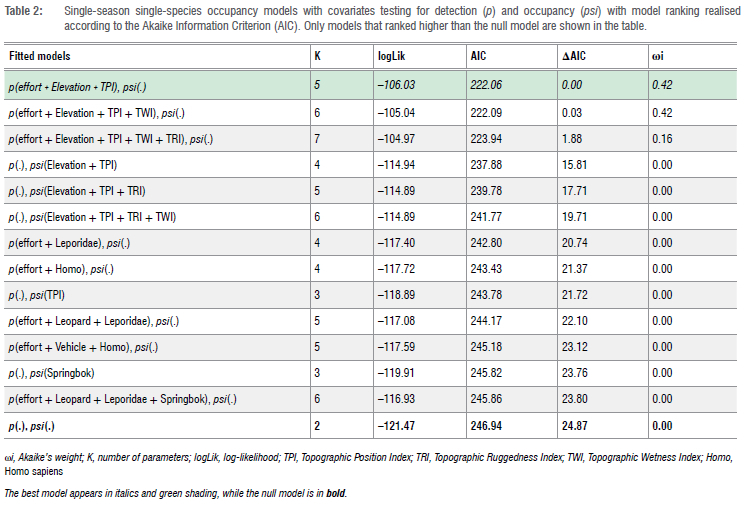
Model selection was based on the Akaike Information Criterion (AIC)39 and ΔAIC40 using the model.sel function implemented in the 'MuMln' R package41. For both detection and occupancy, models were ranked according to their AIC value against the null model. Models with ΔAIC<2 were considered as competitors for the best model.42 Best model selection was then performed based on the Akaike's weight (ωi), which represents the amount of variance described by the top-ranking model compared to all other models.40 Finally, covariate weights were calculated by summing Akaike weights across all models in which a covariate appeared, following Burnham and Anderson40.
We analysed the temporal activity patterns and overlaps for each pair of target species only when more than 20 independent observations per species were collected.43 Temporal activity patterns were analysed using the R package 'overlap'.44 Then, the Hermans-Rasson uniformity test (r) was calculated using the function HR_test in the package 'CircMLE'45 to estimate whether a random activity pattern was exhibited by each species46. Through the R package 'overlap'44, we also estimated the coefficient of overlap (Δ), measured non-parametrically using kernel density estimates, to quantify the temporal overlap between two distinct activity patterns47. The overlap coefficient is defined as the area under the two kernel density curves, and it can range from 0 (i.e. 0% overlap) to 1 (i.e. 100% overlap). We used the 'Δ1' coefficient for pairwise comparisons between species when fewer than 75 observations were available for one of the two species. Conversely, we used the 'Δ4' estimator when both species had more than
75 records.43,47 Temporal overlaps were considered as 'very low' with Δ<0.35, 'low' if 0.35<Δ<0.50, 'moderate' if 0.50<Δ<0.75, 'high' if 0.75<Δ<0.90, and 'very high' if Δ>0.90.48 The overlap coefficients' 95% confidence intervals (hereafter, 95% CIs) were estimated through bootstrap resampling (10 000 replicates). The Mardia-Watson-Wheeler test (W) was applied using the R package 'circular'49 to assess whether statistically significant differences among the activity rhythms of the two species were present. Additional bootstrap analysis was implemented to estimate "the probability that two sets of circular observations come from the same distribution" using the function compareCkern in the R package 'activity'.50 Considering each camera-trap day, using the function getMoonlllumination of the R package 'suncalc'51, a chi-square goodness-of-fit test was used to detect if records of each species were evenly distributed throughout the moon phases46. Lunar phases were classified following Raimondi et al.48 Lastly, sunrise and sunset values for our camera trap survey period were calculated using the function getSunlightTimes of the package 'suncalc'51, with latitude, longitude and date as input parameters. Sunrise, sunset, night end and night start values were then used to classify the species as cathemeral, diurnal, crepuscular or nocturnal, depending on the proportion of observations recorded during daytime, nighttime and twilight periods, using the 'Diel.Niche' R package under the general hypothesis set proposed by Gerber et al.52
Results
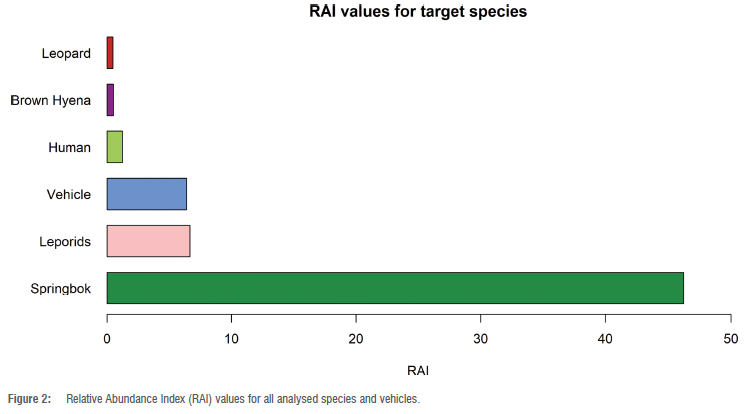
The total sampling period included 134 days, corresponding to the dry season of southern Namibia. The realised sampling effort was 5422 camera-trap days (mean±SE=129.1 ±1.79) out of a potential effort (i.e. accounting for days cameras were inactive in the field) of 5556 days. The number of 5-day sampling occasions obtained was 27. Brown hyenas were recorded at 14 of the 42 stations (naïve occupancy = 0.33). Among the target species, springbok were the most detected, followed by leporids, humans, brown hyenas and leopards (Figure 2). A breakdown of all RAI and naïve occupancy values for all detected species is reported in Supplementary table 1.
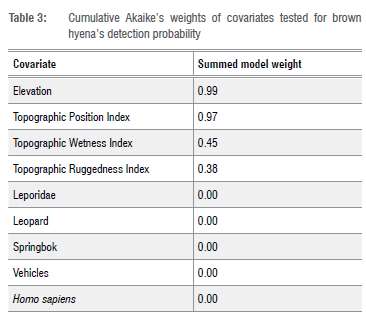
None of the variables showed collinearity issues (i.e. none yielded a VIF>3), thus all of them were included in the analysis. The total number of fitted models was 50 (Supplementary table 3). The number of models fitted for selection following the principle of parsimony was 18. The best overall model obtained retained only environmental covariates with effects on detection probability, and no effect on occupancy probability. Elevation exerted a significant and positive effect on detection probability (β=1.15±0.29 SE,z=4.01, p<0.001). The TPI significantly and negatively affected (β=-0.7±0.16 SE, z=- 4.31, p<0.001) the detection probability, while the sampling effort showed a negative effect (β=-0.02±0.01 SE, z=-2.69, p<0.01) (Table 2). The cumulative weight for covariate testing for occupancy probability showed values <0.01 for all factors. The cumulative weights for covariates in detection probability are shown in Table 3.
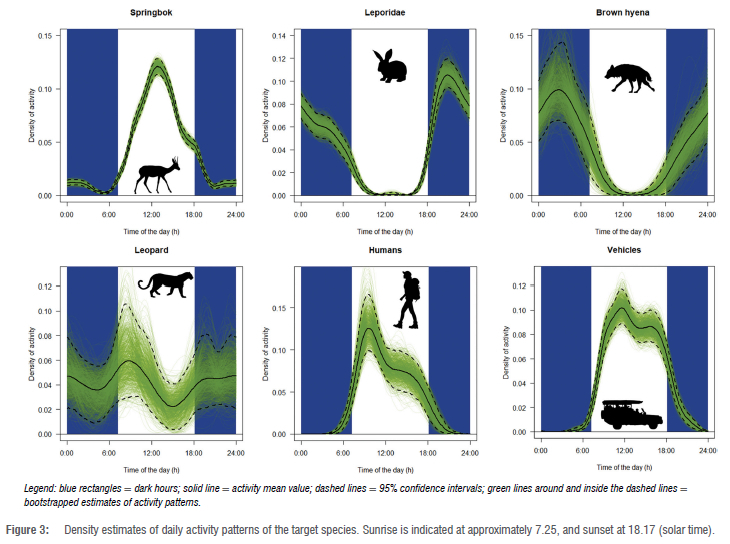
The temporal activity analysis revealed that both the brown hyena (64.5% and 22.6% of nocturnal and diurnal detections, respectively) and the leopard (31% and 55.2% of nocturnal and diurnal detections, respectively) were cathemeral. Among the potential prey, the springbok was diurnal (90.3% of diurnal detections), the Cape hare was cathemeral (53.9% and 22% of nocturnal and twilight detections, respectively), while Pronolagus sp. were crepuscular-nocturnal (74.4% and 18.6% of nocturnal and twilight detections, respectively). Overall, the leporids' temporal pattern was classified as cathemeral. Human activity was classified as diurnal (100% of diurnal detections), and vehicles were also detected mostly during the day (98.1% of diurnal records). Results of the temporal activity analysis are shown in Figure 3.
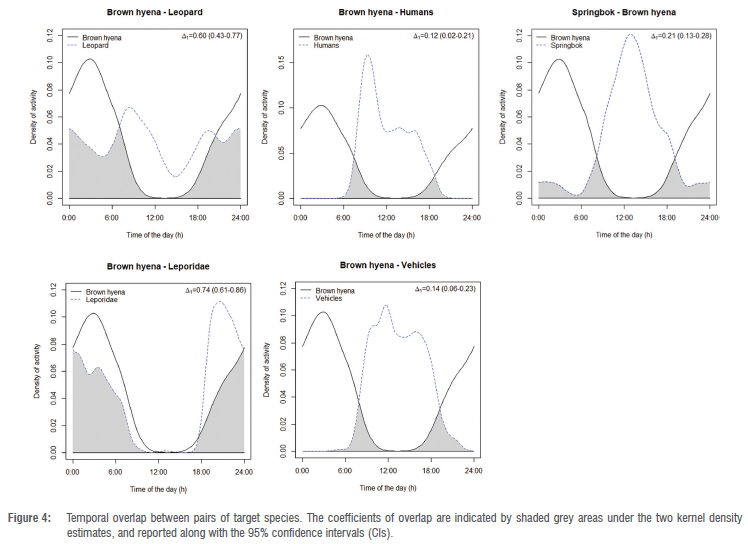
Considering the temporal overlaps in the studied season (i.e. dry season) (Figure 4), we found a 'moderate' temporal overlap between brown hyenas and leopards (Δ1=0.60; 95% CI=0.43-0.77), a 'very low' temporal overlap between brown hyenas and springbok (Δ1 =0.21; 95% CI=0.13-0.28), a 'moderate' temporal overlap between brown hyenas and leporids (Δ1=0.74; 95% CI=0.61-0.86), a 'very low' temporal overlap between brown hyenas and humans (Δ1 =0.12; 95% CI=0.02-0.21), and a 'very low' overlap between brown hyenas and vehicles (Δ1=0.14; 95% CI=0.06-0.23).
Discussion
This contribution effectively enhances knowledge of the brown hyena's spatial niche and activity within the arid ecosystems of southern Namibia, characterised by the absence of larger predators such as lions and spotted hyenas, and scarcely affected by human disturbance. Our study analysed the factors influencing P. brunnea spatial and temporal ecology, providing insight into the species' habitat use and activity rhythm in the diverse system of the Fish River Canyon.
Brown hyenas were detected at approximately one-third of the camera sites, comparable to the leopard's naïve occupancy, yielding low RAI values for both carnivores. The low RAI values observed for these two species in the study area confirm the expected low densities of top predators in arid environments.3,6 However, abundance indices derived from camera trapping should be cautiously used as a proxy for density estimates of secretive species such as large carnivores.27
Results showed that only environmental factors had a significant effect on the species' spatial ecology. Specifically, only the detection probability was influenced by topographic covariates, while models with variables on occupancy ranked lower in model selection and had negligible cumulative weights. Therefore, the results are inconclusive as to which covariates best explain occupancy probability for the species in the area. However, models with environmental covariates outperformed all models with biological and anthropogenic factors on both occupancy and detection probability.
Thus, our results indicate that environmental variables may be the main drivers of the brown hyena's spatial ecology within the study area. The positive effect of elevation on detection probability suggests that the distinct topographical separation between the upper plateau and the lower canyon may drive the species to prefer higher elevations, restricting its movements in the main canyon. Our findings contrast with those obtained by Thorn et al.32 and Williams20, who found no evidence of elevation exerting any influence on the brown hyena's spatial ecology. Conversely, studies conducted by Welch et al.12,17 revealed variable effects, suggesting that the species' spatial ecology is likely and mostly driven by individual preferences rather than environmental factors. Furthermore, the negative effect observed for TPI on brown hyena's detection probability suggests that species roam more frequently in valleys or canyon bottoms. Similarly, Beier53 identified canyon bottoms as common travel routes for cougars in southern California and as possible corridors for population dispersal. Within CNP deep secondary canyons are prominent features along the margins of the plateau, and the brown hyena may use them as pathways to facilitate movements to and from the plateau, serving as preferred routes to foraging areas. Indeed, the cameras with the highest detection rate were located inside secondary canyons or in proximity to ones connecting the lowland to the upland. Brown hyenas appear to use the upper plateau for movement across areas and potentially as selected foraging grounds, thus showing a preference for higher elevations. The flat upland areas host the highest densities of ungulate species within CNP, but provide less cover for hunting for ambush predators such as the leopard, whilst possibly facilitating cursorial hunters such as brown hyenas.14 Another aspect to consider is water availability. Although the species is considered water independent, when available, brown hyenas are known to drink daily.14 During the dry season this resource can be found only at artificial waterholes on the plateau, and in sparse natural springs within the canyon system which are difficult to map. TWI did not influence either occupancy or detection probability; however, future studies could consider an alternative measure to account for water availability and its influence on brown hyena spatial behaviour.
The absence of models with environmental covariates on occupancy probability within the candidate set for best model highlights the limitations of this study in terms of number of detections, calling for caution in interpretation of the results. Nonetheless, the lack of effects on occupancy aligns with findings from previous studies underlining the species' adaptability to colonise a wide spectrum of topographically different habitats.8,12,17
As for biological covariates, we found no effect on either occupancy or detection probability. This indicates that the presence and abundance of co-occurring predator and prey species have no influence on brown hyena's occupancy, reflecting the species' generalist behaviour and scavenging diet.6,10,14,17 Nevertheless, brown hyenas showed a very low temporal overlap with springbok, suggesting a fine-scale temporal avoidance behaviour adopted by prey to reduce the likelihood of predator encounters.
Leporidae, on the other hand, retained a moderate temporal overlap with the scavenger. This could indicate that brown hyena's spatio-temporal behaviour is not influenced by hares, in accordance with its scavenging diet.6,10,14 We encourage further research to include spatio-temporal analysis of other co-occurring predators and prey across seasons, to provide further insight.
Previous studies have described human presence as one of the strongest drivers negatively affecting the brown hyena's spatial ecology.11,20 Our results indicate no human influence over the brown hyena's occupancy and detection probability. This result may be explained by the fact that, within the CNP, human presence is reduced to a few ecotourism vehicles and trekking parties stretched over a vast area. Tourism activities are concentrated during daytime while negative interactions, which would imply spatial segregation, such as hunting and poaching, are banned in the reserve. Consequently, territory overlap is accommodated through temporal avoidance, as the animals may adjust their activity patterns to reduce the likelihood of direct encounters with humans.54 Indeed, we observed a clear temporal avoidance (i.e. very low temporal overlap) between brown hyenas and human/vehicle activity rhythms. To the best of our knowledge, no previous studies have examined the temporal relationship between brown hyenas and humans, so caution is warranted when interpreting this result, as other biological factors might be involved in shaping the species' temporal behaviour.
Our results indicate that brown hyenas are more active during dark hours, confirming previous studies that define the species as nocturnal.6 However, the proportion of daylight activity classifies the species as cathemeral, reflecting a moderate use of light hours. This could be explained by the low daily temperatures during the dry season, which facilitate movement and foraging later in the morning and early in the evening.14 The clear single peak of activity during dark hours differs from previous studies reporting two distinct activity peaks for the species, one early at night and another early in the morning.14,55 The single broad peak we observed suggests that brown hyenas use dark hours more homogeneously, potentially indicating, as earlier suggested, temporal avoidance of humans and/or increasing foraging effort throughout the night. When brown and spotted hyenas co-occur, their activity patterns are known to strongly overlap, which, as reported in other studies55,56, suggests the existence of potential opportunistic behaviours (i.e. scavenging on carcasses). Seemingly with lions, spotted hyenas actively seek them out to access larger food items.6,13 As these larger predators are absent within CNP, brown hyenas can only kleptoparasitise leopards or cheetahs. However, the likely low density of these two species, based on the RAI values, would rarely create scavenging opportunities for the brown hyena, thus forcing the species to find less readily available food sources. This consideration is supported by comparing the activity rhythms of brown hyena and leopard, revealing that the scavenger's activity pattern peaks before the leopard's peak. Contrarily, other research19 has shown that scavenging species show activity peaks immediately after apex predators' activity, likely to maximise the chances of finding fresh carcasses. Further studies found that the brown hyena's activity rhythm could markedly change depending on both the area and mammal community. Edwards et al.36 found that, in southwest Namibia, the temporal activities of the brown hyena and the leopard were significantly different. Conversely, other studies have shown a high degree of temporal overlap between the two predators due to the brown hyena's kleptoparasitism of leopard kills.56,57
In arid environments such as CNP, resource scarcity may intensify competition within the carnivore guild, prompting avoidance behaviours that facilitate coexistence.58 This view is reinforced by the moderate temporal overlap observed between leopard and brown hyena, which contrasts with findings from other studies showing how scavenger activity patterns strongly overlap with those of larger predators.19,56,57 Combining the results obtained from the two analyses, we suggest that the brown hyena exhibits partial independence from the leopard, and a tendency to engage in different foraging strategies. Brown hyenas are known to display predatory behaviour along the Namibian coast15 and are reported to hunt significantly more when carrion is scarce14. Additionally, subordinate carnivore species are known to occupy the apex-predator niche when larger predators are absent.9,59 Our findings confirm the ecological plasticity of the brown hyena, which adapts its spatio-temporal behaviour to the local ecological conditions. Through a study conducted on the spotted hyena, Périquet et al.60 suggested that the structure and intensity of intraguild competition can alter foraging strategies, switching from scavenging to hunting. Consequently, the brown hyena may shift from scavenging to hunting and/or scavenging from animals that die from non-predatory factors to adapt to the low availability of carcasses left by other predators. It is important to note, however, that there were no direct observations of brown hyena hunting behaviour within the study area. Thus, future studies should consider investigating this aspect further.
This study represents the first fine-scale investigation of brown hyenas' spatio-temporal behaviour within the Fish River Canyon system. We have shown that, in areas with low densities of predators and an absence of larger carnivores, the brown hyena's spatial behaviour is mainly influenced by environmental factors. Nevertheless, careful thought should be given when interpreting these results, as it is important to consider variations in elevation between areas, along with other topographic factors. Additionally, as this study was conducted across the dry season, which covers the coldest months of the year, we advise caution when interpreting these results, as we could not test the effect of seasonal variables. Data collection across multiple seasons is needed to better define the habitat requirements of the brown hyena within the Fish River system, accounting for the effect of seasonality on the species' population dynamics and environmental cycles.
We suggest that brown hyenas shape their behaviour through the influence of abiotic and biotic factors within CNP, although these effects are dimmed by its ecological plasticity, which ultimately enables the species to inhabit different environments. We encourage conservation and management efforts to account for this ecological plasticity, addressing prey availability as well as competition with other carnivores. This is particularly important in light of the proposed reintroduction of larger predators in the Fish River system23, which could alter intraguild dynamics and potentially reshape ecosystem functioning.
Lastly, our findings indicate that the sustainable tourism model implemented within CNP has no significant impact on the brown hyena's spatial ecology. We suggest that, as CNP is situated between conservation areas and freehold farmlands, it holds the potential to serve as a safe buffer zone for the species, transitioning from human-dominated landscapes to protected areas. The case of CNP demonstrates that converting farmlands to a privately protected area designated for sustainable tourism may provide significant benefits for wildlife and promote coexistence with humans in Namibia.
Acknowledgements
This work would not have been possible without all the students, guides and researchers from Wildlife Initiative who participated in the project. We acknowledge the project co-leadership of Canyon Nature Trust, thanking them for the support received during the project setup and their participation in all activities. We thank the managers and employees of the Fish River Lodge, in particular Richard and Zanelle, who supported the logistics in CNP during the study period. We recognise the role of Journeys Namibia in providing logistical support. We also acknowledge Zoom Foundation and Wildlife Protection Solution for donating camera traps and equipment. Finally, we thank Dr Nicole Anderson for her valuable comments on our final draft.
Funding
This project was conducted as part of the 'Ecology and Conservation of Large Carnivores in Namibia: from Woodland to Desert' project by Wildlife Initiative NGO. Primary funding was provided by Wildlife Initiative International, Journeys Namibia and Canyon Nature Trust (Namibia). Equipment was partially donated by Wildlife Protection Solutions (USA) and Zoom Foundation (Italy).
Data availability
The data supporting the results of this study are available upon request to the corresponding author.
Declarations
We have no competing interests to declare. We have no AI or LLM use to declare. The single-season single-species occupancy models in this paper are based on the master's thesis of V.R., entitled 'Habitat use of brown hyena (Parahyaena brunnea, Thunberg 1820) in the Fish River Canyon, Namibia', with slightly different covariates and methods, which have since been updated for this paper. The thesis was completed in April 2024 at the University of Parma, Italy; it is not publicly available but is archived in the internal system of the University of Parma.
Authors' contributions
V.R.: Conceptualisation, methodology, investigation, formal analysis, data curation, writing - original draft. I.E.M.: Investigation, project administration. D.S.: Formal analysis, writing - review and editing. L.l.R.: Project leadership, project administration, funding acquisition, visualisation. V.I.: Funding acquisition, visualisation, validation. U.M.: Validation, visualisation. D.A.G.: Conceptualisation, writing - review and editing. M.C.: Project administration, funding acquisition, visualisation. M.B.: Funding acquisition, visualisation, validation. M.F.: Conceptualisation, methodology, formal analysis, validation, writing - review and editing, supervision. C.A.: Conceptualisation, methodology, formal analysis, validation, writing -review and editing, supervision, project leadership, project administration, funding acquisition. All authors read and approved the final manuscript.
References
1. Ceballos G, Ehrlich PR. Mammal population losses and the extinction crisis. Science. 2002;296(5569):904-907. https://doi.org/10.1126/science.1069349 [ Links ]
2. Ray JC, Hunter L, Zigouris J. Setting conservation and research priorities for larger African carnivores. WCS Working Paper No. 24. New York: Wildlife Conservation Society; 2005. [ Links ]
3. Pallett J, Thomson G, Jarvis A. Conservation status and red list of the terrestrial carnivores of Namibia. Windhoek: Ministry of Environment, Forestry and Tourism; Large Carnivore Management Association of Namibia; Namibian Chamber of Environment; 2022. [ Links ]
4. Wiesel I. Parahyaenabrunnea. In: The IUCN Red List of Threatened Species. Gland: The International Union for Conservation of Nature; 2015. p. e.T10276A82344448. https://doi.org/10.2305/IUCN.UK.2015-4.RLTS.T10276A82344448.en [ Links ]
5. Skinner JD, Chimimba CT. The mammals of the southern African sub-region. 3rd ed. Cambridge, MA: Cambridge University Press; 2005. https://doi.org/10.1017/CBO9781107340992 [ Links ]
6. Mills MGL. Kalahari hyenas: Comparative behavioural ecology of two species. Berlin: Springer; 1990. [ Links ]
7. Dheer A, Samarasinghe D, Dloniak SM, Braczkowski A. Using camera traps to study hyenas: Challenges, opportunities, and outlook. Mamm Biol. 2022;102(3):847-854. https://doi.org/10.1007/s42991-021-00188-1 [ Links ]
8. Williams KS, Williams ST, Fitzgerald LE, Sheppard EC, Hill RA. Brown hyaena and leopard diets on private land in the Soutpansberg Mountains, South Africa. Afr J Ecol. 2018;56(4):1021-1027. https://doi.org/10.1111/aje.12539 [ Links ]
9. Yarnell RW, Phipps WL, Burgess LP, Ellis JA, Harrison SW, Dell S, et al. The influence of large predators on the feeding ecology of two African mesocarnivores: The black-backed jackal and the brown hyaena. S Afr J Wildl Res. 2013;43(2):155-166. https://doi.org/10.3957/056.043.0206 [ Links ]
10. Stein AB, Fuller TK, Marker LL. Brown hyaena feeding ecology on Namibian farmlands. S Afr J Wildl Res. 2013;43(1):27-32. https://doi.org/10.3957/056.043.0115 [ Links ]
11. Williams KS, Pitman RT, Mann GKH, Whittington-Jones G, Comley J, Williams ST, et al. Utilizing bycatch camera-trap data for broad-scale occupancy and conservation: A case study of the brown hyaena Parahyaena brunnea. Oryx. 2020;55(2):216-226. https://doi.org/10.1017/S0030605319000747 [ Links ]
12. Welch RJ, Tambling CJ, Bissett C, Gaylard A, Müller K, Slater K, et al. Brown hyena habitat selection varies among sites in a semi-arid region of southern Africa. J Mammal. 2016;97(2):473-482. https://doi.org/10.1093/jmammal/gyv189 [ Links ]
13. Mills MGL. Living near the edge: A review of the ecological relationships between large carnivores in the arid Kalahari. Afr J Wildl Res. 2015;45(2):127-137. https://doi.org/10.3957/056.045.0127 [ Links ]
14. Owens MJ, Owens DD. Feeding ecology and its influence on social organization in brown hyenas (Hyaena brunnea, Thunberg) of the central Kalahari Desert. Afr J Ecol. 1978;16(2):113-135. https://doi.org/10.1111/j.1365-2028.1978.tb00433.x [ Links ]
15. Wiesel I. Predatory and foraging behaviour of brown hyenas (Parahyaena brunnea (Thunberg, 1820)) at Cape fur seal (Arctocephalus pusillus pusillus Schreber, 1776) colonies [dissertation]. Hamburg: University of Hamburg; 2006. [ Links ]
16. Edwards S, Noack J, Heyns L, Rodenwoldt D. Evidence of a high-density brown hyena population within an enclosed reserve: The role of fenced systems in conservation. Mamm Res. 2019;64(4):519-527. https://doi.org/10.1007/s13364-019-00432-7 [ Links ]
17. Welch RJ. Population estimates and spatial ecology of brown hyaenas in Kwandwe Private Game Reserve [thesis]. Rhodes: Rhodes University; 2014. [ Links ]
18. Skinner JD. Ecology of the brown hyaena Hyaena brunnea in the Transvaal with a distribution map of southern Africa. S Afr J Sci. 1976;72(9):262-269. [ Links ]
19. Franchini M, Atzeni L, Lovari S, Nasanbat B, Ravchig S, Herrador FC, et al. Spatiotemporal behavior of predators and prey in an arid environment of Central Asia. Curr Zool. 2023;69(6):670-681. https://doi.org/10.1093/cz/zoac093 [ Links ]
20. Williams KS. Human-brown hyaena relationships and the role of mountainous environments as refuges in a postcolonial landscape [thesis]. Durham: Durham University; 2017. [ Links ]
21. Mills MGL, Mills MEJ. Factors affecting the movement patterns of brown hyaenas, Hyaena brunnea in the southern Kalahari. S Afr J Wildl Res. 1982; 12(4):111-117. [ Links ]
22. Burke A. Managing biodiversity of the greater Fish River Canyon landscape -A tool for sustainable land management. Windhoek: EnviroScience and Namplace; 2013. [ Links ]
23. Brown CJ. Historic distribution of large mammals in the greater Fish River Canyon complex, southern Namibia, and recommendations for re-introductions. Windhoek: Namibia Nature Foundation; 2006. [ Links ]
24. Rovero F, Zimmermann F. Camera trapping for wildlife research. Exeter: Pelagic Publishing; 2016. https://doi.org/10.2307/jj.28833751 [ Links ]
25. R Development Core Team. R: A language and environment for statistical computing. Vienna: R Foundation for Statistical Computing; 2021. [ Links ]
26. Niedballa J, Sollmann R, Courtiol A, Wilting A. camtrapR: An R package for efficient camera trap data management. Methods Ecol Evol. 2016;7(12):1457-1462. https://doi.org/10.1111/2041-210X.12600 [ Links ]
27. Carbone C, Christie S, Conforti K, Coulson T, Franklin N, Ginsberg JR, et al. The use of photographic rates to estimate densities of tigers and other cryptic mammals. Anim Conserv. 2001;4:75-79. https://doi.org/10.1017/S1367943001001081 [ Links ]
28. MacKenzie DI, Nichols JD, Lachman GB, Droege S, Andrew Royle J, Langtimm CA. Estimating site occupancy rates when detection probabilities are less than one. Ecology. 2002;83(8):2248-2255. https://doi.org/10.1890/0012-9658(2002)083[2248:ESORWD]2.0.CO;2 [ Links ]
29. Fiske I, Chandler R. unmarked: An R package for fitting hierarchical models of wildlife occurrence and abundance. J Stat Softw. 2011;43(10):1-23. https://doi.org/10.18637/jss.v043.i10 [ Links ]
30. Wickham H, François R, Henry L, Müller K, Vaughan D. dplyr: A grammar of data manipulation. R package version 1.1.3 [software on the Internet]. c2023 [cited 2024 Dec 03]. Available from: https://CRAN.R-project.org/package=dplyr [ Links ]
31. Regional Centre for Mapping of Resources for Development (RCMRD). RCMRD open data site. Nairobi: RCMRD; 2017. Available from: https://opendata.rcmrd.org/datasets/ [ Links ]
32. Thorn M, Scott DM, Green M, Bateman PW, Cameron EZ. Estimating brown hyaena occupancy using baited camera traps. S Afr J Wildl Res. 2009; 39(1):1-10. https://doi.org/10.3957/056.039.0101 [ Links ]
33. Salinas-Melgoza MA, Skutsch M, Lovett JC. Predicting aboveground forest biomass with topographic variables in human-impacted tropical dry forest landscapes. Ecosphere. 2018;9(1), e02063. https://doi.org/10.1002/ecs2.2063 [ Links ]
34. Riley SJ, DeGloria SD, Elliot R. A terrain ruggedness index that quantifies topographic heterogeneity. Intermount J Sci. 1999;5(1-4):23-27. [ Links ]
35. Kopecky M, Macek M, Wild J. Topographic Wetness Index calculation guidelines based on measured soil moisture and plant species composition. Sci Total Environ. 2021;757, Art. #143785. https://doi.org/10.1016/j.scitotenv.2020.143785 [ Links ]
36. Edwards S, Gange AC, Wiesel I. Spatiotemporal resource partitioning of water sources by African carnivores on Namibian commercial farmlands. J Zool. 2015;297(1):22-31. https://doi.org/10.1111/jzo.12248 [ Links ]
37. Naimi B, Hamm NAS, Groen TA, Skidmore AK, Toxopeus AG. Where is positional uncertainty a problem for species distribution modelling? Ecography. 2014;37(2):191-203. https://doi.org/10.1111/j.1600-0587.2013.00205.x [ Links ]
38. Hair JF. Multivariate data analysis. 7th ed. Harlow: Pearson New International Edition; 2014. [ Links ]
39. Akaike H. A new look at the statistical model identification. In: Parzen E, Tanabe K, Kitagawa G, editors. Selected papers of Hirotugu Akaike. Springer Series in Statistics (Perspectives in Statistics). New York: Springer; 1974. p. 215-216. https://doi.org/10.1007/978-1-4612-1694-0_16 [ Links ]
40. Burnham KP, Anderson DR. Model selection and multi-model inference: A practical information-theoretic approach. 2nd ed. New York: Springer; 2002. [ Links ]
41. Barton K. MuMIn: Multi-model inference. R package version 1.48.11 [software on the Internet]. c2025 [cited 2024 Dec 03]. Available from: https://CRAN.R-project.org/package=MuMIn [ Links ]
42. Burnham KP Anderson DR. Multimodel inference: Understanding AIC and BIC in model selection. Sociol Methods Res. 2004;33(3):261-304. https://doi.org/10.1177/0049124104268644 [ Links ]
43. Ridout MS, Linkie M. Estimating overlap of daily activity patterns from camera trap data. J Agric Biol Environ Stat. 2009;14(3):322-337. https://doi.org/10.1198/jabes.2009.08038 [ Links ]
44. Meredith M, Ridout M, Campbell LAD. Estimates of coefficient of overlapping for animal activity patterns (0.3.4) [document on the Internet]. c2022 [cited 2024 Dec 03]. Available from: https://cran.r-project.org/web/packages/overlap/overlap.pdf [ Links ]
45. Fitak RR, Johnsen S. Bringing the analysis of animal orientation data full circle: Model-based approaches with maximum likelihood. J Exp Biol. 2017;220 (21):3878-3882. https://doi.org/10.1242/jeb.167056 [ Links ]
46. Viviano A, Mori E, Fattorini N, Mazza G, Lazzeri L, Panichi A, et al. Spatiotemporal overlap between the European brown hare and its potential predators and competitors. Animals. 2021;11(2), Art. #562. https://doi.org/10.3390/ani11020562 [ Links ]
47. Schmid F, Schmidt A. Nonparametric estimation of the coefficient of overlapping-theory and empirical application. Comput Stat Data Anal. 2006;50(6):1583-1596. https://doi.org/10.1016/j.csda.2005.01.014 [ Links ]
48. Raimondi F, Sogliani D, Cimini M, Atzeni L, Augugliaro C. Interference competition between wild and domestic ungulates at watering sites of Gobi Desert,Mongolia. Arid Ecosyst.2023;13(3):305-313.https://doi.org/10.1134/S2079096123030101 [ Links ]
49. Lund U, Agostinelli C. R package 'circular': Circular statistics. R package version 0.5-1 [software on the Internet]. c2024 [cited 2024 Dec 03]. Available from: https://CRAN.R-project.org/package=circular [ Links ]
50. Rowcliffe JM, Kays R, Kranstauber B, Carbone C, Jansen PA. Quantifying levels of animal activity using camera trap data. Methods Ecol Evol. 2014;5(11):1170-1179. https://doi.org/10.1111/2041-210X.12278 [ Links ]
51. Thieurmel B, Elmarhraoui A. suncalc: Compute sun position, sunlight phases, moon position and lunar phase. R package version 0.5.2 [software on the Internet]. c2025 [cited 2024 Dec 03]. Available from: https://github.com/datastorm-open/suncalc [ Links ]
52. Gerber BD, Devarajan K, Farris ZJ, Fidino M. A model-based hypothesis framework to define and estimate the diel niche via the 'Diel.Niche' R package. J Anim Ecol. 2024;93(2):132-146. https://doi.org/10.1111/1365-2656.14035 [ Links ]
53. Beier P. Determining minimum habitat areas and habitat corridors for cougars. Conserv Biol. 1993;7(1):94-108. https://doi.org/10.1046/j.1523-1739.1993.07010094.x [ Links ]
54. Panda D, Mohanty S, Suryan T, Pandey P Lee H, Singh R. High striped hyena density suggests coexistence with humans in an agricultural landscape, Rajasthan. PLoS One. 2022;17(5), e0266832. https://doi.org/10.1371/journal.pone.0266832 [ Links ]
55. Vissia S, Wadhwa R, van Langevelde F. Co-occurrence of high densities of brown hyena and spotted hyena in central Tuli, Botswana. J Zool. 2021; 314(2):143-150. https://doi.org/10.1111/jzo.12873 [ Links ]
56. Vissia S, Fattebert J, van Langevelde F. Leopard density and interspecific spatiotemporal interactions in a hyena-dominated landscape. Ecol Evol. 2022;12, e9365. https://doi.org/10.1002/ece3.9365 [ Links ]
57. Krag C, Havmøller LW, Swanepoel L, van Zyl G, Møller PR, Havmøller RW. Impact of artificial waterholes on temporal partitioning in a carnivore guild: A comparison of activity patterns at artificial waterholes to roads and trails. PeerJ. 2023;11, Art. #e15253. https://doi.org/10.7717/peerj.15253 [ Links ]
58. Barker NA, Joubert FG, Kasaona M, Shatumbu G, Stowbunenko V, Alexander KA, et al. Coursing hyenas and stalking lions: The potential for inter- and intraspecific interactions. PLoS One. 2023;18(2), e0265054. https://doi.org/10.1371/journal.pone.0265054 [ Links ]
59. Klare U, Kamler JF, Stenkewitz U, MacDonald DW. Diet, prey selection, and predation impact of black-backed jackals in South Africa. J Wildl Manag. 2010;74(5):1030-1041. https://doi.org/10.2193/2009-211 [ Links ]
60. Périquet S, Valeix M, Claypole J, Drouet-Hoguet N, Salnicki J, Mudimba S, et al. Intraguild interactions influence diet in large carnivores. J Zool. 2015;297(4):245-254. https://doi.org/10.1111/jzo.12275 [ Links ]
 Correspondence:
Veronica Ramello
Email:veronica.ramello@wildlifeinitiative.org
Received: 03 Dec. 2024
Revised: 21 Aug. 2025
Accepted: 12 Sep. 2025
Published: 26 Nov. 2025
* Joint last authors
Editors: Sydney Moyo, Simone Dahms-Verster
Funding: Wildlife Initiative International, Journeys Namibia, Canyon Nature Trust (Namibia)
Supplementary Data
The supplementary data is available in pdf: [Supplementary data]