


Services on Demand
Journal

Article
 English (pdf)
 Article in xml format
 Article references
 Send this article by e-mail
Indicators
Related links
-
 Cited by Google
 -
 Similars in Google
Share

 Permalink
South African Journal of Science
On-line version ISSN 1996-7489Print version ISSN 0038-2353
S. Afr. j. sci. vol.121 n.11-12 Pretoria Nov./Dec. 2025
https://doi.org/10.17159/sajs.2025/20532
RESEARCH ARTICLE
Inequality In the Cape Colony, 1685-1844
Johan Fourie
Laboratory for the Economics of Africa's Past (LEAP), Department of Economics, Stellenbosch University, Stellenbosch, South Africa
ABSTRACT
South Africa has one of the highest levels of inequality globally. This paper shows that such inequality is not a recent development. Using several newly transcribed data sets from the seventeenth-, eighteenth-, and nineteenth-century Cape Colony, I calculate historical wealth inequality across different groups and regions. The sources - including tax censuses, probate inventories and slave valuation rolls - offer rare insight into the structure of pre-industrial society, allowing for comparisons over time and across settler, enslaved and Khoe households. The results reveal persistently high levels of within-group inequality and highlight the concentration of productive resources across all groups with available data. While direct comparisons with modern income or wealth measures are not possible, the evidence suggests that severe economic inequality has long been a defining feature of South African society.
SIGNIFICANCE:
• I show that the Cape Colony in the late seventeenth, eighteenth and early nineteenth centuries experienced severe income and wealth concentration.
• By using newly transcribed tax censuses, probate inventories and slave valuation records, I found severe levels of inequality within settler, enslaved and Khoe groups.
• These findings engage with global inequality debates, demonstrating that severe inequality is not a modern phenomenon but has historical foundations.
Keywords: inequality, gini, wealth, slavery, economic prosperity
Introduction
The World Bank's Gini index, a measure of inequality between 0 and 1, ranks South Africa as the most unequal country in the world. Although its most recent observation for South Africa is now a decade old, it calculates a Gini index for income of 0.63, four points above second-placed Namibia.1 South Africa is even more unequal when considering the distribution of wealth. Chatterjee et al. calculated that the top 10% of South African wealth holders own more than 85% of household wealth, while the top 1% wealth share reaches 55%.2 Von Fintel and Orthofer calculated a wealth Gini between 0.93 and 0.95, noting "wealth is as unequally distributed within South Africa as it is in the world at large"3.
While much of the research attention, for obvious reasons, focuses on post-apartheid trends in inequalities and understanding their determinants, there is little doubt that South Africa's history of racial discrimination and repression helps to explain these persistently high levels of inequality. What is less clear, however, is when this high level of inequality emerged.
To answer this question, I investigated inequality at the beginning of South Africa's colonial history: the Dutch Cape Colony of the seventeenth and eighteenth centuries and the British Cape Colony of the early nineteenth century. I use several newly transcribed data sets that include information about wealth and income for three population groups: the settler population, mostly although not exclusively of European origin; the enslaved population, mostly although not exclusively from territories around the Indian Ocean; and the population of Indigenous pastoral and hunter-gatherer peoples, the Khoesan.
The Cape Colony, I document, was a severely unequal place. As can be expected, inequality between the three population groups was high; settlers were wealthier than the enslaved and Khoesan. What is surprising, though, is the large inequalities within each of these groups. The within-group Gini for settlers is as large as the overall Gini; in other words, were the enslaved and Khoesan removed from the population, the Gini coefficient for the Cape would remain extremely high. Importantly, I find that Khoesan villages and mission stations exhibited equally high levels of wealth inequality.
Measuring inequality
The study of inequality over the long run has attracted attention for at least 70 years. In his seminal 1955 contribution, Kuznets famously argued in favour of a 'long swing' in the relationship between economic growth and inequality, what we today would call an inverted-U line:
widening in the early phases of economic growth when the transition from the pre-industrial to the industrial civilization was most rapid; becoming stabilized for a while; and then narrowing in the later phases.4
More recent work suggests the opposite: of increasing inequality in the rich world, at least since the Second World War.5 Studying top income shares, Atkinson finds a 'U-shaped pattern' for the UK and the USA during the final third of the twentieth century.6 Atkinson et al. report similar results for English-speaking countries and India and China, but not for continental Europe or Japan.7 Whether inequality has risen, fallen or remained stable over the past century - in the USA and elsewhere - remains contested, with important implications for contemporary economic policy debates.8-11
Frustratingly, we know far less about inequality before the twentieth century. Engerman and Sokoloff famously argued that factor endowments shaped institutions in ways that entrenched inequality and slowed long-run development in the Americas, but provided little empirical evidence to support this claim. Instead, much of the more recent work on pre-industrial inequality, in Europe, the USA and elsewhere, has been built on that of Milanovic12. The results suggest that most pre-industrial Western societies were indeed more unequal than those societies today, with mid-nineteenth century Gini coefficients ranging between 0.44 and 0.49 in the USA and rural Palencia in Spain, to 0.52-0.53 in England and Wales, and reaching as high as 0.63 in Holland, for instance.
And what about inequality before the nineteenth century? Waldenstrom cautions that estimates for the mid-nineteenth century may reflect a historical peak, rather than a long-standing norm, noting that "on account of the lack of reliable sources, consensus is not reached regarding pre-industrial wealth inequality"13. Yet new work by Alfani, in a comprehensive review of pre-industrial Europe, finds that "[f]rom circa 1450 or 1500 until 1800, economic inequality (of both wealth and income) has tended to increase almost monotonically across almost all of Europe"14. This echoes the intuition of Van Zanden who, in a seminal paper, points to rising capital incomes in premodern Europe to explain increasing inequality, making the case for a "super-Kuznets curve".15 Others, notably Piketty et al., have documented a similar increase in French inequality from 1807 to 1914, but ascribe the decline thereafter to adverse shocks, notably war, rather than a Kuznets-type process.16
Yet, as Waldenstrom concedes, much of our knowledge about long-run inequality before the nineteenth century remains tentative.13 This is because the sources economists typically use to study such phenomena -national censuses - are mostly a creation of the nineteenth century; the first US census, for example, was administered in 1790 (with income included only in 1940) and the first census of England and Wales in 1801.
Economic historians have, however, found ways around these data limitations. Van Zanden, for example, used a variety of ad hoc tax records, house rental values and personnel rolls to make the case for an inverted-U inequality trend.15 Piketty et al. analysed a large sample of Parisian estate tax returns.16 But the most popular method to examine long-run inequality in data-poor settings before the nineteenth century has been social tables. These tables assign aggregate income or wealth values to broadly representative socio-economic groups. In this way, between-group differences are assumed to be a reliable indicator of overall inequality. For the seventeenth and eighteenth centuries, for example, Lindert reports Gini estimates based on social tables for England ranging from 0.56 in 1688, to 0.52 in 1759, to 0.59 in 1801.17 In Africa, where reliable household-level statistics are often absent for much of the twentieth century, social tables have become an important tool for measuring inequality.18-21 As Links et al. note, the use of social tables has provided "new insights on the connections between long-term economic development, institutions, globalisation, and inequality"22.
Because of the method's reliance on data grouping at the socio-economic level, however, there is a concern that social tables hide considerable within-group inequality.12 One way to mitigate the risk of underestimating inequality is to include more socio-economic classes. Links et al. have recently found that how researchers construct social tables is crucial to the credibility of their inequality estimates. A larger "bottom class", for example, can create a downward bias in inequality estimates, as in the case of large subsistence societies.22
Another way to address the limitations of social tables is to rely on household-level information. While rare for most pre-industrial societies, the late seventeenth- to early nineteenth-century Dutch and British Cape Colony offers uniquely detailed archival records, enabling an unusually precise investigation of pre-industrial inequality. First, though, I offer a brief literature overview of the existing scholarship on the roots of South Africa's high inequality.
Inequality at the Cape
South Africa's persistently high levels of inequality have prompted scholars to investigate its historical roots. Much of this work has focused on the twentieth century, including contributions by Seekings and Nattrass23, van der Berg24 and Alvaredo and Atkinson23-25. These studies show how apartheid entrenched racially structured income and wealth disparities through political exclusion, social stratification and labour-market controls. Yet they also acknowledge that twentieth-century inequality built on foundations laid much earlier - by colonial conquest and mineral discoveries, which shaped a dualistic economy marked by deep divisions from the outset.
The emphasis in much of this literature has been on inequality between racial groups. In the late twentieth century, debates about the links between apartheid, capitalism and inequality centred on the relationship between European settlers, enslaved people and African communities. 'Liberal' scholars traced inequality back to early European conquest, emphasising dispossession and the resulting poverty.26 They tended to see economic growth as a force that might gradually erode apartheid's racial structures. 'Radical' scholars, drawing on Marxist theory, focused instead on colonialism as a prolonged struggle over land, labour and markets, where capital and segregation were deeply intertwined.27 As Seekings and Nattrass observe, however, these debates rarely engaged directly with the measurement of inequality itself.23
Economists and economic historians such as Wilson28, Wilson and Ramphele29, and Feinstein30 also focused on the racial inequalities shaped by conquest and control of resources.28-30 Wilson, for instance, emphasised how settler accumulation depended on access to land and water28, while Feinstein argued that conquest intensified labour shortages, limiting the options of Khoe and African communities and forcing them into wage labour on settler farms30. Bundy noted that slavery and the dispossession of Khoe pastoralists helped produce a "population of propertyless labourers"31. By the early nineteenth century, indebtedness and indentured labour increasingly tied African workers to settler households.32 Later, as Africans beyond the eastern frontier entered the cash economy, class divisions emerged within peasant communities, while capitalist farming and railway expansion created new inequalities among white settlers. Segregation and restrictive land laws further marginalised densely populated rural areas, entrenching poverty under apartheid institutions.33,34 The implication is that inequality intensified over time as marginalised groups faced mounting economic constraints.
Less attention has been paid to inequality within groups. Feinstein30, Bundy31, Terreblanche32 and Giliomee35 have shown that urban settler society was already highly unequal by the early eighteenth century. In 1731, just 7% of settlers owned more than half the colony's landed wealth. This inequality, they argue, was shaped by VOC (Vereenigde Oostindische Compagnie or the Dutch East India Company) mercantilist policies that restricted free trade and regulated prices, and slavery, which advantaged large-scale producers while leaving landless Europeans to work as wage labourers or to farm at the colony's fringes. Recent work by Fourie and von Fintel supports this view.36,37 Using household-level data, they found stark inequalities within the settler population, with a small elite rising above an increasingly impoverished farming class. However, their findings are based on a single district and cover only a few years.
As Chancel et al. note, "[s]ettler colonialism seems to cast its long shadow on Southern Africa even after the demise of apartheid"38. While much of the literature has focused on racial inequality, especially during the twentieth century, relatively little work has attempted to measure inequality over the long run - and, in particular, within-group inequality across time. This study begins to fill that gap by focusing on the Cape Colony from the seventeenth to the nineteenth centuries, using newly transcribed household-level data to reconstruct historical patterns of inequality.
New sources
The Cape Colony was established by the Dutch East India Company in 1652 as a refreshment station for ships travelling to and from Asia. Over time, it expanded into a settler colony with an agricultural economy based on grain, wine and livestock production, initially concentrated in the southwestern districts of Stellenbosch and Drakenstein. These districts, close to Cape Town and well integrated into market exchange, remained the colony's economic core throughout the eighteenth century. Recent evidence suggests that these settler communities were not merely subsistence farmers but, particularly in the southwestern districts, accumulated levels of wealth comparable to some of the most prosperous regions of eighteenth-century Europe.39,40
By the early 1800s, the colony had expanded significantly, with settlers moving eastward across the interior. This expansion produced a distinctive economic geography: an urban port, a settled agricultural hinterland worked by enslaved and Khoesan labourers, and a frontier zone of extensive pastoralism. Most farmers were not specialised producers but combined multiple activities - viticulture, grain cultivation, and livestock farming - depending on soil, climate and access to markets.
By 1825, the Cape Colony had been divided into 11 administrative districts, with settler communities established from the agricultural heartland around Cape Town to the eastern and northern frontiers. That year's opgaafrolle [tax records] recorded more than 10 420 settler households across the colony, with Stellenbosch and Drakenstein together accounting for 15.7% of the total. In 1825, wheat output per farm in Stellenbosch and Drakenstein was among the highest in the colony, reflecting the region's early integration into market exchange and access to more fertile land.41 As noted, most settler farms pursued diversified agricultural strategies, combining different types of crop cultivation and livestock rearing. Because the VOC prohibited manufacturing at the Cape, farmers also engaged in secondary and limited tertiary activities, such as small-scale brandy production and local trade.42
This diversified production relied heavily on labour. By 1834, over 37 000 enslaved individuals were recorded in the Cape slave valuation rolls, forming what is effectively a near-complete census of the enslaved population on the eve of emancipation. Of these, more than 8400 were registered in the Stellenbosch and Drakenstein districts alone.43 Although numbers are more difficult to estimate, records suggest a steady increase in the use of Khoesan labour, particularly on the frontier. Settler households themselves contributed to the labour supply, with high fertility rates ensuring a steady growth in family labour.44
This rapid demographic expansion was matched by an administrative and bureaucratic growth that left behind a remarkable paper trail. This administrative legacy can be traced to two main causes: the Cape was governed, first, by a profit-maximising company, the Dutch East India Company, which prioritised recordkeeping to maximise profit and minimise corruption, and, second, by the British, for whom political control meant an accurate assessment of its subjects. The second reason for the information abundance is that Cape Town, where these records have been preserved for more than three centuries, has never experienced a major war or natural disaster. It is this rich supply of historical records that allows scholars to go beyond simple social table analyses. It was these records I used to calculate inequality measures for the Cape over almost two centuries. My analysis begins in 1685, three decades after Jan van Riebeeck and his crew of Company workers arrived in Table Bay, and ends in 1844, six years after the enslaved were allowed to leave the farms of the slave owners. The choice of years depended almost entirely on the availability and completeness of the source material.
I used several new historical sources to calculate and compare wealth inequality at the Cape. The first and largest is the opgaafrolle or tax censuses of the Colony. Over the last decade, a team of historians has been meticulously transcribing these records in the Cape Archives in Cape Town's Roeland street archives, or, when possible, from the online collection of the Dutch National Archives in The Hague.45 The annual censuses of settler households are remarkably rich in their content. (Although "settlers" here refer predominantly to those of European descent, the tax censuses include all free burghers, including those of mixed-race residents, freed slaves, and, less frequently, independent Khoesan farmers and mission station residents.) They include the names of the male household head and wife, the number of settler sons and daughters, the number of enslaved workers (by gender and age), the number of Khoesan workers (by gender and age), and then various agricultural assets, including a count of horses, cattle, sheep, pigs and vines, and quantities of wheat, barley, rye and oats reaped and produced, and wine (and later brandy) produced. Towards the end of the period, the tax censuses also included information about wagon ownership and taxes paid.
While the VOC levied taxes primarily on surplus agricultural production, enforcement was inconsistent. Taxes were assessed annually by local officials who questioned settlers directly rather than conducting inspections. This reliance on self-reporting created clear incentives for under-reporting. Assets not subject to tax, such as slaves, were likely reported more accurately, while taxable assets, especially grain and later livestock, were systematically under-reported, particularly by wealthier households with more to gain.46 It is also likely that under-reporting varied across space and time. As such, any analysis must acknowledge the limitations of using these opgaafrolle: tax-based data may bias estimates downwards for taxable wealth, while the absence of fixed assets like land, which was more evenly distributed, could bias inequality estimates upwards. Yet, despite these concerns, the comprehensiveness of the opgaafrolle, their near-complete coverage of settler households and consistent inclusion of a wide range of economic variables, makes them the most reliable source for studying long-run inequality at the Cape.47
Another source I used is the probate inventories of Cape settlers. The assets of deceased settlers offer another opportunity to measure inequality. Probate inventories were collected by the Master of the Orphan Chamber (MOOC) in Cape Town, an institution responsible for administering estates when individuals died intestate, left heirs under 25 or unmarried or had heirs who were untraceable. In some cases, settlers specifically requested that the Orphan Chamber act as the executor of their estates, and, if no exclusions were made in their wills, the Chamber took responsibility. The series documents the material wealth left behind by deceased settlers, including household goods, livestock, slaves, and other movable assets, allowing researchers to paint a detailed picture of the economic life in the Colony. I first analysed the MOOC 8-series a decade ago39; for this analysis, however, I used an updated version that includes the full series of probates into the nineteenth century.
Third, I used a recently constructed Slave Emancipation Data set. The data set provides detailed insight into slave ownership and wealth distribution in the Cape Colony at the time of abolition in 1834.43 Compiled from slave valuation rolls, slave registers and compensation data, it allows for the analysis of inequality among slave-holders.
The foundation of the data set is the slave valuation rolls, compiled by appraisers appointed by London in 1834. These officials travelled across the Cape Colony's 11 districts, documenting slave owners, the number of slaves they held, and various characteristics of the enslaved, such as their age, gender and occupation. This data set provides a near-complete census of slave ownership on the eve of emancipation, but it is crucial to note that it only includes those settlers who still owned slaves in 1834. Valuations were based on historical slave sale averages from 1823 to 1830, adjusted for district conditions, although the Clanwilliam and Swellendam districts lack valuation data.
Following the appraisals, slave owners were compensated by the British government, but the compensation process was controversial. Rather than receiving payment based on the appraised value of each individual slave, slave-holders were compensated according to an average value per slave class, calculated across the entire colony. This method, meant to allocate the limited compensation funds as evenly as possible, often resulted in significant discrepancies between the appraised value of slaves and the actual compensation received. Slave owners, in many cases, received far less than the estimated value of their slaves, fuelling dissatisfaction, especially among wealthier slave-holders.
Each data set introduces specific biases due to the limitations inherent in historical records. The annual tax censuses may contain errors from repeated handling and the poor condition of original documents; to reduce this impact, I manually trimmed outlier values, although this was unnecessary for the smaller probate and slave emancipation data sets. The MOOC 8-series probate inventories also face geographic and demographic bias, as they mostly reflect wealthier, younger estates near Cape Town, likely omitting poorer, remote frontier farmers and older households. Coverage of the settler population declines after the 1740s, potentially increasing sampling bias, yet the series remains invaluable for studying Cape wealth and material culture. Lastly, the Slave Emancipation Data set omits data for certain districts.
Here, I measure inequality based on agricultural assets recorded in these sources, encompassing elements of both income and wealth inequality. While some assets, like wheat reaped, reflect flow variables akin to income, most assets - such as the numbers of horses, cattle, and sheep - represent stock variables, a form of wealth. However, these are not pure wealth estimates: I do not capture fixed household assets, such as land or property, nor financial assets, except for the compensation settlers received at emancipation. Thus, these Gini estimates should lie between standard income and wealth inequality measures.
Finally, a full description of the data curation and transformation is provided in the supplementary material. All data and source codes used in this paper are available upon request to the corresponding author and will be made publicly available upon completion of the project in 2026; further details can be found at www.capepanel.org.
Results
I used four complementary data sets to trace the evolution and structure of inequality in the Cape Colony between the late seventeenth and mid-nineteenth centuries. First, I analysed the data from the tax censuses, focusing on patterns of inequality over time and across space. Second, I examined the settler probate inventories, which provide insights into wealth distribution based on the assets of deceased individuals. Third, I present findings from the slave emancipation data set, highlighting the valuations of enslaved individuals and the compensation received by slave owners following emancipation. Finally, I return to the tax censuses to study inequality within Khoe settlements.
Tax censuses
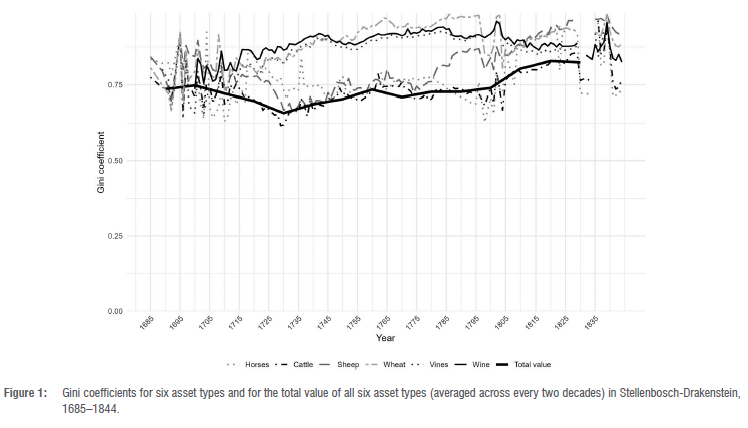
I first plot, in Figure 1, the annual Gini coefficients for six asset types -horses, cattle, sheep, wheat reaped, vines and wine - as well as the total value of the combined assets in the district of Stellenbosch-Drakenstein, one of the oldest and most populous districts within the Colony, and for which the records are also most complete.48 A total of 142 219 household-level observations were recorded across 159 annual censuses conducted between 1685 and 1844. These are not necessarily unique households, as many were surveyed repeatedly over time. The number of households recorded per year increased markedly over the period. In the first decade (1685-1694), the censuses recorded an average of 219 households per year. By the final decade (1835-1844), that figure had risen to 1442 households per year. The average across the entire period was 995 households per year.
Three trends are immediately apparent. First, inequality within the free population is remarkably high; not a single asset has a measured Gini of less than 0.5 in any year between 1685 and 1844. Second, although there is some variation over time - the Gini for wine, for example, increases during the eighteenth century and then begins to decline at the turn of the nineteenth century - Gini coefficients are largely persistent. Third, there are moments of volatility: during the first three decades of the sample, in the period 1795-1805 and again after 1828. These reflect changes to the data generating process - political and institutional change - and should be treated with caution.
I next combined these six assets into a basket and calculated the Gini coefficient of the combined asset values. I derived a rix-dollar price series for the six basket assets from the Cape Orphan Chamber auction rolls (MOOC10, volumes 1-39, covering 1701-1825), recently transcribed and digitised.49 These auction-based prices are broadly stable through much of the eighteenth century but rise sharply and become more dispersed from the 1780s into the early nineteenth century - a pattern visible, for example, in ox prices, which are mostly below 20 rix-dollars before the 1780s and have higher medians after 1800. Valuing holdings at these contemporaneous market prices provides a common numeraire across households and years at the Cape, enabling like-for-like Gini calculations. The resulting series, shown in Figure 1, confirms the above results: a high and persistent Gini coefficient of between 0.6 and 0.75 for the entire eighteenth century, increasing further into the nineteenth century. As this measure combines the total production of all six asset categories, it yields somewhat lower inequality than the more extreme asset types, reflecting the non-specialised nature of agricultural production - yet it remains very high.
Another way to report the distribution is to express it in terms of top shares. Calculated on the combined value of the six agricultural assets only - excluding land and all other assets - and for settler households alone (Khoe and enslaved households excluded), the top 1% holds on average about 12% over the period, rising into the nineteenth century (averaging about 18% in 1800-1830). The upper tail likewise thickens: the top 0.1% and 0.01% increase from around 2% and 0.5% in the eighteenth century to about 3.7% and 0.8%, respectively, in the early nineteenth century. Although these values should be read with caution - they refer only to agricultural asset values and are therefore not directly comparable to estimates of top shares in later periods - they nevertheless indicate a distribution heavily skewed to the top.
Cape settlers relied heavily on slave labour, and ownership of enslaved people is recorded in the tax censuses. Although the proportion of slave-owning households declined somewhat during the eighteenth century, slave-holding remained more unequally distributed than other asset types throughout the period. The Gini coefficient for slave men, for example, consistently exceeded 0.7.
I first included enslaved people as assets within settler households. Because individual slave prices are not recorded in the tax censuses, I approximated their value by capitalising an annual 'income' of 12 sheep at a 6% interest rate - yielding an estimated value of 200 sheep per enslaved person.50 This aligns with historical estimates from the early nineteenth century suggesting that Khoe labourers received, on average, a sheep per month.51 Including slaves in the settler asset basket lowers the Gini coefficient slightly, as indicated by the dashed line in Figure 2. This suggests that slave ownership was not perfectly correlated with taxable agricultural output and is consistent with the historical record that enslaved labour was also used for domestic and artisanal work (e.g. as wagon drivers, coopers or servants), which is not reflected in the censuses.
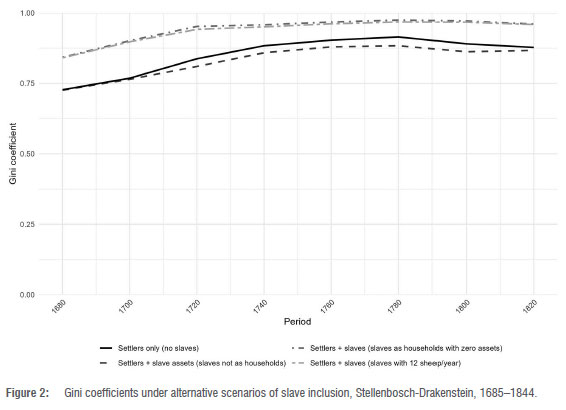
Yet enslaved people were not only economic inputs within settler households; they were part of the broader colonial population. To estimate inequality across both settlers and the enslaved in the Stellenbosch-Drakenstein district, I treated enslaved men as separate households and calculated two additional scenarios. In the first, I assumed they owned no assets. This assumption is not strictly accurate - enslaved individuals could, and sometimes did, accumulate personal property and savings, including to purchase manumission - but such cases were relatively rare before the legal reforms of the 1820s, which began to formalise slave property rights.52 In this scenario (shown by the dotted line in Figure 2), the Gini coefficient rises steeply, reaching 0.92 by the late eighteenth century.
In the second scenario, I assumed enslaved men received in-kind compensation equivalent to 12 sheep per year. This adjustment reduced measured inequality slightly, but the resulting Gini coefficient (shown by the dot-dashed line) remains extremely high, hovering around 0.89 to 0.91. These values are consistent with those found for Caribbean slave societies53, and stand in contrast to the Cape's relatively equal land distribution and the partible inheritance system, which should have tempered wealth concentration54. The combination of enslaved labour, skewed asset ownership and demographic structure thus produced one of the most unequal settler societies in the early modern world.
It is important to note that the estimates presented thus far exclude Indigenous communities, most notably the Khoe, who were not systematically recorded in the settler tax censuses. While Khoe labour was critical to the colonial economy - particularly on the frontier - our knowledge of their population size and distribution remains limited. Estimating their numbers, let alone changes over time, is highly uncertain and cannot be meaningfully compared to the more precise counts available for settlers and enslaved individuals. For this reason, Khoe households are not included in the inequality estimates shown in Figures 1 and 2. We return to them later, when we examine the subset of Khoe households that do appear in the tax records and consider patterns of asset ownership within those communities.
These results are for the entire eighteenth century but focus only on the district of Stellenbosch-Drakenstein. Perhaps this region was uniquely unequal. To test whether this is true, I turned to a cross-section of all districts for which tax censuses are available in or around 1825. I used 1825 for the Cape district, Stellenbosch, Graaff-Reinet, Swellendam, Albany, Beaufort, George and Uitenhage; 1824 for Clanwilliam and Worcester; and 1823 for Cradock. I calculated the Gini coefficient for six agricultural outputs: horses, oxen, cattle, sheep, wheat and wine. The full data set consists of 10 420 observations. Note that these are unique households, as I relied on a single year only. The results are presented in Figure 3.
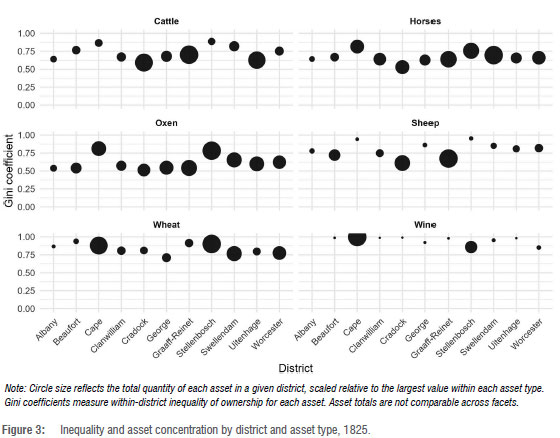
Apart from one case - Albany has no wine production in 1825 - the Gini coefficients are above 0.5 for all output variables in all districts. Some output types are, however, more unequal than others. Wine, for example, is far more unequally distributed than any other crop: all districts record Gini coefficients above 0.8. By contrast, horses and oxen are more equally distributed. This suggests two reasons why Stellenbosch should be seen as the upper end of the inequality distribution: it had high wine output and it had a large concentration of enslaved people.
Probate inventories
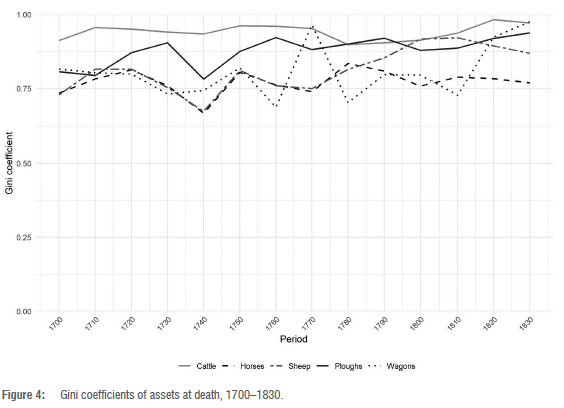
I next analysed 4423 probates in total to calculate inequality. Despite concerns about sample selection, there are several benefits to using probates. First, they document a range of household assets, although I do not exploit this feature here. Instead, I only report five asset types to allow for easier comparison with the tax censuses. The levels of inequality for the other assets, however, largely mirror those reported here. Second, probates cover the entire period of analysis and all districts with little change in administrative procedure and reporting. Third, they avoid issues of tax avoidance, a serious concern in the tax censuses (and another reason to suspect that inequality is underestimated).
Figure 4 reports the Gini coefficients for cattle, horses, sheep, ploughs and wagons over the eighteenth and early nineteenth centuries. All five Gini coefficients closely mirror those calculated from the tax records. Both measures indicate severe and persistent inequality, with Gini coefficients for all assets exceeding 0.6, and from 1770 onward, surpassing 0.7. There is little doubt that these results reflect a deeply unequal distribution of settler wealth from very early in the colonial period.
Slave emancipation
The Slave Emancipation Data set reports the valuation of each enslaved individual as well as the compensation each owner received. The total number of individual-level observations is 36 417. I calculated the Gini coefficient of both. Figure 5 reports the scatter plot of the two, by district (the black dots). What is clear is that slave ownership was unequal in 1834, although not as extreme as that from the other records analysed: the valuation Gini ranges between a low 0.29 for Somerset and Uitenhage to a relatively high 0.47 for Worcester. Compensation Gini coefficients are more unequal: some slave owners clearly received compensation equivalent to the value of their enslaved while others did not, as also highlighted in the literature. These Gini coefficients range between 0.45 in Somerset and 0.55 in the Cape district.
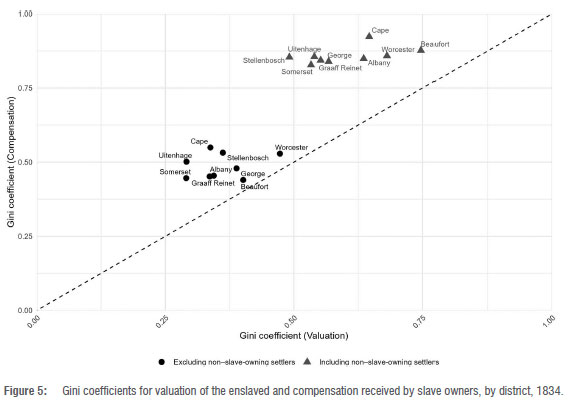
Although these Gini coefficients suggest that inequality in slave ownership existed - and, therefore, wealth inequality, as enslaved people were considered the most valuable asset at the time - these results hide an important truth: it only includes slave owners, less than 30% of the settler population at the time. To calculate the actual settler inequality, I added 13 033 non-slave-owning settlers, and re-estimated both Gini coefficients. The results are also reported in Figure 5 (grey triangles).
The results now align much more closely with the inequality estimates as calculated in the tax censuses and probate inventories. Gini coefficients for the valuation data set range between 0.49 (Stellenbosch, surprisingly the least unequal district) and 0.75 in Beaufort, although that is largely a consequence of very few slave-owning families in that district. When considering the compensation received, Gini coefficient estimates are extreme, ranging between 0.83 in Somerset to 0.92 in the Cape district. Again, wealth was highly unequally distributed.
Khoe settlements
The above results reflect income and wealth inequalities of settler households. Where I have incorporated enslaved people, they appear as zeros. But colonial recordkeeping was not limited to the settler population. By the early nineteenth century, several Khoe settlements were also incorporated into the colonial administrative system, notably mission stations. These records are now being transcribed and analysed.
I considered three of these settlements in 1825: Bethelsdorp, Swartrivier, and Groenekloof. Bethelsdorp, founded in 1803 by the London Missionary Society near Algoa Bay, became an important settlement for the Khoe, offering some protection and autonomy within the colonial system.55 By 1814, Bethelsdorp had become a refuge for the 425 Khoe households recorded in the tax census, although it struggled economically due to poor soil and limited resources. Swartrivier, in the Swellendam district, developed as the Khoe were being drawn into the colonial economy through labour contracts and informal patronage.56 Primarily pastoralists, many Khoe worked for European farmers as herders or labourers, often in exploitative conditions. By 1825, Swartrivier served as a base for 364 Khoe households trying to maintain some independence. Groenekloof (later Mamre), established in the early nineteenth century by the Moravian Missionary Society, became a haven for freed slaves and Khoesan.57 By 1825, it was a thriving community where 108 households practised subsistence farming and casual labour. Although it offered sanctuary, the settlement's population remained largely reliant on nearby farms for employment.
The tax records for these three settlements are similar in style and content to those collected for settler households, but they typically record fewer variables (on account, presumably, of Khoe households owning fewer assets). For my purposes here, I considered five asset types: cattle, horses, oxen, sheep and wheat reaped. I calculated Gini coefficients for each asset type across the three districts and report the results in Figure 6.
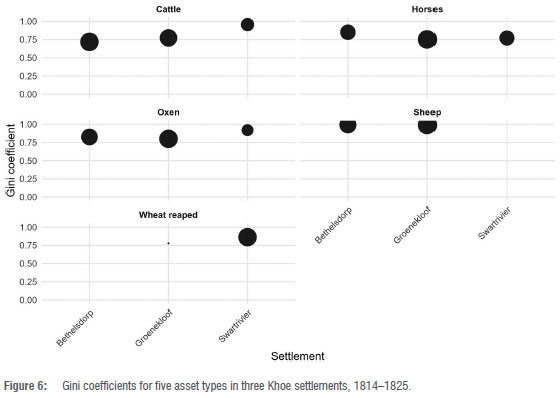
The Gini coefficients reveal severe inequality within all three Khoe settlements. Aside from cattle in Bethelsdorp with a Gini of 0.72, all other assets have Gini coefficients above 0.75, with some very close to perfect inequality. For example, only ten families own sheep in Bethelsdorp and only one family owns sheep in Groenekloof. In many ways, the inequality within these Khoe settlements is as pronounced, and sometimes more so, than that recorded among settlers. However, when Khoe and settler households in Groenekloof, Swartrivier and Swellendam are combined into a single population, a different picture emerges. Because settler households were, on average, significantly wealthier than Khoe households, overall inequality rises sharply, reflecting both high within-group inequality and substantial between-group disparities. The Gini coefficient for cattle ownership, for instance, reaches 0.92, while the measures for horses, oxen and wheat all exceed 0.77.
These results reflect the severe and persistent inequality, both within and across the various population groups and time periods in the Cape Colony. Whether examining settler households, slave ownership or Khoe settlements, the data consistently reveal high levels of wealth concentration. Inequality, the household-level data reveal, was a defining feature of the eighteenth and nineteenth century, pre-industrial Cape society.
Conclusions
In their analysis of top incomes in twentieth-century South Africa, Alvaredo and Atkinson note that "[t]he share of the top 1% was halved between 1914 and 1993"25. This raises an important but largely unanswered historical question: when did these high levels of inequality emerge?
To begin answering this, I drew on newly transcribed household-level records from the seventeenth-, eighteenth- and nineteenth-century Cape Colony. These include tax censuses, probate inventories and slave valuation rolls, which together enabled the first detailed reconstruction of inequality across different groups and periods in early colonial South Africa. The results reveal striking levels of inequality within settler society and, where data permit, within Khoe communities as well. Measured through ownership of agricultural assets, inequality among households consistently exceeded Gini coefficients of 0.6 - a threshold typically associated with severe levels of inequality in contemporary settings.
This study contributes to South Africa's economic history by demonstrating that severe inequality is not a recent phenomenon. Rather, it was already deeply embedded in the structure of colonial society, long before the onset of twentieth-century racial segregation. While direct comparisons with modern income or wealth measures are difficult, the evidence suggests that highly unequal distributions of productive resources were a persistent feature of South African history.
Acknowledgements
I am grateful to Erik Green, Nicoli Nattrass, Rebecca Simson, Dieter von Fintel, Servaas van der Berg and two excellent anonymous referees for their valuable feedback on an earlier draft of this work. I also acknowledge the research support provided by Kelsey Lemon, Calumet Links, Lisa-Cheree Martin, Jan Hendrik Pretorius, Jonathan Schoots and Leoné Walters. A special debt of gratitude goes to Chris de Wit, Hans Heese and Linda Orlando who dedicated countless hours over the past decade to transcribing the original records.
Funding
Funding from the Bank of Sweden Tercentenary Foundation (Dnr: M20-0041) is acknowledged.
Data availability
The data supporting the results of this study are available upon request to the corresponding author. As noted in the text, all data and source codes used in this paper will be made publicly available upon completion of the project in 2026; further details can be found at www.capepanel.org.
Declarations
I have no competing interests to declare. I have no AI or LLM use to declare.
References
1. World Bank Group. Gini index [webpage on the Internet]. c2024 [cited 2024 Nov 08]. Available from: https://data.worldbank.org/indicator/SI.POVGINI [ Links ]
2. Chatterjee A, Czajka L, Gethin A. Wealth inequality in South Africa, 19932017. World Bank Econ Rev. 2022;36(1):19-36. https://doi.org/10.1093/wber/lhab012 [ Links ]
3. von Fintel D, Orthofer A. Wealth inequality and financial inclusion: Evidence from South African tax and survey records. Econ Model. 2020;91:568-578. https://doi.org/10.1016/j.econmod.2020.02.001 [ Links ]
4. Kuznets S. Economic growth and income inequality. Am Econ Rev. 1955; 45(1):1-28. [ Links ]
5. Piketty T. Capital in the twenty-first century. Cambridge, MA: Belknap Press; 2014. https://doi.org/10.4159/9780674369542 [ Links ]
6. Atkinson AB. Top incomes in the UK over the 20th century. J R Stat Soc Ser A Stat Soc. 2005;168(2):325-343. https://doi.org/10.1111/j.1467-985X.2005.00351.x [ Links ]
7. Atkinson AB, Piketty T, Saez E. Top incomes in the long run of history. J Econ Lit. 2011;49(1):3-71. https://doi.org/10.1257/jeL49.1.3 [ Links ]
8. Piketty T, Saez E, Zucman G. Distributional national accounts: Methods and estimates for the United States. Q J Econ. 2018;133(2):553-609. https://doi.org/10.1093/qje/qjx043 [ Links ]
9. Zucman G. Global wealth inequality. Annu Rev Econ. 2019;11(1):109-138. https://doi.org/10.1146/annurev-economics-080218-025852 [ Links ]
10. Saez E, Zucman G. The rise of income and wealth inequality in America: Evidence from distributional macroeconomic accounts. J Econ Perspect. 2020;34(4):3-26. https://doi.org/10.1257/jep.34.4.3 [ Links ]
11. Smith M, Zidar O, Zwick E. Top wealth in America: New estimates under heterogeneous returns. Q J Econ. 2023;138(1):515-573. https://doi.org/10.1093/qje/qjac033 [ Links ]
12. Milanovic B. Towards an explanation of inequality in premodern societies: The role of colonies, urbanization, and high population density. Econ Hist Rev. 2018;71(4):1029-1047. https://doi.org/10.1111/ehr.12613 [ Links ]
13. Waldenstrom D. Richer & more equal: A new history of wealth in the West. Cambridge, MA: Polity Press; 2024. [ Links ]
14. Alfani G. Economic inequality in preindustrial times: Europe and beyond. J Econ Lit. 2021;59(1):3-44. https://doi.org/10.1257/jel.20191449 [ Links ]
15. Van Zanden JL. Tracing the beginning of the Kuznets curve: Western Europe during the early modern period. Econ Hist Rev. 1995;48(4):643-664. https://doi.org/10.2307/2598128 [ Links ]
16. Piketty T, Postel-Vinay G, Rosenthal JL. Wealth concentration in a developing economy: Paris and France, 1807-1994. Am Econ Rev. 2006;96(1):236-256. https://doi.org/10.1257/000282806776157614 [ Links ]
17. Lindert PH. Chapter 3: Three centuries of inequality in Britain and America. In: Bourguignon F, Lindert PH, editors. Handbook of income distribution. Amsterdam: Elsevier; 2000. p. 167-216. https://doi.org/10.1016/S1574-0056(00)80006-8 [ Links ]
18. de Haas M. Reconstructing income inequality in a colonial cash crop economy: Five social tables for Uganda, 1925-1965. Eur Rev Econ Hist. 2022; 26(2):255-283. https://doi.org/10.1093/ereh/heab010 [ Links ]
19. Galli S, Theodoridis D, Rönnbäck K. Economic inequality in Latin America and Africa, 1650 to 1950: Can a comparison of historical trajectories help to understand underdevelopment? Econ Hist Dev Reg. 2022;38(1):41-64. https://doi.org/10.1080/20780389.2021.2024073 [ Links ]
20. Frankema E, de Haas M, van Waijenburg M. Inequality regimes in Africa from pre-colonial times to the present. Afr Aff. 2023;122(486):57-94. https://doi.org/10.1093/afraf/adad001 [ Links ]
21. Hillbom E, Bolt J, de Haas M, Tadei F. Income inequality and export-oriented commercialization in colonial Africa: Evidence from six countries. Econ Hist Rev. 2024;77(3):975-1004. https://doi.org/10.1111/ehr.13304 [ Links ]
22. Links C, Von Fintel D, Green E. Estimating historical inequality from social tables: Towards methodological consistency [preprint]. SSRN; 2023. https://doi.org/10.2139/ssrn.4450261 [ Links ]
23. Seekings J, Nattrass N. Class, race and inequality in South Africa. New Haven, CT: Yale University Press; 2005. https://doi.org/10.12987/yale/9780300108927.001.0001 [ Links ]
24. van der Berg S. Current poverty and income distribution in the context of South African history. Econ Hist Dev Reg. 2011;26(1):120-140. https://doi.org/10.1080/20780389.2011.583018 [ Links ]
25. Alvaredo F, Atkinson AB. Top incomes in South Africa in the twentieth century. Cliometrica. 2022;16(3):477-546. https://doi.org/10.1007/s11698-021-00235-4 [ Links ]
26. Robertson HM. 150 years of economic contact between black and white. S Afr J Econ. 1934;2(4):403-425. https://doi.org/10.1111/j.1813-6982.1934.tb03010.x [ Links ]
27. Murray MJ. The triumph of Marxist approaches in South African social and labour history. In: Gutkind PCW, editor. Third world workers: Comparative international labour studies. Leiden: E.J. Brill; 1988. p. 79-101. https://doi.org/10.1163/9789004478015_007 [ Links ]
28. Wilson F. Historical roots of inequality in South Africa. Econ Hist Dev Reg. 2011;26(1):1-15. https://doi.org/10.1080/20780389.2011.583026 [ Links ]
29. Wilson F, Ramphele M. Uprooting poverty: The South African challenge: Report for the Second Carnegie Inquiry into Poverty and Development in Southern Africa. 2nd ed. Cape Town: David Philip; 1989. [ Links ]
30. Feinstein CH. An economic history of South Africa: Conquest, discrimination and development. Cambridge, UK: Cambridge University Press; 2005. https://doi.org/10.1017/CBO9781139165457 [ Links ]
31. Bundy C. The rise and fall of the South African peasantry. Berkeley, CA: University of California Press; 1979. [ Links ]
32. Terreblanche S. A history of inequality in South Africa, 1652-2002. Pietermaritzburg: University of Durban Press; 2002. [ Links ]
33. von Fintel DP. Long-run spatial inequality in South Africa: Early settlement patterns and separate development. Stud Econ Econom. 2018;42(2):81-102. https://doi.org/10.1080/10800379.2018.12097335 [ Links ]
34. von Fintel D, Fourie J. The great divergence in South Africa: Population and wealth dynamics over two centuries. J Comp Econ. 2019;47(4):759-773. https://doi.org/10.1016/j.jce.2019.08.005 [ Links ]
35. Giliomee H. The Afrikaners: Biography of a people. Cape Town: Tafelberg; 2003. [ Links ]
36. Fourie J, von Fintel D. The dynamics of inequality in a newly settled, pre-industrial society: The case of the Cape Colony. Cliometrica. 2010;4:229-267. https://doi.org/10.1007/s11698-009-0044-1 [ Links ]
37. Fourie J, von Fintel D. A history with evidence: Income inequality in the Dutch Cape Colony. Econ Hist Dev Reg. 2011;26(1):16-48. https://doi.org/10.1080/20780389.2011.582990 [ Links ]
38. Chancel L, Cogneau D, Gethin A, Myczkowski A, Robilliard AS. Income inequality in Africa, 1990-2019: Measurement, patterns, determinants. World Dev. 2023;163, Art. #106162. https://doi.org/10.1016/j.worlddev.2022.106162 [ Links ]
39. Fourie J. The remarkable wealth of the Dutch Cape Colony: Measurements from eighteenth-century probate inventories. Econ Hist Rev. 2013;66(2):419-448. https://doi.org/10.1111/j.1468-0289.2012.00662.x [ Links ]
40. Fourie J, Garmon F. The settlers' fortunes: Comparing tax censuses in the Cape Colony and early American republic. Econ Hist Rev. 2023;76(2):525-550. https://doi.org/10.1111/ehr.13190 [ Links ]
41. Fourie J, Greyling J. Wheat productivity in the Cape Colony in 1825: Evidence from newly transcribed tax censuses. Agrekon. 2023;62(1):98-115. https://doi.org/10.1080/03031853.2023.2176895 [ Links ]
42. Fourie J. Slaves as capital investment in the Dutch Cape Colony. In: Hillbom E, Svensson P, editors. Agricultural transformation in a global history perspective. London: Routledge; 2013. p. 136-159. [ Links ]
43. Ekama K, Fourie J, Heese H, Martin LC. When Cape slavery ended: Introducing a new slave emancipation dataset. Explor Econ Hist. 2021;81, Art. #101390. https://doi.org/10.1016/j.eeh.2021.101390 [ Links ]
44. Cilliers J, Mariotti M. The shaping of a settler fertility transition: Eighteenth-and nineteenth-century South African demographic history reconsidered. Eur Rev Econ Hist. 2019;23(4):421-445. https://doi.org/10.1093/ereh/hey019 [ Links ]
45. Fourie J, Green E. Building the Cape of Good Hope panel. Hist Fam. 2018; 23(3):493-502. https://doi.org/10.1080/1081602X.2018.1509367 [ Links ]
46. Van Duin P, Ross R. The economy of the Cape Colony in the eighteenth century. Vol. 7. Leiden: Centre for the History of European Expansion; 1987. [ Links ]
47. Rijpma A, Cilliers J, Fourie J. Record linkage in the Cape of Good Hope panel. Hist Methods. 2020;53(2):112-129. https://doi.org/10.1080/01615440.2018.1517030 [ Links ]
48. Fourie J, Green E, Burger C, de Wit C, Ekama K, Greyling J, et al. 'Waar is beter dorp in Zuid Africa dan Stellenbos?'[Where is a better village in South Africa than Stellenbosch?]: What the Stellenbosch-Drakenstein tax censuses reveal. S Afr Hist J. 2024;76(4):420-446. https://doi.org/10.1080/02582473.2025.2500410 [ Links ]
49. Fourie J, Liebenberg H, Schoots J, van der Linde P. Auction records, consumer culture and social networks in the Cape Colony, 1701-1825. S Afr J Cult Hist. 2025;39(1):27-49. https://doi.org/10.54272/sach.2025.v39n1a2 [ Links ]
50. Fourie J, Swanepoel C. 'Impending ruin' or 'remarkable wealth'? The role of private credit markets in the 18th-century Cape Colony. J South Afr Stud. 2018;44(1):7-25. https://doi.org/10.1080/03057070.2018.1403218 [ Links ]
51. Links C, Fourie J, Green E. The substitutability of slaves: Evidence from the eastern frontier of the Cape Colony. Econ Hist Dev Reg. 2020;35(2):98-122. https://doi.org/10.1080/20780389.2019.1669444 [ Links ]
52. Ekama K. Bound to be free? Manumission in Cape Town, 1825-34. Slavery Abol. 2025;46(2):441-462. https://doi.org/10.1080/0144039X.2024.2389549 [ Links ]
53. Galli S, Theodoridis D, Rönnbäck K. Elite persistence and inequality in the Danish West Indies, 1760-1914. Explor Econ Hist. 2024;94, Art. #101636. https://doi.org/10.1016/j.eeh.2024.101636 [ Links ]
54. Guelke L. Freehold farmers and frontier settlers, 1657-1780. In: Elphick R, Giliomee H, editors. The shaping of South African society, 1652-1840. 2nd ed. Cape Town: Maskew Miller Longman; 1990. p. 66-108. [ Links ]
55. Elbourne E. Early Khoisan uses of Mission Christianity. Kronos J Cape Hist. 1992;19(1):3-27. [ Links ]
56. Links C. Khoe households in Swellendam, 1825. In: Fourie J, editor. Quantitative history and uncharted people: Case studies from the South African past. London: Bloomsbury Academic; 2023. p. 91-116. https://doi.org/10.5040/9781350335608.ch-4 [ Links ]
57. Ludlow EH. Missions and emancipation in the South Western Cape: A case study of Groenekloof (Mamre), 1838-1852 [master's dissertation]. Cape Town: University of Cape Town; 1992. [ Links ]
 Correspondence:
Johan Fourie
Email: johanf@sun.ac.za
Received: 08 Nov. 2024
Revised: 10 Sep. 2025
Accepted: 11 Sep. 2025
Published: 26 Nov. 2025
Editors: Floretta Boonzaier, Leslie Swartz
Funding: Bank of Sweden Tercentenary Foundation (M20-0041)
Supplementary Data
The supplementary data is available in pdf: [Supplementary data]
