


Services on Demand
Article
 English (pdf)
  Article in xml format
 Article references
Indicators

Related links
 Cited by Google
 Similars in Google
Share

 Permalink
Water SA
On-line version ISSN 1816-7950
Print version ISSN 0378-4738
Water SA vol.38 n.1 Pretoria Jan. 2012
Comparison of methods for determining unsaturated hydraulic conductivity in the wet range to evaluate the sensitivity of wetting front detectors
GT AdhanomI; RJ StirzakerI, III,*; SA LorentzII; JG AnnandaleI; JM SteynI
IDept. Plant Production and Soil Science, University of Pretoria, 0001, Pretoria, South Africa
IISchool of Bioresources Engineering and Environmental Hydrology, University of KwaZulu-Natal, X01, Pietermaritzburg, South Africa
IIICSIRO Land and Water, PO BOX 1666, ACT2601, Australia
ABSTRACT
The design of passive lysimeters or wetting front detectors determines the tensions at which they collect a water sample from an unsaturated soil. When deployed in the field to help manage irrigation, it is necessary to know the minimum flux of water that can be sampled by a passive lysimeter and how this relates to the drainage flux at field capacity. This requires a good estimate of the unsaturated hydraulic conductivity characteristic, K (h), in the wet range (< 10 kPa). We compared various field, laboratory and theoretical approaches for obtaining the K (h) function and compared these to a reference K (h) function derived by applying inverse modelling approaches to field drainage experimental data. The Van Genuchten model and three of the pedotransfer models produced K (h) functions with a root mean square error of less than 5% compared to the reference, and appear to be simple methods of obtaining a reasonable estimate of unsaturated hydraulic conductivity. However, despite the goodness of fit, there can be a 10-fold difference in conductivity at a given tension < 10 kPa estimated from the different methods. Moreover, water content at field capacity depends entirely on whether field capacity is defined as time elapsed after saturation, a set tension or a minimum flux.
Keywords: inverse modelling, instantaneous profile method, pedotransfer functions, wetting front detector, field capacity, HYDRUS-2D
Introduction
Irrigation is usually scheduled by measuring or predicting a soil water deficit. Another way to conceptualise the irrigation decision is to cease irrigation when the infiltrating water reaches a set depth in the soil (Zur et al., 1994; Stirzaker, 2003). Stirzaker and Hutchinson (2005) demonstrated the success of using a funnel-shaped wetting front detector (WFD) to irrigate grass by automatically switching off the sprinklers when the infiltrating water reached a depth of 15 cm.
The WFD used in the above study is essentially a passive lysimeter, i.e., it collects a water sample from an unsaturated medium by distorting the downward flow of water. Yet the limitations of passive lysimetry are well documented in the literature, in particular their failure to collect a sample when the flux is low (Gee et al., 2002; Zhu et al., 2002). In the same way, some water could drain past a WFD without a water sample being collected, and therefore give the irrigator incorrect feedback.
If a passive lysimeter or WFD were used to control irrigation, then it would be useful to be able to collect a water sample over the range from saturation to field capacity, since field capacity is usually accepted as the maximum soil storage with negligible drainage. However, field capacity has no universal definition. It is commonly defined in the field as the water remaining in a soil after 48 or 72 h of free drainage following saturation (Soil Science Society of America, 1997). Others have defined field capacity as the time when the water flux falls below 0.1 mm/day (Stegman et al., 1980) or when the absolute change in volumetric soil water content is 0.1 to 0.2% per day (Ratliff et al., 1983), or as a particular soil tension (Romano and Santini, 2002).
The design of a passive lysimeter or WFD determines the soil tension at which it can collect a water sample, which for practical purposes ranges between 3 and 10 kPa (Hutchinson and Bond 2001; Gee et al., 2002; Weihermüller et al., 2007; Stirzaker, 2008). Given the various definitions of field capacity, and the fact that it is highly dependent on soil type (Romano and Santini, 2002), reliable methods of predicting the drainage flux within the 0-10 kPa range of soil tensions would help to choose among various designs of wetting front detectors. However, the relationship between drainage rate and tension is notoriously difficult to determine, since different field, laboratory and theoretical approaches can give very different results (Jones and Wagnet, 1984; Comegna, et al., 1996; Poulsen et al., 2002).
The instantaneous profile method (IPM) has been widely used to determine the hydraulic conductivity as a function of tension, K (h), in the field (Watson, 1966; Hillel et al., 1972; Reichardt et al., 1998) but can result in large errors, particularly at the wet end of the range (Fluhler et al., 1976; Reichardt et al., 1998). Results can be improved by using inverse modelling approaches. Inverse modelling uses the equations governing unsaturated flow to determine soil parameters by minimising the differences between model predictions and observed data, and is believed to give the best estimate of unsaturated hydraulic conductivity (Fristerle and Faybishenko, 1999; Zhang et al., 2003).
A disadvantage of the field IPM and inverse methods is the considerable time and cost they incur in comparison to laboratory tests. The laboratory procedure of Bruce and Klute (1956) is a rapid method for estimating the soil water diffusivity function, D (θ) or the hydraulic conductivity K (h) if water retention data are available. The original method has subsequently been improved by several groups (Clothier et al., 1983; Tyner and Brown, 2004; Prevedello et al., 2008). However, it is difficult to establish steady or transient-state flow conditions under laboratory conditions and the method does not fully represent actual field conditions (Nandagiri and Prasad, 1996).
Given the problems associated with field and laboratory techniques, the use of theoretical approaches has become common. Methods for estimating K (h) functions have been derived from water retention models (Brooks-Corey, 1964; Campbell, 1974; Van Genuchten, 1980) combined with capillary models (Burdine, 1953; Mualem, 1976). These methods predict unsaturated hydraulic conductivity from easily measurable water retention data or basic soil properties such as texture and bulk density.
This paper compares the field IPM method, the laboratory Bruce-Klute method and theoretical models to estimate unsaturated hydraulic conductivity between tensions of 0 and 10 kPa on a Hutton soil type (Soil Classification Working Group, 1991). The application is two-fold. First, we need a way to choose between designs of wetting front detector that could collect a water sample passively at 3, 6 and 9 kPa (Stirzaker et al., 2010). Second, we need to know the simplest method for getting a reasonable estimate of conductivity in the wet range to estimate the fluxes associated with each sensitivity level.
Materials and methods
This paper is structured according to a detailed flow diagram shown in Appendix 1 (Fig. 5) and the list of symbols and equations used in manipulating the data are summarised in Appendix 2 (Table 6, Table 7).
Soil data measurements
In-situ drainage experiment
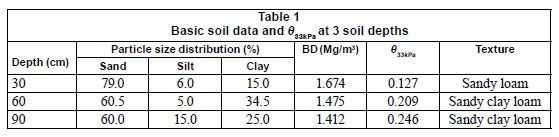
An in-situ drainage experiment was conducted on a 250 x 200 cm levelled plot, located at the University of Pretoria Experimental Farm, Hatfield, South Africa (25º 45';S, 28º 16';E and altitude 1 370 m). Particle size distribution, bulk density and volumetric water content at a tension value of 33 kPa, θ33 kPa, of the site are described in Table 1. The vertical sides of 33kPa the drainage plot were hydrologically isolated from other plots by fibre cement sheets to a depth of 120 cm to prevent lateral water flow. The plot was ponded by applying water in excess of the infiltration rate for about 10 hours until the tensiometer installed at a depth of 90 cm below the soil surface read close to saturation. The surface of the drainage plot was then covered with a plastic sheet to prevent evaporation losses.
Water content was monitored daily to a depth of 120 cm using a site-calibrated neutron probe with a standard error of less than 0.03 cm3/cm3, which is within the acceptable tolerance range (Hignett and Evett, 2002). Tension was recorded with Soilspec tensiometers (SoilSpec Tensiometer System, Model SST101G, NH & TS Electronics, Australia) connected to a HOBO logger (Onset Computer Corporation, MA02532, USA) at 15-min intervals to an accuracy of within ± 0.1 kPa at 30, 60 and 90 cm depths. The drainage measurements were monitored for a total period of 16 days.
Sample preparation and laboratory measurements
On completion of the drainage measurements, disturbed soil samples were obtained for various laboratory tests at depths of 30, 60 and 90 cm. The samples were air-dried and ground to pass a 2 mm sieve. Particle size distribution (PSD) and textural class were determined using the hydrometer method and USDA textural classification, respectively. Dry bulk density (BD) was determined from the core sampler volume (80.5 mm diameter, 105 mm long) and the dry mass of the sampled soil. The θ33kPa was determined from the water retention characteristics of each soil depth.
Water retention characteristics
The drying soil-water retention curve was determined using a multi-step controlled outflow method. Soil samples were packed (metal ring 54 mm diameter and 30 mm height) at field bulk density to measure the water retention characteristics between 0 and 100 kPa tension (Lorentz et al., 2001). When the equilibrium condition for the highest tension applied was obtained, the soil was removed and the final water content of the soil measured by oven drying. This final water content, together with the previous changes in water volume, was used to back-calculate the water contents corresponding to the different tensions.
Saturated hydraulic conductivity
Saturated hydraulic conductivity (K s) was determined on packed soil columns using a constant-head permeameter. This method applies Darcy';s principle to a saturated soil tube of uniform cross-sectional area (Klute, 1965). The tubes (60 mm diameter and 300 mm height) were packed at bulk densities, which varied on average by < 10% of the field bulk density (Table 1). The hydraulic head difference between 2 permea meter ports and the flux measurements from the tube was used to calculate Ks.
Rosetta Pedotransfer Function
A pedotransfer function provides an estimate of the relationship between the soil hydraulic properties and basic soil properties. The Rosetta Pedotransfer Function (PTF) (Schaap et al., 1998; 2001) is a user-friendly computer program that facilitates the use of PTF models to predict soil hydraulic parameters that include residual volumetric water content (θr), saturated volumetric water content (θs), air entry parameter (α), pore size distribution parameter (n) and Ks from basic soil data and θ33kPa. The analyses using Rosetta were performed by entering a combination of predictors based on the level of available information through a text input file for each soil sample. These predictors include 4 levels: (i) Textural class, (ii) %Sand, %Silt, %Clay (SSC), (iii) SSC+Bulk Density (BD), and (iv) SSC+BD+ θ33kPa. Outputs from the Rosetta program includeθr, θs, α, n and Ks.
Bruce-Klute test
A Bruce-Klute imbibition test was performed on a uniformly-packed horizontal tube of soil comprising 10 transparent cells (each cell 20 mm long and 25 mm diameter). Packing was done by compacting 4.0 cm layers with a 20 mm diameter-tamping rod and loosening the soil surface between packing. Dry bulk density was calculated from the tube volume and the dry mass of the packed soil. Porosity was calculated from the dry bulk density of the packed soil and the assumed soil particle density of 2.65 Mg/m3.
The inlet chamber on one end of the tube was connected to the supply flask to establish a zero tension at the centre of the sample. An instantaneous supply of water was applied to the tube from a funnel with an immediate shift to the supply flask as soon as the inlet chamber was filled. The starting time was recorded and the advance of the wetting front observed. The source of water was removed as soon as the wetting front reached the second-last ring and the time was recorded. All the cell rings were quickly sectioned and placed into separate aluminium weighing pans and wet and oven-dry mass were taken in order to determine the water content of each sample.
Data analysis
The instantaneous profile method (IPM)
The measured variables from the field trial were used to obtain hydraulic conductivity as a function of water content or tension using the IPM procedures presented by Reichardt et al. (1998) and the equations presented in Appendix 2. The water content profile, θ(z, t) was smoothed with respect to time for each depth using Eq. (4). A finite difference over a given depth interval was applied to estimate the soil water flux density using Eq. (5). The total hydraulic gradient at 75 cm depth was obtained by dividing the difference in hydraulic heads at depths 60 and 90 cm by the vertical distance between these 2 depths using Eq. (6). Finally, the hydraulic conductivity at 75 cm was determined as the ratio of water flux density, Eq. (5), and total hydraulic gradient, Eq. (6).
The in-situ inverse model
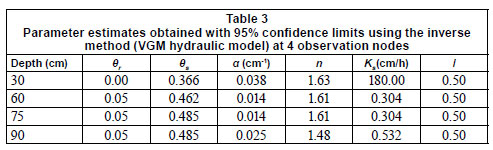
Hydraulic properties were modelled using an inverse parameter estimation process using the HYDRUS-2D model (Šimůnek et al., 1999) that solves the Richards'; equation for 2-dimensional vertical flow using the Van Genuchten (1980) - Mualem (1976) hydraulic model. The profile was divided into 4 soil depth intervals (0-41 cm, 41-77 cm, 77-118 cm and 118-150 cm). The pore connectivity parameter (l) was set to 0.5, and initial estimates of residual and saturated water contents were entered in the data sheet for inverse solution of each depth interval to optimise the 3 soil parameters (n, α and Ks). These parameters were optimised simultaneously for each soil layer.
Four observation nodes at depths of 30, 60, 75 and 90 cm were configured within the flow domain of the profile to simulate the in-situ drainage data. The simulation had no-flow boundary conditions at the soil surface and vertical sides of the profile and a free drainage condition at the bottom of the profile. The initial conditions of each soil depth were set to the in-situ tension values observed at the start of the drainage experiment in the field. The in-situ time series water content and tension data for each observation node at depths 30, 60 and 90 cm and the water content at 75 cm depth were entered into the data sheet for inverse solution in HYDRUS-2D to perform inverse parameter estimation.
The in-situ water contents were lower than those obtained with a multi-step controlled outflow method for similar tension values (data not shown) due to air entrapment during field saturation of the profile (Reynolds and Elrick, 2002). Therefore, the in-situ water contents determined at 30, 60 and 90 cm depths were adjusted to coincide with the corresponding outflow cell retention data. Since there was no retention data at 75 cm, the in-situ water content for this depth was adjusted to the retention data measured at 90 cm below the soil surface.
A draining profile was simulated in HYDRUS-1D using the soil hydraulic properties obtained from the various methods described above. The profile was initially set to 1 kPa tension with a zero flux upper boundary and a free drainage lower boundary condition. Water flow was simulated over a period of 16 days in (i) a uniform soil profile (150 cm depth) described by soil parameters determined at 60 cm depth using the inverse method to explore various definitions of field capacity and (ii) a 2-layered soil profile (0-30 cm and 30-150 cm layers) using field- and laboratory-derived soil parameters to determine the flux at tensions of 3, 6 and 9 kPa at a depth of 60 cm.
Bruce-Klute test
The soil water content profiles were transformed into a Boltzmann variable λ (θ) by dividing the original data by the square root of time. The primary data set of λ (θ) was then fitted with an appropriate function using Eq. (12) and the parameter p in Eq. (14) was obtained during this fitting procedure. The sorptivity, S, in Eq. (14) was calculated as the area under the fitted curve using Eq. (13). The diffusivity function, D (θ) was then determined using the analytical form suggested by Clothier et al. (1983), Eq. (14). This D (θ) function, combined with the outflow data, estimated the hydraulic conductivity as a function of water content, K(θ), Eq. (15). Tension equivalent of the water contents in the K(θ) function were estimated using Eq. (1) to describe the hydraulic conductivity as a function of tension, K(h).
Theoretical methods
The soil parameters estimated from water retention characteristics and the measured Ks for each soil depth were used to predict the K (h) function using Van Genuchten-Mualem (VGM), Eq. (2), Brooks and Corey-Burdine (BCB), Eq. (10) and Campbell, Eq. (8) models. In addition, outputs from the Rosetta program ( θr, θs, n, α and Ks) were used to predict the K(h) function using the VGM model, Eq. (2).
Evaluation procedures
Prediction accuracies of hydraulic conductivities determined based on IPM, Bruce-Klute and theoretical methods were evaluated with respect to the in-situ inverse analysis of the drainage data. The root mean square error (RMSE) presented in Eq. (16) was used to calculate the prediction accuracy of the different methods (Poulsen et al., 2002).
Results and discussion
Figure 1 shows the time series simulated and measured tension and water content data for the field drainage experiment. The simulated tensions and water contents were produced using the VGM hydraulic model.
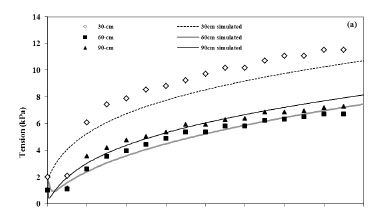
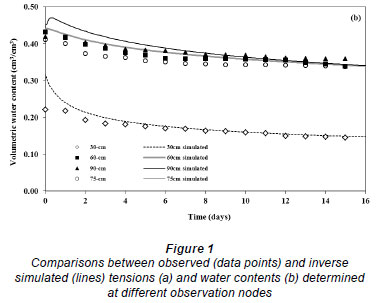
The soil parameters obtained using the VGM model reproduced the measured data well at depths of 60 and 90 cm but not as well at 30 cm (Fig. 1a, b). The model also reproduced the measured water content well at 75 cm (Fig. 1b). The deviations at 30 cm are possibly due to the effect of diurnal surface temperature fluctuations on the performance of the tensiometer (Sisson et al., 2002). The measured water contents also tended to be lower than the simulations, especially in the surface soil where the neutron probe is known to be less accurate. Similar analyses were performed using the BCB and Campbell hydraulic models, which performed adequately at most depths, but not as well as the VGM model overall (Table 2).
The simultaneous use of water content and tension data in the optimisation procedure produced unique parameter estimates ( α, n, and Ks), as judged by a low correlation matrix, i.e. R2 < 0.95, between optimised parameters, consistent with the findings of Zhang et al. (2003). The parameters obtained by inverse modelling of the drainage data at pre-selected depths (60, 75 and 90 cm), are therefore considered as reference values against which the other methods are compared (Table 3).
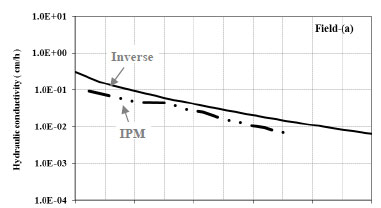
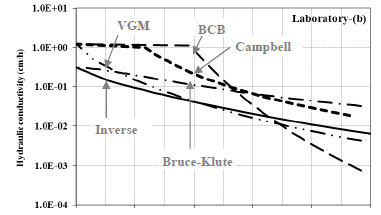
The field-based IPM method produced a K(h) curve slightly below the inverse reference (Fig. 2a). The VGM approach appeared to give the closest fit of the various laboratory-based methods (Fig. 2b). The Campbell and BCB methods overestimated K s values in the wettest part of the range, consistent with the findings by Poulsen et al. (2002), that multi-modal pore-size distribution models are required to predict the unsaturated hydraulic conductivity of undisturbed soils.
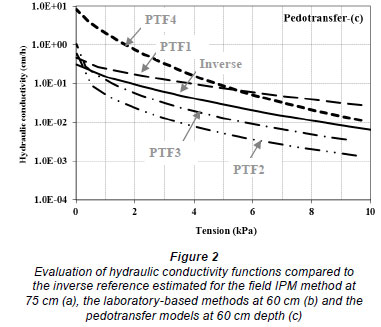
The various pedotransfer models gave K (h) curves that fell above and below the reference inverse method. PTF1 (textural class), PTF2 (SSC%) and PTF3 (SSC%+BD) were clearly superior to the PTF4 model, which included θ33kPa (Fig. 2c). The poor fit of the PTF4 model is most likely due to underestimation of the field capacity of the soil, i.e. water content at a tension value of 33 kPa was too dry to represent the field capacity of this soil.
The performance of the field, laboratory and theoretical approaches were examined statistically by comparing their results with the inverse method (Table 4). This analysis shows that the VGM model and IPM field method predicted the reference K (h) with lowest error. Three of the four pedotransfer models also displayed good prediction accuracy, followed by the Bruce-Klute test. The Campbell and BCB models showed considerable deviation from the inverse K (h) results over the 0 to 10 kPa range. Given the small amount of input data required for the VGM model and the pedotransfer functions, these methods would seem an acceptable substitute for the more laborious field IPM and inverse approaches.
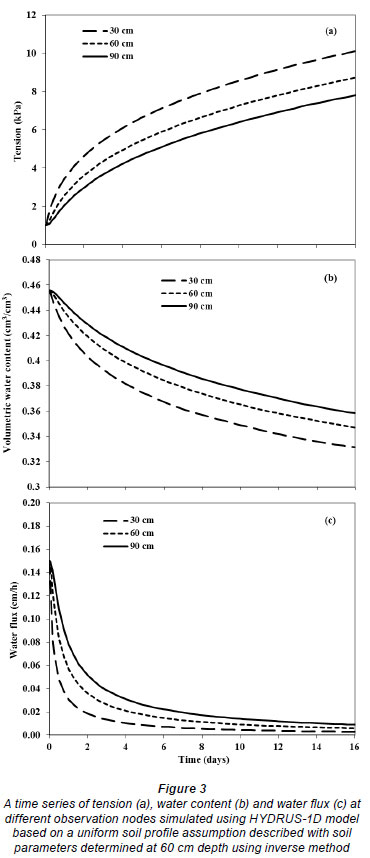
Despite the apparent suitability of the simpler K (h) methods, there remain 2 dilemmas when it comes to choosing the sensitivity of a wetting front detector. The first dilemma is the difficulty in choosing a value for field capacity. Figure 3 uses the HYDRUS model and the hydraulic parameters from the inverse data at 60 cm depth to show a time-series of tension, water content and flux. Two days after the start of drainage at a depth of 30 cm the tension was 5 kPa, the absolute water content change 1.8% per day and the flux 0.02 cm/h. The corresponding values at 90 cm depth were 3 kPa, 1.3% per day and 0.05 cm/h. Even 4 days after the start of the simulation, the drainage flux was 0.03 cm/h. These values show that none of the field capacity definitions had been reached.
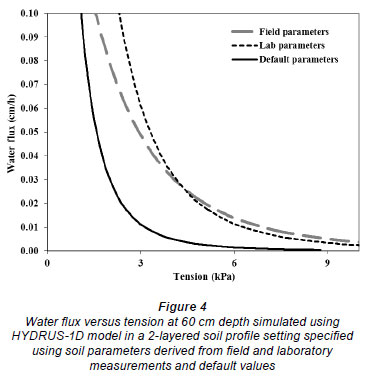
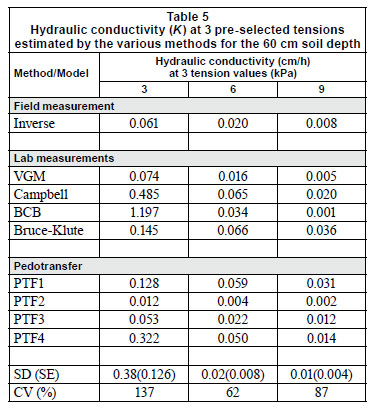
The second dilemma relates to the large variability between the various K (h) estimation methods in the wet range (Table 5). Predicted hydraulic conductivity values are shown for the 3, 6 and 9 kPa sensitivity level of wetting front detector used by Stirzaker et al. (2010). There is, for example, a coefficient of variability of 137% at a tension value of 3 kPa. The point is further illustrated in Fig. 4 where a 2-layer drain ing profile is simulated in the HYDRUS model using (i) the field hydraulic properties derived from the inverse method, (ii) the laboratory parameters derived using the Van Genuchten approach, and (iii) default hydraulic properties from the HYDRUS model based on soil texture. In this case the field and laboratory values show a 4-fold higher simulated drainage than that obtained using the model default properties based on texture.
This confirms other experimental observations reported by Reichardt et al. (1998), Jones and Wagnet (1984) and Fluhler et al. (1976). Even among methods that show low RMSE, there can be a large difference in conductivity at a given tension. This means that there will always be considerable uncertainty in specifying the minimum flux of water that could be detected by various designs of wetting front detector.
Conclusions
Ideally a wetting front detector would be able to collect a water sample from a draining profile until field capacity was reached. In practice, field capacity is hard to define. Ultimately the sensitivity of a wetting front detector depends on how it is going to be used. The less sensitive funnel-shaped version used by Stirzaker and Hutchinson (2005) is suited to shallower placements and will record the early stages of redistribution. The tube-shaped designs used by Hutchinson and Bond (2001) and Stirzaker (2008), which record much lower fluxes, can be deployed deeper in the soil profile and would collect a water sample for many days after saturation.
The evaluation of different methods for determining unsaturated hydraulic conductivity was based on the assumption that the inverse analysis of the field drainage data provides a reference K (h) function. The VGM model and three of the pedotransfer models produced K (h) functions with an RMSE of less than 5% compared to the reference, and would appear to be simple methods of obtaining a reasonable estimate of unsaturated conductivity. However, the hydraulic conductivities estimated by the different methods were highly variable, particularly at the wetter end of the tension range, so flux calculations are likely to contain large uncertainties.
Acknowledgement
Funding for this research was provided by the Water Research Commission (WRC), South Africa, as part of the WRC research project entitled 'Adapting the wetting front detector to the needs of small-scale furrow irrigators and providing a basis for the interpretation of salt and nutrient measurements from the water sample'.
References
BROOKS RH and COREY TA (1964) Hydraulic properties of porous media. Hydrol. Pap. 3 1-27. [ Links ]
BRUCE RR and KLUTE A (1956) The measurement of soil diffusiv ity. Soil Sci. Soc. Am. Proc. 20 458-462. [ Links ]
BURDINE NT (1953) Relative permeability calculations from pore- size distribution data. J. AIME 198 71-77. [ Links ]
CAMPBELL GS (1974) A simple method for determining unsaturated conductivity from moisture retention data. Soil Sci. 117 311-314. [ Links ]
CLOTHIER BE, SCOTTER DR and GREEN AE (1983) Diffusivity and one-dimensional absorption experiment. Soil Sci. Soc. Am. J. 47 641-644. [ Links ]
COMEGNA V, DAMIANI P, D';ANNA F and RUGGIERO C (1996) Comparisons of field methods for determining the hydraulic conductivity curve of a volcanic vesuvian soil. Geoderma 73 231-244. [ Links ]
FINSTERLE S and FAYBISHENKO B (1999) Inverse modeling of a radial multistep outflow experiment for determining unsaturated hydraulic properties. Water Resour. Res. 22 431-444. [ Links ]
FLUHLER H, ARDAKANI MS and STOLZY LH (1976) Error propagation in determining hydraulic conductivities from successive water content and tension profiles. Soil Sci. Soc. Am. J. 40 830-836. [ Links ]
GEE GW, WARD AL, CALDWELL TG and RITTER JC (2002) A vadose zone water fluxmeter with divergence control. Water Resour. Res. 38. doi: 10.1029/2001WR00816. [ Links ]
HIGNETT C and EVETT SR (2002) Neutron Thermalization. In: Dane JH and Top GC (eds.) Methods of Soil Analysis. Part 4: Physical Methods (2nd edn.). SSSA, Madison, WI. 501-521. [ Links ]
HILLEL D, KRENTOS VD and STYLIANOU Y (1972) Procedure and test of an internal drainage method for measuring soil hydrau lic characteristics in-situ. Soil Sci. 114 395-400. [ Links ]
HUTCHINSON PA and BOND WJ (2001) Routine measurement of the soil water potential gradient near saturation using a pair of tube tensiometers. Aust. J. Soil Res. 39 1147-1156. [ Links ]
JONES AJ and WAGENET RJ (1984) In situ estimation of hydraulic conductivity using simplified methods. Water Resour. Res. 20 (11) 1620-1626. [ Links ]
KLUTE A (1965) Laboratory measurement of hydraulic conductivity of saturated soil. In: Black CA (ed.) Methods of Soil Analysis. Part 1. 210-221. [ Links ]
KLUTE A (1952) Some theoretical aspects of the flow of water in unsaturated soils. Soil. Sci. Soc. Proc. 16 144-148. [ Links ]
LORENTZ S, GOBA P and PRETORIUS J (2001) Hydrological processes research: Experiments and measurements of soil hydrau lic characteristics. WRC Report No. K5/744. Water Research Commission, Pretoria, South Africa. [ Links ]
MUALEM Y (1976) A new model for predicting the hydraulic conductivity of unsaturated porous media. Water Resour. Res. 12 513-520. [ Links ]
NANDAGIRI L and PRASAD R (1996) Field evaluation of unsaturated hydraulic conductivity models and parameter estimation from retention data. J. Hydrol. 179 197-205. [ Links ]
POULSEN TG, MOLDRUP P, IVERSEN BV and JACOBSEN OH (2002) Three-region Campbell model for unsaturated hydraulic conductivity in undisturbed soils. Soil Sci. Soc. Am. J. 66 744-752. [ Links ]
PREVEDELLO CL, LOYOLA JMT, REICHARDT K and NIElSEN DR (2008) New analytical solution of Boltzmann transform for horizontal water infiltration into sand. Vadose Zone J. 7 1170-1177. [ Links ]
RATLIFF LF, RITCHIE JT and CASSEL DK (1983) Field measured limits of soil water availability as related to laboratory measured properties. Soil Sci. Soc. Am. J. 47 770-775. [ Links ]
REICHARDT K, PORTETAN-FILHO O, LIBARDI PL, BACCHI OOS, MORAES SO, OLIVERIA JCM and FALLERIOS MC (1998) Critical analysis of the field determination of soil hydraulic conductivity functions using the flux-gradient approach. Soil Tillage Res. 48 81-89. [ Links ]
REYNOLDS WD and ELRICK DE (2002) Principles and Parameter Definitions. In: Dane JH and Top GC (ed.) Methods of Soil Analysis. Part 4: Physical Methods (2nd edn.). SSSA, Madison, WI. 797-801. [ Links ]
ROMANO N and SANTINI A (2002) Field test. In: Dane JH and Top GC (ed.) Methods of Soil Analysis. Part 4: Physical Methods (2nd edn.). SSSA, Madison, WI. 725-727. [ Links ]
SCHAAP MG, LEIJ FJ and VAN GENUCHTEN MTH (1998) Neural network analysis for hierarchical prediction of soil water retention and saturated hydraulic conductivity. Soil Sci. Soc. Am. J. 62 847-855. [ Links ]
SCHAAP MG, LEIJ FJ and VAN GENUCHTEN MTH (2001) Rosetta: A computer program for estimating soil hydraulic parameters with hierarchical pedotransfer functions. Soil Sci. Soc. Am. J. 251 352-361. [ Links ]
ŠIMŮNEK J, SEJNA M and VAN GENUCTHEN MTH (1999) The Hydrus-2D software package for simulating two-dimensional movement of water, heat and multiple solutes in variably saturated media. Version 2.0. IGWMC-TPS-53. Colorado School of Mines, Golden. [ Links ]
SISSON JB, GEE GW, HUBBELL JM, BRATTON WL, RITTER JC, WARD AL and CALDWELL TG (2002) Advances in tensiometery for long-term monitoring of soil water pressures. Vadose Zone J. 1 310-315. [ Links ]
SOIL CLASSIFICATION WORKING GROUP (1991) Soil Classification: A taxonomic System for South Africa. Department of Agricultural Development, Pretoria. [ Links ]
SOIL SCIENCE SOCIETY OF AMERICA (1997) Glossary of Soil Science Terms. SSSA, Madison, WI. [ Links ]
STEGMAN EC, MUSICK JT and STEWART JL (1980) Irrigation water management. In: Jensen ME (ed.) Design and Operation of Farm Irrigation System. ASAE, St. Joseph, MI. 763-816. [ Links ]
STIRZAKER RJ (2003) When to turn the water off: Scheduling micro-irrigation with a wetting front detector. Irrig. Sci. 22 177-185. [ Links ]
STIRZAKER RJ (2008) Factors affecting sensitivity of wetting front detectors. In: Goodwin I and O';Connell MG (eds.) Proc. Fifth International Symposium on Irrigation of Horticultural Crops. Acta Horticult. 792 647-654. [ Links ]
STIRZAKER RJ and HUTCHINSON PA (2005) Irrigation controlled by a wetting front detector: field evaluation under sprinkler irrigation. Aust. J. Soil Res. 43 935-943. [ Links ]
STIRZAKER RJ, STEYN JM, ANNANDALE JG, ADHANOM GT, VAN DER LAAN M and M';MARETE CM (2010) Adapting the wetting front detector to small scale furrow irrigation and providing a basis for the interpretation of salt and nutrient meas urements from the water sample. WRC Report No.1574/1/10. Water Research Commission, Pretoria, South Africa. [ Links ]
TYNER JS and BROWN GO (2004) Improvements to estimating unsaturated soil properties from horizontal infiltration. Soil Sci. Soc. Am. J. 68 1-6. [ Links ]
VAN GENUCHTEN MTH (1980) A closed-form equation for predicting the hydraulic conductivity of unsaturated soils. Soil Sci. Soc. Am. J. 44 892-898. [ Links ]
WATSON K (1966) An instantaneous profile method for determining the hydraulic conductivity of unsaturated porous materials. Water Resour. Res. 2 709-715. [ Links ]
WEIHERMüLLER L, SIEMENS J, DEURER M, KNOBLAUCH S, RUPP H, GÖTTLEIN A and PΫTZ T (2007) In situ soil water extraction: A review. J. Environ. Qual. 36 1735-1748. [ Links ]
ZHANG ZF, ANDY L and GEE GW (2003) Estimating soil hydraulic parameters of a field drainage experiment using inverse techniques. Vadose Zone J. 2 201-211. [ Links ]
ZHU Y, FOX RH and TOTH JD (2002) Leachate Collection Efficiency of Zero-tension Pan and Passive Capillary Fiberglass Wick lysimeters. Soil Sci. Soc. Am. J. 66 37-43. [ Links ]
ZUR B, BEN-HANAN U and YARDENI A (1994) Control of irrigation amounts using velocity and position of wetting front. Irrig. Sci. 14 207-212. [ Links ]
Received 15 December 2010; accepted in revised form 14 December 2011.
* To whom all correspondence should be addressed. +61-2-6246 5570; e-mail: Richard.Stirzaker@csiro.au
Appendix 1
Flow chart describing materials and methods presented in this paper

Appendix 2
Lists of symbols and definitions and equations


