


Services on Demand
Article
 English (pdf)
  Article in xml format
 Article references
Indicators

Related links
 Cited by Google
 Similars in Google
Share

 Permalink
Water SA
On-line version ISSN 1816-7950
Print version ISSN 0378-4738
Water SA vol.38 n.1 Pretoria Jan. 2012
A comparative assessment of chemical contaminant removal by three household water treatment filters
Themba O MahlanguI; Bhekie B MambaI,*; Maggie NB MombaII
IDepartment of Chemical Technology, University of Johannesburg, PO Box 17011, Doornfontein 2028, South Africa
IIDepartment of Environmental, Water and Earth Science, Tshwane University of Technology, Arcadia Campus, Private Bag X680, Pretoria 0001, South Africa
ABSTRACT
This study was aimed at modifying the design of, constructing, evaluating and comparing chemical contaminant removal efficiency by, 3 household water treatment filters. The filters were: 1) biosand filter (BSF); 2) the ceramic candle filter (CCF); 3) bucket filter (BF). The filters were evaluated for their efficiency in removal of calcium, magnesium, iron and arsenic, nitrates, phosphates, fluorides, total organic carbon and turbidity, by determining levels of these contaminants in water before and after filtration through the filters. The effects of chlorophyll a concentration (mg/m3) of intake water, as well as the effects of turbidity of intake water, on the flow rates of the filters was quantified and recommendations on the quality of water that could be filtered through these filters were made. Chlorophyll a concentrations in intake water had a positive correlation with the turbidity of the unfiltered water (r = 0.607).The flow rates of the filters were 0.8 ℓ/h - 6.48 ℓ/h (BSF), 0.05 ℓ/h - 2.495 ℓ/h (CCF) and 106.5 ℓ/h - 160.5 ℓ/h (BF). Because of the large particle size materials used in constructing the BF and the design, which caused it to be a rapid sand filter, the biosand filter (BF) was found to have flow rates significantly higher than those of BSF and CCF (p > 0.05). There was no difference in the efficiency of removal of metals (average 40% - 50%) by the filters (p > 0.05), as the same removal mechanisms (straining, ammonification, fixation and adsorption) were believed to be taking place in all of the filters. The CCF removed total organic carbon (TOC) (up to 39%) better than the BSF and BF (p < 0.05). The filters removed turbidity effectively with the BSF having the highest reduction (70%). The average turbidity reduction efficiency was in the order BSF (70%) > BF (51%) > CCF (44%). The BSF, CCF and BF reduced turbidity and other contaminants even after filtering a total cumulative volume greater than 1 000 ℓ.
Keywords: Biosand filter, bucket filter, ceramic candle filter, flow rate, chlorophyll a.
Introduction
There are a vast number of problems associated with industrialisation, which include high water pollution rates and lack of adequate potable water, (Wang et al., 2010). Water is contaminated with various compounds which pose health risks when they are excessively ingested by humans. Some pollutants have aesthetic problems rather than health issues. Amongst the vast number of pollutants that may be determined in water are arsenic, iron, calcium, magnesium, fluorides, phosphates, nitrates and total organic carbon. A list of the diseases that may be caused by excessive intake of these contaminants includes, but is not limited to, infantile methaemoglobinaemia, miscarriages and infant cyanosis (nitrates) (Bailey et al., 1986); coronary heart diseases (iron); arsenicosis (arsenic) (Gregor and Marsalek, 2004); bone damage, lesions of the thyroid, endocrine glands and brain (fluorides) (Chem et al., 2006); diarrhoea, hypotension and cardiac arrest (magnesium) (Shills et al., 2006) and vascular and soft tissue calcification, hypercalciuria and kidney stones (calcium) (Jackson et al., 2006). Water-related diseases have been reported to claim about 2.5 billion lives annually and the lives of approximately 6 000 children daily from diarrhoea (WHO/UNICEF, 2006). Phosphates stimulate the growth of toxic cyanobacteria in water (Kamiyango et al., 2009). There is therefore a need to remove these contaminants to levels below the recommended limits. Advanced treatment methods have been developed to treat microbial and chemical contaminants from polluted water. These treatment methods include ozonation, deep bed filtration, depth filtration, membrane filtration, UV light and reverse osmosis (Noubactep and Care, 2010). The drawback with these methods is that they are expensive and thus cannot be afforded by low-income rural people. Therefore there is a need for the design of cost-effective household water treatment systems (HWTS) and this is one of the main objectives of this work. The design of the filters should take into account safe storage of the filtered water since treated water can be re-contaminated during transportation and storage (Clasen and Bastable, 2003). There are a number of HWTS that are already available to the market, which includes ceramic candle filters (CCF), some of which are based on diatomaceous earth, slow sand filters (SSF), porous pot filters, SONO filters and bucket filters (Ahamed et al., 2009). A lot of research has been done in evaluating their efficiency in removing microbial contaminants, but there is still a lack of data on their performance in removing chemical contaminants which may also be present in drinking water at high levels and hence compromise human health. For example, Van Halem et al. (2009) evaluated the performance of the silver-impregnated ceramic pot filter in removing bacteria. This study presents results for the performance of 3 HWTS in removing chemical contaminants from drinking water. The filters were the biosand filter (BSF), the ceramic candle filter (CCF) and the bucket filter (BF).
Description of filters
Biosand filters (Fig. 1A) are conventional slow sand filters which function with the aid of gravity. The design of a biosand filter comprises a concrete-coated metal mould filled partially with one layer each of large gravel, small gravel, and clean medium-grade sand. A diffuser plate is placed on top of the sand and water is poured into the remaining space. Prior to use, the filter is filled with water each day for 2 to 3 weeks until a biological layer of bacteria-depleting microorganisms resembling dirt develops on the surface of the sand (Huisman and Wood, 1974). These microorganisms consume disease-causing viruses, bacteria, and parasites, while the sand traps organic matter and particles. Biosand filters have been shown to remove 76 to 91% of arsenic; reducing it to acceptable concentrations (Sharma, 2005).
Ceramic filtration has been reported to be one of the most popular methods of water treatment at household level (Mwabi et al., 2011). There are different types of ceramic filters which include ceramic candles and ceramic pot filters. Ceramic candle filters (Fig. 1B) are made from clays or diatomaceous earth (diatomite) mixed with sawdust or flour (combustible materials) to form a homogeneous mixture which is passed into shape using a mould. Fine pores for water to pass are retained after the filter is fired in an oven. Ceramic candle filters have micro-pores ranging from 0.1 µm to 10 µm and are effective at removing bacteria (Franz, 2004). Biological and physical processes are the main processes that occur during pathogen and turbidity reduction. Ceramic candle filters have been found to be effective in removing 83% - 99% turbidity (Brown and Sobsey, 2006; Van Halem, 2006), > 90% iron (Van Halem, 2006), 98% - 100% bacteria (Brown and Sobsey, 2006; Lantagne, 2001), 19% - 100% viruses (Low, 2002), 100% protozoa (Smith, 2004) and 100% helminths (Smith, 2004) from contaminated water.
The bucket filter (Fig.1C) is a fast or rapid sand filter that is used mostly by municipalities in water treatment (EPA, 1990). Coarse sand and fine sand is used in the construction of fast sand filters (FSF) and these types of filters are gravity driven. Fast sand filters require frequent cleaning by back-washing. Fast sand filters have flow rates over 100 ℓ/h and these flow rates are not affected by the turbidity of the intake water (EPA, 1990). These filters do not have disinfection capabilities during the filtration process since they do not remove bacteria and other microbial contaminants; colour and odour reduction by FSF is also low (Spellman, 2008).
The BSF and CCF have been extensively evaluated for microbial contaminant removal in most countries but, to the best our knowledge, there is no evidence of their evaluation for chemical contaminant removal. These filters have not been tested in South African rural areas (SARA) to ascertain if they could be a solution for both chemical and microbial contaminant removal from drinking water. This study reports results on the removal efficiency by 3 filters (BSF, CCF and BF) for chemical contaminants. The choice of BSF, CCF and BF was based on selection criteria that included cost-effectiveness, and ease of construction, operation and maintenance of the filter devices. The availability of construction materials for these filters in SARA was considered to be an important factor.
This work focused on comparing the BSF to BF (slow sand filter with biological layer vs. fast sand filter without a biological layer) and both the BSF and BF (sand filters) to CCF (clay) for the removal of chemical species from different water sources, relative to water flow in all of the filters. Surface water and groundwater with low and high turbidity was filtered with the purpose of evaluating the effects of turbidity (which vary with water sources) and chlorophyll a concentrations on the flow rates of the filters.
This study was aimed at constructing cost-effective household water treatment systems for chemical contaminant removal in SARA. The main objectives of the study were to evaluate the following:
• Efficiency of removal of calcium, iron, magnesium and arsenic, total organic carbon (TOC), nitrates, phosphates and fluorides from contaminated water
• Determination of the flow rates of the filters to determine whether these were within the recommended limits of 54 ℓ/h for biosand filters (Elliot et al., 2008) and 1 ℓ/h - 3 ℓ/h for ceramic candle filters (Franz, 2004). These limits have been found to be sufficient to provide adequate drinking water for a 6-member family.
• Determine if the filters can remove suspended particles (turbidity) from contaminated water and evaluate the effects of turbidity on the flow rates of the filters
• Investigation of the effects of chlorophyll a on the flow rates of the filters so that necessary recommendations may be made on the type of water that could be filtered through the filters without causing a significant decrease in filter flow rates.
Methodology
Construction of filters
BSF
The biosand filter (Fig. 2A) was made in the workshop of the Tshwane University of Technology, Pretoria, South Africa, with minor modifications based on guidelines given in the literature (CAWST, 2008). A plastic bucket (cheap and readily available in South African supermarkets) was used as a filter house instead of concrete so that the filter could be cost- effective. The BSF consisted of 6 discrete zones (inlet, standing water, biolayer, biological layer, fine sand and gravel zone) which play an important role in the filtration process. Briefly the filter was made as follows: A hole (to fit a spigot) was drilled 25 cm from the base of a 25 ℓ bucket (Fig. 2A) and a spigot was fitted into the hole (Fig. 2B). Clear tubes were cut and connected to each other and the spigot using insert elbows (Fig. 2C). The bucket was then packed with gravel, coarse sand and fine sand (Fig. 2 D - F). Thin tubes (10 cm long) were inserted on top of the fine sand (Fig. 2F) to support a diffusion plate (Fig. 2G). The diffusion plate (which entraps suspended particles (Barnes, 2009)) was made by cutting the edge of the lid until it fitted into the bucket. Holes on the diffusion plate were drilled using a drill.
CCF
The ceramic candle filter was obtained from Just Water, South Africa. A 25 ℓ bucket was stacked on another (Fig. 3A) and a hole was drilled from the base of the top bucket through the lid of the bottom bucket (serves as collection vessel). The filter was fitted into the 2 buckets using screws (Fig. 3B) and was capped with a cloth (Fig. 3C). The cloth traps large particle-size suspended sediments such as grass and leaves and prevents the filter from clogging.
BF
The bucket filter is a fast sand filter and consists of 2 buckets like the CCF. The top bucket contains the filter media and the bottom bucket serves as a collection vessel. A hole was drilled 5 cm from the base of a 25 ℓ bucket (Fig. 4A) and a spigot was fitted. The collection bucket was fitted with a spigot that was placed as low as possible at the base. The base of the top bucket was perforated using a 2 mm drill bit through the lid of the collection bucket (Fig. 4B - C). The seal between the lid and the bottom of the top bucket was ensured using PVC glue (Fig. 4D). The top bucket was then filled with filter media which comprised 2 layers. The first layer was unmodified gravel with particle size of 5 mm - 7 mm while the second layer was unmodified fine sand of particle size 0.95 mm. The gravel layer thickness was 5 cm and the fine sand layer thickness was 20 cm.
Sample collection
Water samples were collected from 4 different sites in 3 provinces of South Africa. Surface low-turbidity water (SWL) was sourced from the Apies River (Gauteng Province), groundwater of low-turbidity (GWL) was sourced from Delmas (Mpumalanga Province), surface high-turbidity water (SWH) was sourced from Hartbeespoort Dam (North West Province) and groundwater with high turbidity (GWH) was sourced from Wallmannsthal (Mpumalanga Province). Collected water samples were stored in 50 ℓ containers and immediately transported to the laboratory where filtration and all analyses were performed. Sample collection was performed 6 times from each sampling site.
Filtration and flow rate determination
Filtration was done upon arrival in the laboratory and lasted for 3 h. Contaminated water (20 ℓ) was passed through the filters and allowed to collect in the collection vessels for 1 h after which (first-hour';s collection) analysis was done. The collection vessel was allowed to collect filtered water again for an additional hour after which the filtered water was analysed (second-hour collection). The third-hour collection was obtained in the same manner as the first- and second-hour collections. Collecting water at 3 different times (i.e. 1 h, 2 h and 3 h of filter run) was done in order to quantify if there was a difference in the performance of filters with time so that recommendations (if there are differences in the hourly performance) may be made regarding collections which may serve for drinking and cooking. Filtration was done 4 times in a week (skipping 1 day after filtration) for a period of about 15 weeks.
Multiple flow rate tests were performed at the time of collecting filtered water at each hour of filter run, by measuring the volumes of collected water at each hour of filter run for BSF and CCF. The flow rates (ℓ/h) were expressed as the volume of filtered water (ℓ) divided by the time taken to filter (h). Upon measuring the flow rate, it was noted that the flow rate of the BF was high and filtered water was collected before an hour had lapsed. The flow rate (BF) was then determined by measuring the volume of water collected in 1 min (mℓ/min) and this was converted to ℓ/h.
Turbidity testing
Turbidity tests were performed on all environmental water samples filtered through the filters. All turbidity values are reported in nephelometric turbidity units (NTU). A Cyber-Scan NTU-100 turbidity meter was used for all turbidity analysis. Clear vials were filled to the mark with water samples to be tested. The vials were then inserted into the turbidimeter slot and a black cap was placed on top of the slot to cover the vial and ensure there was no light entering externally. Triplicate readings of each sample were taken for statistical evaluation. The same turbidity determination method was applied for the evaluation of turbidity in unfiltered water. Turbidity reduction by the filters was obtained by comparing turbidity of unfiltered water with that of filtered water.
Removal of chemical contaminants
Standard methods were followed in the analysis of all chemical contaminants. A Varian 220 FS was used for calcium, magnesium, iron and arsenic analysis. The support gas for calcium and arsenic analysis was nitrous oxide. The ion selective electrode method (APHA, 1995) was adopted for the analysis of fluorides and the fluoride electrode was utilised together with a Metrohm 713 pH meter for the analysis. A SPEKOL 1300 was employed for nitrates, phosphates and chlorophyll a analysis and standard methods (APHA, 1995) were followed when preparing samples for analysis. Total organic carbon (TOC) was analysed using a TOC combustion analyser (Tekmar Dohrmann Apollo 9000).
Statistical analysis
All statistical analyses were performed using Stata V10 (Tshwane University of Technology, Research Innovations). Statistical analysis of chemical contaminant data was carried out on the removal efficiency for chemical contaminants (%) and interpretation of results was performed at the 95% confidence limit. One-way analysis of variance was used to compare more than 2 groups (e.g. comparing the flow rates (ℓ/h) of BSF to CCF). Correlation between chlorophyll a and filter flow rates and/or turbidity was also determined using the Pearson correlation test.
Results and discussion
Flow rates
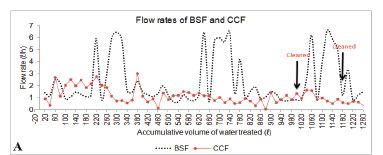
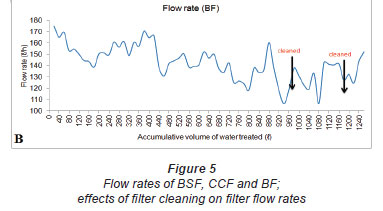
Figure 5 shows the recorded flow rates for the 3 filters. During the course of the study, the filters had flow rates between 0.8 ℓ/h and 6.48 ℓ/h (BSF) (Fig. 5A), 0.05 ℓ/h and 2.495 ℓ/h (CCF) (Fig. 5A) and 106.5 ℓ/h and 160.5 ℓ/h (BF) (Fig. 5B). The flow rates depended on the water head and were high when the filters were filled with water. The flow rates of the BF were higher because the particle size of the filter media (sand) was larger than the particle size of the filter media of the BSF. This is in agreement with a study by Elliot et al. (2008) who stated that flow rate of filters is determined by the particle size of the filter media. The design of the BSF also ensures that the flow rate of the filter remains minimal, to ensure enough contact time between the media and contaminated water. Standard biosand filters have flow rates of up to 54 ℓ/h (Elliot et al., 2008). The flow rate of our biosand filter was lower than the flow rates of standard biosand filters. This may be as a result of the smaller size of the filter and the very fine sand particles (0.15 mm) used in this study, compared to 0.7 mm for standard biosand filters (CAWST, 2008). The most important differences between the BSF and standard BSFs were in terms of the materials used for construction, size of the filter and the particle size of the media. Ceramic candle filters generally have flow rates between 1 ℓ/h and 3 ℓ/h (Franz, 2004) and these flow rates have been found by Shafiquzzaman et al. (2010) to be sufficient for the production of drinking and cooking water for a family of 6 members. The flow rate of our CCF was between 0.05 ℓ/h and 2.495 ℓ/h (Fig. 5A). The filters were ordered in terms of flow rateas follows: BF > BSF > CCF (p = 0.000). The flow rates of the filters were noticed to be higher when the filters were filled with water to be filtered and decreased with a decrease in the volume of water in the filter, accounted for by the drop in hydrostatic pressure. The flow rates of the filters were observed to decrease as the volume of water which had been filtered increased and this could be as a result of persistent clogging each time the filter was used. Accumulation of microorganisms on the surface as biofilm, and accumulation of organic and inorganic particulate matter resulted in sealing of the surface of the filters (Bouwer et al., 2000). Accumulated matter on the upper sand layer of the BSF and BF is believed to have undergone humification and to have gradually clogged the pore space of the sand, hence reducing the permeability of the filter (Siegrist and Boyle, 1987). Clogging of the BF was delayed, possibly because of the larger sand bed and the larger particle size of the filter media (Achak et al., 2009). Filter cleaning was observed to result in an increase in the flow rates of the filters (Fig. 5A-B) as the finer particles resulting in clogging were removed when the sand was washed. Although the filters'; flow rates decreased with increasing volume of intake water or clogging, the BF provided high flow rates for a longer period.
Turbidity
There was high turbidity reduction by the filters (Fig. 6) on filtering water with low and high turbidity (1.47 NTU - 42.93 NTU). There was, on average, 70%, 44% and 51% turbidity reduction by BSF, CCF and BF (Fig. 6), respectively. Biosand and ceramic candle filters have been reported to greatly reduce up to 90% turbidity in contaminated water (Brown and Sobsey, 2006; Van Halem, 2006). Turbidity reduction by the filters was 19% - 98% (BSF), 5% - 99% (CCF) and 4% - 93% (BF). The higher turbidity reduction (through physical retention) by the BSF compared to CCF and BF could be due to the smaller particle-size sand (0.15 mm) which was used as the filter media that covered the largest area of the filter house. The lower turbidity reduction by BF compared to the BSF and CCF could be accounted for by the large particle-size sand (0.95 mm) used as the filter media in the construction of the BF. There was a significant difference in overall turbidity reduction between BSF and CCF (p = 0.01), BSF and BF (p = 0.04), but there was equal removal of turbidity by CCF and BF (p = 0.41). The filters were ordered in terms of turbidity reduction as follows:BSF (70%) > BF (51%) > CCF (44%); however, taking only statistically significant differences in turbidity reduction into account the order was BSF > BF = CCF. Out of 72 samples analysed after treatment, 33 samples (46%) had turbidity below the recommended limit of less than 1 NTU (SANS 241, 2006). Only 18 (25%) out of 72 samples filtered through the CCF had turbidity readings below the SANS. 241 (2006) limit. Only 29% (21 samples) of the 72 samples filtered through the BF had turbidity readings less than 1 NTU.
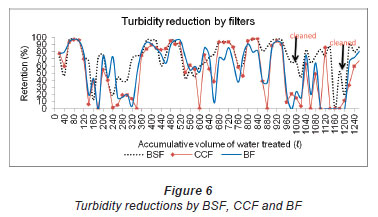
Washing of the filter media of the BSF and BF and the candle filter of the CCF resulted in a slight decrease in turbidity reductions by the filters as a result of the removal of particles that clogged the filter. Turbidity reduction by filters is enhanced by clogging of the filter pores, due to adsorption, attachment and sedimentation of particles (Mahmood et al., 2011). It may not be generalised that the decrease in turbidity reduction by the filters was due to filter washing solely, because the source water filtered before and after washing were different. Generally the turbidity of the filtered water in the third hour (BSF and CCF) and sixth minute (BF) of filter run were high compared to the turbidity of the first- and second-hour collections. This might be due to particles being concentrated in a smaller volume as the flow rates of the filters were lowest in the third hour (BSF and CCF) and sixth minute (BF) of filter run. Since the spigot of the collection vessel of the CCF was closed during the filtration process and opened at the end of each hour when water was taken for analysis, it was assumed that particles were trapped in the spigot and released when it was opened, hence, an overall increase in the turbidity of the water with time of filter run occurred.
Chemical contaminant removal
Figure 7 shows the average reductions of contaminants from contaminated water, for the 3 filters.

Results showed that there was an average of 40%, 48% and 46% calcium reduction by BSF, CCF and BF on filtration of environmental water. The highest calcium reduction efficiency achieved by the filters was 93% (BSF), 99% (CCF) and 91% (BF) (Fig. 7A). Statistical results showed that there was no difference in the hourly removal of calcium by the BSF (p = 0.96), CCF (p = 0.715) and BF (p = 0.948) hence filtrate can be collected at any time of filter run for various purposes such as drinking and cooking. Calcium reduction by the filters was compared and results indicated equal calcium removal by the BSF and CCF (p = 0.282), BSF and BF (p = 0.411) and CCF and BF (p = 0.708). This means that any of the filters could be used for calcium removal from contaminated water but none produces water with calcium concentrations below the SANS, 241 (2006) limit. The mechanism of calcium reduction by the filters is not understood, but Modin et al. (2011) predicted removal of metals (through sorption processes) by activated carbon and this could explain calcium removal by the CCF.
The BSF, CCF and BF were able to achieve 50% reduction of magnesium (Fig. 7B). The average removal efficiency by the filters was 54% (BSF), 50% (CCF) and 51% (BF) and results showed that there was no significant difference in the removal efficiency between the filters (p > 0.05). The performance of the filters in removing magnesium could be expressed as BSF = CCF = BF. During the course of the study, magnesium reduction > 90% was achieved by the filters (Fig. 7B).
There was greater removal of iron by the filters as removal efficiency greater than 65% was achieved by all filters (Fig. 7C). The average reductions achieved by the filters (Fig. 7C) were 73% (BSF), 70% (CCF) and 69% (BF). The BSF and BF were able achieve > 70% iron reduction. Iron retention by the BSF and BF could be through biological oxidation of soluble iron(II), by iron-oxidising microorganisms such as Gallionella sp., into poorly ordered insoluble iron(III) oxides (Michalakos et al., 1997; Mounchet, 1992). Soluble iron(II) oxidation into insoluble iron(III) could also be through aeration (Stumm and Morgan, 1981). There was no statistically significant difference in the hourly reduction of iron by the filters (p > 0.05) and the 3 filters had equal removal efficiency for iron (p > 0.05), even though the BSF was expected to remove higher levels of iron due to the presence of the biological zone. This suggests that there must be another mechanism of iron reduction by the filters (presently unknown). The results indicate that any of the filters could be used for the removal of iron and water could be drawn for use at any time of filter run. The CCF evaluated in this study had a carbon fibre blanket with pore size of 0.2 µm and the ceramic component of the filter was 0.5 µm. Activated carbon filters have been found by Modin et al. (2011) to be effective in removing more than 90% of cobalt, chromium, iron, lead and zinc. The activated carbon filter also removed calcium, cadmium, magnesium, mercury, manganese and molybdenum, but not to the same extent. Removal of metals by activated carbon is believed to be through sorption processes whereby heavy metals are believed to form complexes with organic matter (Christensen et al., 1996). The removal of magnesium, calcium and iron by the CCF could be through these processes.
The BSF, CCF and BF were able to achieve over 50% reduction of arsenic (Fig. 7D). There was no difference in the average arsenic removal by the filters (p > 0.05) and the hourly reduction efficiency was observed to be statistically insignificant (p > 0.05). The average arsenic reduction efficiency by the filters throughout the filtration series was 55% (72 samples for each filter). These filters (BSF, CCF and BF) were observed to remove arsenic to a great extent when the initial concentrations were low. Similar to the CCF evaluated in this study, a simple ceramic filter made from clay and rice bran is available in rural areas of Bangladesh. This ceramic filter removes iron from contaminated water and arsenic to a lesser extent. Arsenic removal is believed to be through partial oxidation of arsenic (III) to arsenic (V) during physical-chemical oxidation of iron (II) to iron (III). This results in higher arsenic removal efficiency by the ceramic filter (Roberts et al., 2004; Berg et al., 2006). This mechanism possibly explains arsenic retention by the CCF.
As mentioned earlier, biological oxidation of iron(II) is useful in arsenic removal, and this process, when coupled with ceramic filtration, would be a worthwhile alternative for arsenic removal from groundwater (Shafiquzzaman et al., 2010), because ceramic filters can be manufactured locally, using locally-available materials at low costs. Inconsistency in the removal of contaminants by the BSF, CCF and BF indicated the dependence of the removal efficiency on the initial concentrations of contaminants.
On average, the BSF, CCF and BF had low fluoride removal efficiency (Fig. 7E). Poor fluoride reduction could be as a result of cracks in the CCF (Shafiquzzaman et al., 2010) and the poor ability of sands to retain fluorides. Proposed mechanisms of fluoride removal include chemical precipitation, ion exchange, reverse osmosis, adsorption and nanofiltration (Haron and Yunus, 2001, Hu et al., 2005; Simons, 2003). None of these processes could be achieved through the use of sands, regardless of the particle size, but fluorides could be exchanged with other ions on the surface of clays and this could explain some of the removal that was achieved by the CCF.
There was poor reduction of nitrates by the filters (Fig. 7F); average reduction efficiency was 18% (BSF), 37% (CCF) and 27% (BF). The mean nitrate hourly reductions, as well as the hourly reduction efficiencies achieved by the BSF, CCF and BF were not significantly different (p > 0.05). During the course of the study, the highest reduction efficiency achieved by the filters was 90% (BSF), 96% (CCF) and 95% (BF) (Fig. 7F). Nitrates leached from the filter media or walls as there were higher concentrations in the filtered water compared to the concentrations of unfiltered water, most of the time. This could be as a result of desorption of previously adsorbed nitrates when a more preferred ion competes for the adsorption site (ion exchange). Achak et al. (2009) reported 81% - 99% nitrate reduction by sand filters and proposed that total nitrate removal was through anaerobic denitrification microorganisms when the filter was supplied with water. This process explains the removal of nitrates by the BSF, BF and other similar filters (Longe, 1989; Pell, 1989b). However, our BSF did not remove nitrates convincingly when compared to the CCF and BF. This may imply that there were other rejection mechanisms (adsorption, ion exchange or the nitrates are adsorbed to particulate matter in the raw water) that took place within the CCF and BF.
On average, the BSF and the CCF displayed low phosphate removal from contaminated water. The BF was able to achieve, on average, 21% phosphate reduction but, during the course of the filter run, 96% reduction by the filter was achieved (Fig. 7G). Although, on average, the BSF performed poorly in removing phosphates, a reduction efficiency of 93% was recorded during the course of the study. There was a significant difference between hourly reduction of phosphates by the BSF (p = 0.02) and high reduction was observed in the first hour of filter run. This could be explained by the fact that the first-hour collection was comprised mainly of water that had been in the filter since the previous filtration and hence had spent more time in contact with the filter media compared to the newly-poured water. There was no significant difference in the hourly reduction of phosphates by the CCF (p = 0.795) and BF (p = 0.553). The performance of the filters in phosphate reduction was not significantly different. Phosphorus removal is a complex process that involves settlement, bacteria adsorption and substrate affinity (Greenway and Wood, 1999; Vymazal, 2007; Kadlec and Wallace, 2008). The removal of phosphates by the filters is believed to be through biological processes (Grzmil and Wronkowski, 2006; Morse et al., 1998). Lower phosphate removals by the filters could be attributed to the particle size of the filter media as finer particle size materials have been reported to have higher phosphate sorption capacity (Brogowski and Renman, 2004). The slight phosphate removal by the filters could also be through fixation of phosphate ions by ions of calcium and iron (Guan et al., 2009). The BSF, CCF and BF cannot be used for the treatment of contaminated water with phosphate concentrations above the limit recommended by SANS, 241 (2006).
The BSF, CCF and BF had very low TOC reduction efficiencies (Table 1). The BSF achieved, on average, 17% TOC reduction (Table 1) while the CCF had 39% (Fig. 5) and the BF had 11% (Table 1). The CCF was observed to have the highest TOC reduction efficiency compared to the BSF and BF. There was a significant difference in the hourly reduction of TOC by the BSF (p = 0.049) and CCF (p = 0.00), but there was no significant difference in the hourly reduction of TOC by the BF (p = 0.153). Statistical tests showed that the CCF removed TOC better than the BSF (p = 0.000) and the BF (p = 0.000). There was equal removal of TOC by the BSF and BF (p = 0.078). The greater reduction of TOC by the CCF compared to BSF and BF shows that clay minerals perform better than sand in removing TOC from contaminated water. This higher removal could also be attributed to the small pore size of the CCF (0.5 µm). The filters can be ordered in terms of TOC reduction as follows: CCF > BSF = BF.
There are reports in the literature on the removal of chemical contaminants by the BSF, CCF and BF devices. The BSF has been reported by CAWST (2008) to remove iron in the biolayer zone. Our BSF, which also had a biological layer, removed up to 90% iron. Van Halem (2006) predicted > 90% reduction of iron by CCF devices and the CCF filter evaluated in this study was able to achieve 69% reduction efficiency. The BF was designed and built by the TUT research group. To the best of our knowledge, there is no information reported in literature on the design of such a filter. Therefore evidence of chemical contaminants removal by this filter could be compared to other similar filters such as fast sand filters which may use an identical chemical contaminants removal mechanism as the BF. The BSF, CCF and BF were able to achieve arsenic reduction efficiency > 40%. There are no results for arsenic removal by the CCF and BF and/or fast sand filters reported in literature. In the case of BSFs, Sharma (2005) reported that these filters remove up to 90% of arsenic. The filters evaluated in this study have been reported to achieve very poor removal of phosphates, nitrates and fluorides. Although the BF was classed as a fast sand filter, it has to be noted that the particle size of the sand used (0.95 mm) was much smaller than the conventional sand size for fast sand filters, which is 2 mm - 8 mm (Ministry of Agriculture, Food and Fisheries, 1999) and this could explain why it removed some of the chemical contaminants. Greater reduction of contaminants by the BSF was noticed in the first hour of filtration. This could be explained by the fact that the filter always contained water, in order to ensure the existance of the biological layer which is fundamental to the reduction of micro-organisms from water. This implies that the first-hour collection comprised mostly of the water that had been left in the filter since the last filtration was done. This water had a long contact time with the filter, hence the greater reductions observed. The filters removed calcium, magnesium and iron to levels below the limit recommended by SANS, 241 (2006), but not arsenic, nitrates, fluorides and phosphates.
Effects of chlorophyll a on the flow rates of filters and turbidity of intake water
The effects of chlorophyll a on the flow rates of filters and the relationship between chlorophyll a concentrations and turbidity of unfiltered water were evaluated and results are presented in Fig. 8. Results indicated that at higher chlorophyll a concentrations, the flow rates of the filters decreased. Chlorophyll a generally had an inverse relationship with the flow rates of BSF, CCF and BF, as statistical tests indicated correlation coefficients (r) of -0.556, -0.788 and -0.818, for BSF, CCF and BF, respectively, between flow rates and chlorophyll a concentrations. Higher chlorophyll a concentrations in raw intake water resulted in observations of higher turbidities, hence the filters clogged quicker resulting in an overall decrease in the flow rates of the filters. There was a positive correlation between chlorophyll a in the unfiltered water and turbidity of the water (r = 0.607). Chlorophyll a is used as a measure of the concentration of algae (Gregor and Marsalek, 2004); algae form part of the total suspended particles in water, and, hence, contribute to turbidity. Uncles et al. (2000) investigated seasonal variation of salinity, temperature, turbidity and chlorophyll a in the Tweet Estuary. Chlorophyll a concentrations were found to be low where the turbidity was low. Although the interception of light by suspended particles (high turbidity) limits phytoplankton growth resulting in low chlorophyll a concentrations (inverse correlation) as reported by Boyd (2002), this study supports the opposite finding, as reported by Uncles et al. (2000).
Maintenance guidelines for the filters
Investigation of filters'; maintenance requirements was fundamental to this study, in order to make recommendations as to how the filters need to be handled for the production of good quality water and to ensure a long lifespan.
Collection vessels for all of the filters were cleaned thoroughly with deionised water and soap and sterilised with household bleach. It is recommended that rural households with limited access to deionised water should use water filtered through the filter to wash collection vessels. In cases where household bleach cannot be afforded, thoroughly washed collection vessels may be left in the sun for sterilisation by drying and heating. The BSF, CCF and BF were cleaned when the flow rates were observed to have decreased significantly. In cases where the flow rates of the filters are observed to be high but the filters look dirty, it is recommended that the filters are washed as described below. Figure 9 shows how the BSF, CCF, BF and collection vessels looked when they were dirty.
The BSF was cleaned by removing the top 5 cm layer of fine sand, which was thoroughly washed and replaced. Removing the top few centimetres of the top sand bed was appropriate based on the observation that particles resulting in clogging could not penetrate deep into the sand bed (Fewster and Wiessent-Brandsma, 2004).
Washing of the BF';s media was performed in the same manner as the BSF, except that the top 10 cm layer of sand was removed, washed and replaced. Removal of 10 cm was justified based on the larger particle size of the sand used as the filter media in the BF; particles were observed to penetrate deeper into the sand.
Sludge or dirt on the filter (CCF) should be cleaned periodically when unsatisfactory flow rates are obtained as a result of filter clogging. Scrubbing with a cloth or soft brush, followed by rinsing with hot water once a week, is recommended (Shafiquzzaman et al., 2010). Care must be taken not to cause cracks during cleaning. Dirt from the CCF was removed by scrubbing the candle filter with a soft brush followed by rinsing with deionised water.
These household filters have been designed to filter water with turbidities lower than 50 NTU. In cases where the water to be filtered is highly turbid (> 50 NTU), the water must be left to settle before it is filtered (CAWST, 2008). To test the turbidity of water, water to be filtered may be poured into a clean 2 ℓ plastic bottle placed on top of a piece of paper bearing large print. Failure to see the large print when looking down through the top of the bottle indicates that the water has turbidity > 50 NTU (CAWST, 2008).
Movement of the filters should be avoided since this disturbs the sand bed in the BSF and BF and the biological layer in the BSF might be disturbed too. Care must be taken when opening the taps as leakages may results from detached taps.
The filters cost approximately US$16 (BSF), US$64 (CCF) and US$17 (BF). The BSF and BF can produce over 60 ℓ of treated water a day while the CCF would require at least 8 h to produce 25 ℓ/d. All the filters were able to remove contaminants to some extent even after filtering 1 200 ℓ of contaminated water. Low-income rural people of South Africa could afford to possess one of these filters due to their low cost. The filters (BSF and BF) may be made at home at lower costs and construction materials are readily available.
Conclusions
Three filters were modified, constructed, evaluated and compared for their performance in removing chemical contaminants from contaminated water. The BSF, CCF and BF had flow rates within the recommended limits. Due to higher flow rates, these filters may be used for production of clean potable water for a family with more than six family members. The flow rates of the filters were significantly affected by the turbidity and chlorophyll a concentrations of raw intake water. The filters were able to remove > 50% turbidity from contaminated water with turbidity > 40 NTU. The filters were observed to remove metals although the overall removal efficiency was not very high. The filters were observed to equally remove calcium, magnesium, iron and arsenic (p ˃ 0.05). The performance of the filters in removing chemical contaminants was not affected by the contact time between the filter media and contaminated intake water. These filters may not be recommended for treatment of water highly contaminated with nitrates, fluorides and/or phosphates since they were not able to remove these contaminants to levels recommended by SANS, 241 (2006). The filters are cheap to construct using readily-available materials and easy to operate and maintain and are thus affordable to low-income SARA people. The size of the filters is an added advantage since it makes it possible for household users to keep them where food is prepared. This will motivate users to continue using the filters and also to maintain them.
Acknowledgements
We wish to thank the Water Research Commission (South Africa) for funding this project (WRC Project No. K5/1884/3).
References
ACHAK M, MANDI L and OUAZZANI N (2009) Removal of organic pollutants and nutrients from olive mill wastewater by a sand filter. J. Environ. Manage. 90 2771-2779. [ Links ]
AHAMED S, MUNIR AKM and HUSSAM A (2009) Groundwater arsenic removal technologies based on sorbents: field applications and sustainability. In: Ahuja S (ed.) Handbook of Water Qualityand Water Purity. Academic Press, London. 379-417. [ Links ]
BAILEY J, JOLLY PK and LACEY RF (1986) Domestic Water Use Patterns. Technical Report: 225. Water Research Centre, Medmenham. [ Links ]
BARNES D, COLLIN C and ZIFF S (2009) The biosand filter, siphon filter and rainwater harvesting. Strategic recommendations for new water treatment technologies and safe water storage to pure home water. Submitted in partial fulfilment of the requirements for 1.782 Environmental Engineering Master of Engineering Project, Massachusetts Institute of Technology. 25-27. [ Links ]
BELLONA C, DREWES JE, XU P and AMY G (2004) Factors affecting the rejection of organic solutes during NF/RO treatment - a literature review. Water Res. 38 2795-2809. [ Links ]
BERG M, LUZI S, TRANG PKT, VIET PH, GIGER W and STUBEN D (2006) Arsenic removal from groundwater by household sand filters: comparative field study, model calculations and health benefits. Environ. Sci. Technol. (40) 5567-5573. [ Links ]
BOUWER EJ, RIJNAARTS HHM, CUNNINGHAM AB and GERLACH R (2000) Biofilms in porous media. In: Bryers JD (ed.) Biofilms II: Process Analysis and Applications. Wiley, New York. 123-158. [ Links ]
BOYD PW (2002) Environmental factors controlling phytoplankton processes in the Southern Ocean. J. Phycol. 38 844-861. [ Links ]
BROGOWSKI Z and RENMAN G (2004) Characterisation of Opoka as a basis for its use for wastewater treatment. Pol. J. Environ.Stud. 13 (1) 15-20. [ Links ]
BROWN J and SOBSEY M (2006) Independent Appraisal of Ceramic Water Filtration Interventions in Cambodia: Final Report. Department of Environmental Sciences and Engineering, School of Public Health, University of North Carolina, USA. [ Links ]
CAWST (2008) Biosand Filter Manual: Design, Construction, Installation, Operation and Maintenance. URL: http://www.cawst.org/en/themes/biosand-filter (Accessed 24 February 2010). [ Links ]
CHEN JG, KONG HN, WU D, HU ZB, WANG ZS and WANG YH (2006) Removal of phosphate from aqueous solution by zeolite synthesized from fly ash. J. Colloid Interface Sci. 300 491-497. [ Links ]
CHRISTENSEN JB, JENSEN DL and CHRISTENSEN TH (1996) Effect of dissolved organic carbon on the mobility of cadmium, nickel and zinc in leachate polluted groundwater. Water Res. 30 3037-3049. [ Links ]
CLASEN TF and BASTABLE A (2003) Faecal contamination of drinking water during collection and household storage: the need to extend protection to the point of use, J. Water Health 1 109-115. [ Links ]
DALY KL, SMITH WO, JOHNSON GC, DITULLIO GR, JONES DR and MORDY CW (2001) Hydrography, nutrients, and carbon pools in the Pacific sector of the Southern Ocean: Implications for carbon flux. J. Geophys. Res. 106 7107-7124. [ Links ]
ELLIOT MA, STAUBER CC, KOKSAL F, DIGIANO FF and SOBSEY MD (2008) Reductions of E. coli, echovirus type 12 and bacteriophages in an intermittently operated household-scale slow sand filter. Water Res. 42 2662-2670. [ Links ]
FEWSTER E, MOL A and WIESSENT-BRANDSMA C (2004) The long term sustainability of household bio-sand filtration. Proc. 30thWEDC International Conference, Vientiane, Lao, October 2004. [ Links ]
FRANZ AM (2004) A performance study of ceramic candle filter in Kenya including tests for coliphage removal. University of Carolina at Chapel Hill, North Carolina. [ Links ]
GREENWAY M and WOOLLEY A (1999) Constructed wetlands in Queensland: performance efficiency and nutrient bioaccumulation. Ecol. Eng. 12 39-55. [ Links ]
GREGOR J and MARSALEK B (2004) Freshwater phytoplankton quantification by chlorophyll a: a comparative study of in vitro, invivo and in situ methods. Water Res. 38 517-522. [ Links ]
GRZMIL B and WRONKOWSKI J (2006) Removal of phosphates and fluorides from industrial wastewater. Desalination 189 261-268. [ Links ]
GUAN Q, HU X, WU D, SHANG DXY and KONG H (2009)Phosphate removal in marine electrolytes by zeolite synthesized from coal fly ash. Fuel 88 1643-1649. [ Links ]
HARON MJ and YUNUS WM (2001) Removal of fluoride ion from aqueous solution by a cerium-poly(hydroxamic acid) resin complex. J. Environ. Sci. Health 36 (5) 727-734. [ Links ]
HU CY, LO SL, KUAN WH and LEE YD (2005) Water Res. 39 895-901. [ Links ]
HUISMAN L and WOOD W (1974) Slow Sand Filtration. WHO, Geneva. [ Links ]
JACKSON RD, LACROIX AZ, GASS M, WALLACE RB, ROBBINS J and LEWIS CE (2006) Calcium plus vitamin D supplementation and the risk of fractures. N. Engl. J. Med. 354 669-683. [ Links ]
KADLEC R and WALLACE S (2008) Treatment Wetlands. CRC Press, Boca Raton. [ Links ]
KAMIYANGO MW, MASAMBA WRL, SAJIDU SMI and FABIANO E (2009) Phosphate removal from aqueous solutions using kaolinite obtained from Linthipe, Malawi. Phys. Chem. Earth 34 850-856. [ Links ]
LANTAGNE D (2001) Investigation of the Potters for Peace Colloidal Silver Impregnated Ceramic Filter Report 2: Field Investigations. Alethia Environmental for USAID, Allston, Massachusetts. [ Links ]
LONGE O (1989) Infiltration and Protection of Groundwater. University of Science and Technology of the Languedoc, Montpellier. [ Links ]
LOW J (2002) Appropriate Microbial Indicator Tests for Drinking Water in Developing Countries and Assessment of Ceramic Water Filters. M.Eng. thesis, Department of Civil and Environmental Engineering, Massachusetts Institute of Technology. Cambridge, Massachusetts, USA. [ Links ]
MAHMOOD Q, BAIG SA, NAWAB B, SHAFQAT MN, PERVEZ A and ZEB BS (2011) Development of low cost household drinking water treatment system for the earthquake affected communities in Northern Pakistan. Desalination 273 316-320. [ Links ]
MICHALAKOS GD, NIEVA JM, VAYENAS DV and LYBERATOS G (1997) Removal of iron from potable water using a trickling filter. Water Res. 31 (5) 991-996. [ Links ]
MINISTRY OF AGRICULTURE, FOOD AND FISHERIES (1999) Treatment of greenhouse circulation water. Biosand filtration. Irrigation Factsheet. Ministry of Agriculture, Food and Fisheries. British Columbia. [ Links ]
MODIN H, PERSSON K, ANDERSSON A and VAN PRAAGH M (2011) Removal of metals from landfill leachate by sorption to activated carbon, bone meal and iron fines. J. Hazard. Mater. 189 749-754. [ Links ]
MOLINE M and PREZELIN BB (1996) Long-term monitoring and analyses of physical factors regulating variability in coastal Antarctic phytoplankton biomass, in situ productivity, and taxonomic composition over subseasonal, seasonal and interannual time scales. Mar. Ecol. Prog. Ser. 145 143-160. [ Links ]
MOUNCHET P (1992) From conventional to biological removal of iron and manganese in France. J. Am.Water Works Assoc. 84 (4) 158-166. [ Links ]
MORSE GK, BRETT SW, GUY JA and LESTER JN (1998) Review: Phosphorus removal and recovery technologies. Sci. Total Environ. 212 69-81. [ Links ]
MWABI JK, ADEYEMO FE, MAHLANGU TO, MAMBA BB, BROUCKAERT BM, SWARTZ CD, OFFRINGA G, MPENYANA-MONYATSI L and MOMBA MNB (2011) Household water treatment systems: a solution to the production of safe drinking water by the low-income communities of Southern Africa. Phys. Chem. Earth. 6 1120-1128. [ Links ]
NOUBACTEPA C and CARE S (2010) Enhancing sustainability of household water filters by mixing metallic iron with porous materials. J. Chem. Eng. 162 635-642. [ Links ]
OXFAM (2008) Household water treatment and storage. OXFAM - TB4 (draft - 23/5/08). Oxfam, Oxford. [ Links ]
PAN AMERICAN SILVER CORP (2004) Silver Facts (3-23-05). Pan American Silver Corp., Vancouver. [ Links ]
PELL M and NYBERG F (1989b) Infiltration of wastewater in a newly started pilot sand-filter system: III. Transformation of nitrogen. J. Environ. Qual. 18 463-467. [ Links ]
PENG FF and DI P (1994) Removal of arsenic from aqueous solution by adsorbing colloid flotation. Ind. Eng. Chem. Res. 33 922-928. [ Links ]
ROBERTS LC, HUG SJ, RUETTIMANN T, BILLAH MM, KHAN AW and RAHMAN MT (2004) Arsenic removal with iron(II) and iron(III) in waters with high silicate and phosphate concentrations. Environ. Sci. Technol. 38 307-315. [ Links ]
SHARMA D (2005) KanchanTM Arsenic Filter: Removal of Bacteria (Total Coliform) of Gem 505 Model. 4 Weeks Daily Study. Submitted in partial fulfilment of the requirements for a Bachelors Degree in Environmental Science (Honours), Department of Biological Sciences and Environmental Science, Kathmandu University, Kathmandu. [ Links ]
SHAFAQUZZAMAN M, AZAM MS, NAKAJIMA J, BARI QH (2010) Investigation of arsenic removal performance by a simple iron removal ceramic filter in rural households of Bangladesh. Desalination. doi:10.1016/j.desal.2010.07.031. [ Links ]
SHILLS ME, SHIKE M and ROSS AC (2006) Modern Nutrition inHealth and Disease (10th edn.). Lippincott Williams & Wilkins, Philadelphia. 670-684. [ Links ]
SIEGRIST RL, BOYLE WC (1987) Wastewater-induced soil clogging development. J. Environ. Eng.ASCE 113 550-566. [ Links ]
SIMONS R (1993) Trace element removal from ash dam waters by nanofiltration and diffusion dialysis. Desalination 89 325-341. [ Links ]
SMITH L (2004) Ceramic Water Filter Use in Takeo, Cambodia - Operational Issues and Health Promotion Recommendations. Submitted in partial fulfilment of a M.Sc. in Control of Infectious Diseases, London School of Hygiene and Tropical Medicine, London, England. [ Links ]
SOBSEY MD (2002) Managing Water in the Home: AcceleratedHealth Gains from Improved Water Supply. Water, Sanitation and Health. Department of Protection of the Human Environment, World Health Organization, Geneva. 70 pp. [ Links ]
SPELLMAN FR (2008) Handbook of Water and Wastewater Treatment Plant Operations (2nd edn.). CRC Press, Boca Raton. [ Links ]
STANDARD METHODS (1995) Standard Methods for the Examination of Water and Wastewater (19th edn.). Eaton AD, Clesceri LS and Greenberg AE (eds.). American Public Health Association (APHA), Washington, DC. [ Links ]
STUMM W and MORGAN JJ (1981) Aquatic Chemistry (2nd edn.). Wiley Inter Science, New York. 780 pp. [ Links ]
UNCLES RJ, BLOOMER NJ, FRICKERS PE, GRIFFITHS ML, HARRIS C, HOWLAND RJM, MORRIS AW, PLUMMER DH, TAPPIN AD (2000) Seasonal variability of salinity, temperature, turbidity and suspended chlorophyll in the Tweed Estuary. Sci.Total Environ. 251/252 115-124. [ Links ]
US EPA (UNITED STATES ENVIRONMENTAL PROTECTION AGENCY) (1990) Technologies For Upgrading Existing Or Designing New Drinking Water Treatment Facilities. US EPA, Cincinnati. [ Links ]
VAN HALEM D (2006) Ceramic Silver Impregnated Pot Filters for Household Drinking Water Treatment in Developing Countries. M.Sc. Civil Engineering Thesis, Department of Water Resources, Delft University of Technology, Netherlands. [ Links ]
VAN HALEM DS, VAN DER LAAN H, HEIJMAN SGJ, VAN DIJK JC and AMY GL (2009) Assessing the sustainability of the silver-impregnated ceramic pot filter for low-cost household drinking water treatment. Phys. Chem. Earth 34 36-42. [ Links ]
VYMAZAL J (2007) Removal of nutrients in various types of constructed wetlands . Sci. Total Environ. 380 48-65. [ Links ]
WANG S and PENG Y (2010) Natural zeolites as effective adsorbents in water and wastewater treatment. Chem. Eng. J. 156 11-24. [ Links ]
WHO/UNICEF (2006) Meeting the MDG drinking water and sanitation target: the urban and rural challenge of the decade. World Health Organization/UNICEF Joint Monitoring Programme for Water supply and Sanitation, Geneva. [ Links ]
Received 24 June 2011; accepted in revised form 14 December 2011.
* To whom all correspondence should be addressed. +27 11 559 6516; fax: +27 11 559 6516; e-mail: bmamba@uj.ac.za

