


Services on Demand
Article
 English (pdf)
 Article in xml format
 Article references
Indicators

Related links
-
 Cited by Google
 -
 Similars in Google
Share

 Permalink
Journal of Education (University of KwaZulu-Natal)
On-line version ISSN 2520-9868
Print version ISSN 0259-479X
Journal of Education n.87 Durban 2022
http://dx.doi.org/10.17159/2520-9868/i87a05
From measuring impact to informing course design: The second design trial of the Maths Intensive course
Nicky RobertsI; Jerry MasekoII
IFaculty of Education, University of Fort Hare, East London, South Africa nroberts@ufh.ac.za https://orcid.org/0000-0002-1910-0162
IIDepartment of Childhood Education, Faculty of Education, University of Johannesburg, Johannesburg, South Africa jerrym@uj.ac.za https://orcid.org/0000-0001-6790-7115
ABSTRACT
This paper describes the changes made to the administration of assessments in the second design trial of the Maths Intensive course at a comprehensive university in South Africa because of Covid-19. The course was designed in direct response to poor attainment in the Primary Teacher Education project's mathematics test. Building on positive findings of improved attainment evident in the first design cycle, the Maths Intensive course was further refined for a second cohort of students, and shifts in attainment were once again analysed. The Covid-19 lockdown meant that student could not write the post-test on campus. As a result, the post-test data were not used to measure impact but, instead, were used to establish what the student teachers knew and were able to do at the end of the course. The Maths Intensive test framework mapped the test items to the learning outcomes for the course. Facility scores revealed areas where students were capable and areas where they still required support. The assumption that students would use calculators in un-invigilated circumstances was challenged, and requires further research. These findings may be of interest to lecturers and teachers seeking to develop assessment reports that provide useable information to improve their instructional design and teaching practice. They may also be of interest to academics and training providers designing mathematics education programmes for initial teacher education or for ongoing professional development courses for teachers in primary schools.
Keywords: assessment reports, initial teacher education, primary/elementary education, mathematics
Introduction
This paper is situated within the literature on assessment-particularly assessment purposes and utility to improve teaching and learning. Moloi and Kanjee (2018) reported that a challenge facing South African teachers is the inadequacy of meaningful reporting and effective utilisation of evidence from assessment. They argued that meaningful reporting includes finding effective ways of converting raw data into information that can inform decision-making and explained:
At classroom level, "meaningful information" refers to information that the teacher could use for determining what learners at a particular grade level know or do not know, and can or cannot do, and to develop relevant interventions to address specific learning needs of learners. (Moloi & Kanjee, 2018, p. 2)
We contend that this observed challenge pertains to both teachers in schools and lecturers engaged in initial teacher education (ITE) in universities. In ITE programmes, the Primary Teacher Education (PrimTEd) standardised assessments in mathematics and English have been used by lecturers to inform current and future course design. One of the key elements of the PrimTEd assessment work is reflection on meaningful reporting (Moloi et al., 2019). Such reporting is intended to provide ITE lecturers and course designers with usable information relating to a particular year group in the BEd mathematics courses. Such information ought to describe what student teachers know and do not know, and can do or cannot do, so that lecturers and course designers are able use this information to develop relevant interventions that address specific learning needs of their students.
Poor attainment in mathematics for primary teaching was evident from the 2018 assessment results that were obtained using a cross-sectional study of first- and fourth-year BEd students using the PrimTEd mathematics assessment. These findings led to the design and implementation of the Maths Intensive course with first-year students (Roberts et al., 2020).
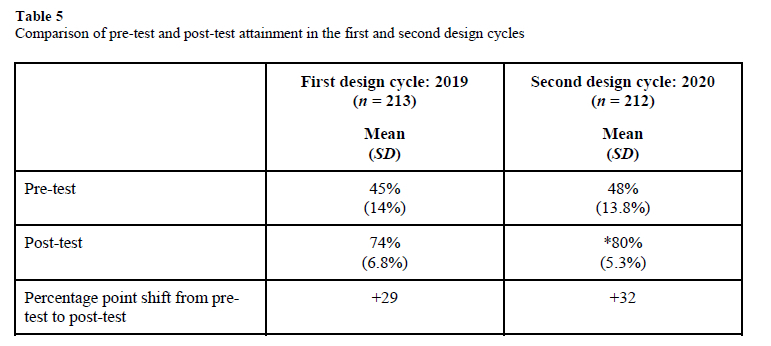
The course was first implemented in 2019 with all first-year students in the BEd programmes for Foundation Phase and Intermediate Phase at a comprehensive university in South Africa. Students completed the pre-test before, and the post-test after, the implementation of the Maths Intensive course (see Figure 1). This course (the first design) resulted in a positive shift in attainment (of 14 percentage points) on the mean scores in the 17 matched items from the pre-test to the post-test, with a large effect size (d = 0.82; Roberts, 2020).
Building on the promising results of the 2019 first design cycle intervention, the course was repeated. A second design cycle was therefore undertaken in 2020. The intention was to establish whether the second design cycle led to even greater shifts in attainment than were seen in the first design cycle. A difference-in-differences design was planned. Using design-based research approaches, this study set out to use assessment to further improve BEd programme impact through analysing assessment data on student teacher attainment in the online pre-test and an online post-test following the intervention in the second cycle of implementation (in 2020). However, the Covid-19 pandemic impacted significantly on the research design for the experiment. In 2019, both pre-test and post-test were administered online under invigilated conditions in a university computer laboratory. The pre-test in 2020 was administered in the same way. However, given the pandemic restrictions, the administration of the post-test in 2020 was changed. Because students had no access to campus, it was not possible to administer the post-test under the same invigilated examination conditions. Rather than abandon the assessment data entirely, the 2020 post-test was administered by allowing student teachers to write the online assessment remotely, without any supervision. This denoted a significant change in the administration conditions of the 2020 post-test compared to the 2019 pre- and post-test and 2020 pre-test. The 2020 post-test was administered under different conditions and consequently no longer provided a direct comparison that could be used to measure impact of the second design cycle for the Maths Intensive course.
This paper reports on the changes to the Maths Intensive post-test that were necessary because of the Covid-19 pandemic. It exemplifies a change in utility of assessment data- from measuring impact to informing course design. The design pivots away from using the 2020 post-test to measure the impact of the second intervention cycle compared to the first intervention cycle, towards using the assessment data to provide meaningful feedback to lecturers and course designers. We set out to establish what the student teachers knew and were able to do at the end of the second design cycle. This analysis first takes into account their knowledge and skills when they entered the BEd programme in first year, as evident from the invigilated pre-test administered at the outset of their course in 2020. Then separately, it considers their knowledge and skills as evident at the end of the course-and evident in their responses to the post-test, which they responded to in an un-invigilated setting, after the course. Thus, the paper contributes to this special issue's themes of "how mathematics assessment has been applied in a particular initial teacher education programme" and "the impact of the Covid-19 pandemic on these assessment practices."
Methods
The overall design of the Maths Intensive research draws on design-based research that aims to "improve educational practices through iterative analysis, design, development, and implementation, based on collaboration among researchers and practitioners in real-world settings, and leading to contextually-sensitive design principles and theories" (Wang & Haffanin, 2005, p. 2). The first and second design cycles of Maths Intensive had the same learning goals. First-year student teachers in the BEd programmes were expected to:
• Think deeply about how numbers work, which is necessary for the underlying patterns and structures which they will introduce to children.
• Interpret and use flexible strategies to add and subtract whole numbers, which they needed to both explain and listen to children's ideas.
• Interpret and use flexible strategies to multiply and divide whole numbers, which they needed to explain and listen to children's ideas (Roberts et al., 2020).
From the course design side, each learning outcome was discussed in some detail in Roberts (2020), for example:
Learning Goal One, "how numbers work" focused on the meaning of the equal sign, counting on a back in 1s, 10s and 100s, and base-10 place value, all four operations using multiples of 10s and 100s, and rounding off. The focal representations were a balance scale, the number line, hundred square and Gattegno chart. (p. 132)
From the assessment design side, the constructs assessed for each learning outcome in the tests are described in some detail in this paper.
Research questions
Taking the design experiment as a whole, there are several themes of interest: (1) the change of assessment design, (2) the shifts in learner outcomes, and (3) the course content itself (and its adaptations from one cycle to the next). In this paper, we focus on assessment- considering how we applied assessment in the Maths Intensive course and the impact of the Covid-19 pandemic on these assessment practices. We posed the following research questions:
• "How did the students in the second design cycle compare to the students in the first design cycle in relation to their attainment in the pre-test?" This provided insight into the knowledge and skills that student teachers possess when entering the BEd evident from the 2019 pre-test and 2020 pre-test.
• "In 2020, how was the administration of the post-test assessment in Maths Intensive adjusted because of the Covid-19 pandemic?" We reflect here on the changes we made.
• "What does the 2020 post-test (which was not invigilated) reveal about what students in the second design cycle know and can do in relation to how numbers work and interpreting and using flexible strategies for the four mathematical operations with whole numbers?"
Data collection
Data collected to answer these research questions were drawn from the pre-test and post-test scores obtained in 2019 and 2020.
Ethics
The PrimTEd assessment work stream followed a voluntary, informed consent process for educational research with the University of Johannesburg's protocol number, 2017-072. Student teachers were invited to opt in for their data to be used anonymously for this research, with no consequences if they chose to opt out.
The assessment instruments
As for the first design cycle, the pre-test for this course was the PrimTEd mathematics assessment (comprising 50 marks), the design of which is discussed by Venkat et al. (2017), Fonseca et al. (2018), and Bowie et al. (2019). The PrimTEd mathematics assessment is being used across South African universities to provide information on student teachers' mathematics knowledge for teaching in primary school.
The pre-test was an online test consisting of 50 items, and students had 90 minutes to complete the test. The test items were spread across two cognitive demand levels: lower and higher cognitive demand levels as well as a pedagogical category. Fonseca et al. (2018) explained that the PrimTEd mathematics assessment items were also classified as either lower or higher cognitive demand as stipulated by the Stein et al. (1996) framework on tasks:
While "lower cognitive demand" items were considered to be routine procedures, the "higher cognitive demand" items involved moves between representations, required insight, connected across topic areas, and/or had no obvious procedure or starting point. (Fonseca et al., 2018, p. 6)
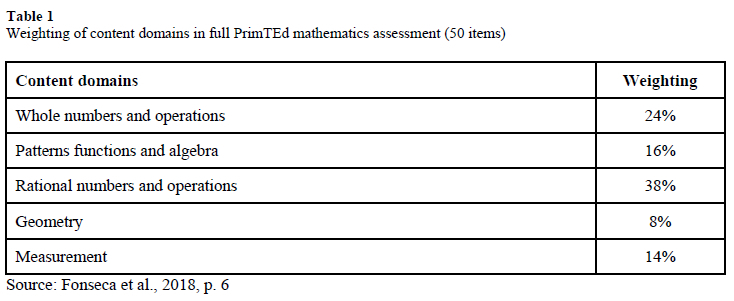
The mathematics content domains and their weighting across the test were as illustrated in Table 1.
It is important to note that one quarter of the PrimTEd mathematics assessment focuses on whole numbers and operations, and a further 16% concerned patterns, functions, and algebra. These two content domains were the focus of the Maths Intensive course. Regarding whole numbers and operations, Bowie et al. (2019) offered the following examples in the PrimTEd mathematics assessment:
Examples of lower-cognitive-demand whole number items
(A) 700 - 292 =
(B) Identify the approximate position of 706 on a number line marked from 700 to 800 in divisions of 10.
Examples of higher-cognitive-demand whole number items are
(A) Fill in the number to make the number sentence true 623 - 298 = 622 - . . .
(B) Container A weighs 23 kg more than container B. Container A weighs 87 kg. How much does container B weigh? (Bowie et al., 2019, p. 292)
To exemplify the patterns, functions, and algebra items in the PrimTEd mathematics assessment, Bowie et al. (2019, p. 294) offered the following examples:
Example of lower-cognitive-demand patterns, functions, and algebra items.
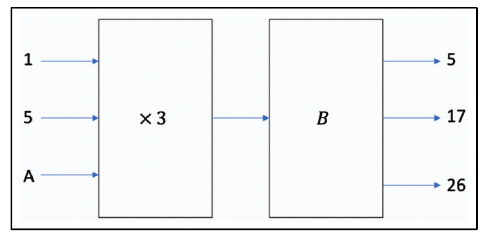
A is a number and B is a rule (an operation and number) in the diagram below. What is A?
Example of higher-cognitive-demand patterns, functions and algebra items.
Given that 3n + 6 = 10 what will the value of 3n + 8 be?
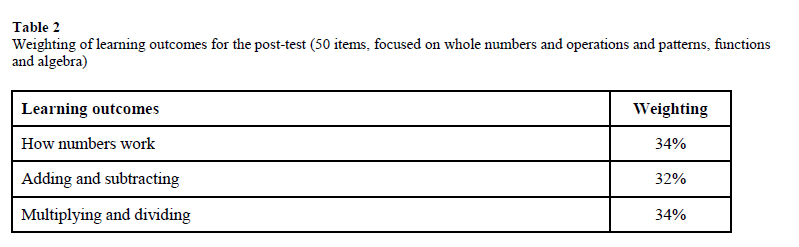
The post-test assessment for the Maths Intensive course in 2020 was identical to that used as the post-test in the first design cycle in 2019. There were also 50 items, and it was designed for online administration. Compared to the pre-test, the post-test content domains were more limited, and the weighting of items was matched against the learning outcomes for the Maths Intensive course (see Table 2).
The pre-test and the post-test had 17 items which were matched or anchor items. The 17 matched items "was a sub-set of the content covered in the PrimTEd assessment" (Roberts, 2020, p. 130).
Data analysis
In the pre- and post-tests, all the items were single answer or multiple choice, and each item was recorded as correct, incorrect, or no response. The items were coded in relation to the content area. Item level data were summed to provide a score out of 50, which was converted to a percentage.
To answer the first research question-"How did the students in the second design cycle compare to the students in the first design cycle in relation to their attainment in the pretest?"-the mean and standard deviation of the pre-test were calculated.
The second research question-"How was the administration of the post-test assessments in Maths Intensive adjusted as a result of the Covid-19 pandemic?"-was answered by describing the changes to the post-test administration in comparison to how the post-test was administered in the first design cycle. Given that both authors were involved in arranging the test in both cycles this was a description from memory by the first author, which was then checked for accuracy and edited by the second author.
Answering the third research question-"What does the post-test data (that was not invigilated) reveal about what students in the second design cycle know and can do in relation to how numbers work and interpreting and using flexible strategies for the four mathematical operations with whole numbers?"-required the most detailed analysis.
For the pre-test and the post-test, we calculated the mean and standard deviation using the total composite score. We calculated the differences from pre-test to post-test in each design cycle. This was to provide an indicative comparison. Because the 2020 post-tests were not administered under the same conditions, we did not use a t-test to establish the significance of the difference in means for the second design cycle.
To extract meaningful information from the test data we turned to the facility scores, which we calculated at item level. An item facility (IF) score provides the percentage of students who obtained an item correct. It is measured on a scale of 0 to 1 where IF = 0 means no students responded correctly, and IF = 1 means all students responded correctly. An IF of 0.4 means that 40% of students answered correctly. We calculated the facility scores for each item for the post-test in each design cycle. By reflecting on each question and examining the underlying construct, which we obtained from the assessment framework, as well as the facility scores from each cycle, we could infer the knowledge and skills needs of the students. To compare the difficulty levels of topic sections within a test we calculated the attainment for each student on each section and then found the average marks (expressed as a percentage) for each section.
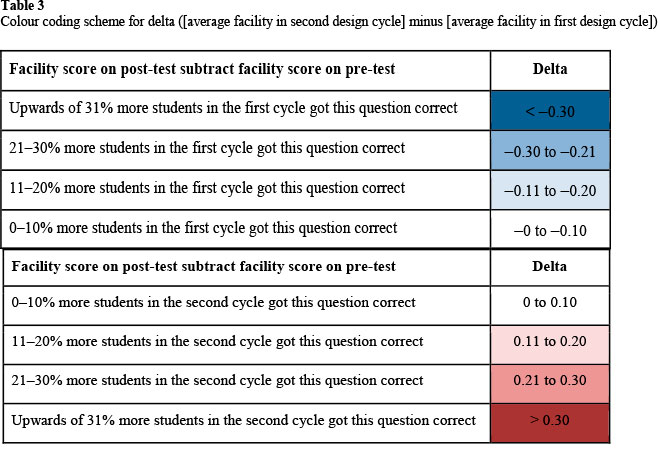
Of particular interest were the differences (delta = [1st cycle facility score] subtract [2nd cycle facility score]) in item facility scores from the first cycle to the second cycle (see Table 3). A negative delta means that more students in the first cycle got this item correct. A positive delta means that more students in students in the second cycle got the item correct. We used a colour coding scheme for the relative sizes of the delta.
Of interest was whether the students who wrote the post-test in the second cycle (where it was not invigilated) made use of calculator. The students in the first cycle in 2019 could not use a calculator when doing the post-test on campus under invigilated conditions. But in 2020, the students wrote the post-test remotely and we could not control whether they used a calculator or not. We could identify questions that could be answered easily using a calculator. An example of a question that can be answered more easily with a calculator is:
700 - 292 = . . .
An example of a question where access to a calculator is not helpful is:
Identify the approximate position of 706 on a number line marked from 700 to 800 in divisions of 10.
We assumed that students in the second design cycle would use calculators (which are easily accessible on smart phones) and thus would find these questions easier than the students in the first design cycle. To empirically check on our assumption that students would find these questions easier (most likely due to the greater calculator use) in the second cycle, we calculated the difference (delta) in facility scores for each design cycle. We expected a larger delta, with a greater proportion of second cycle students answering correctly, for items where calculator use would assist accuracy.
Findings
In this section, we answer each of the research questions in turn.
How did the students in the second design cycle compare to the students in the first design cycle in relation to their attainment in the pre-test?
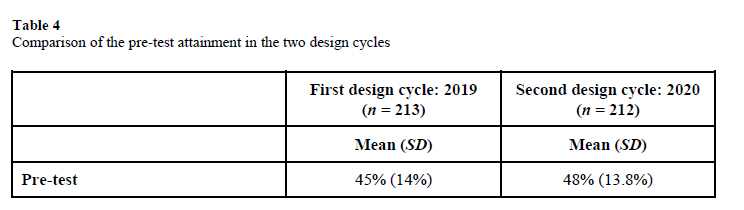
Table 4 provides the mean and standard deviations for each of the assessments administered in the first and second design cycles.
The 2020 cohort of learners performed slightly better (M = 48%, SD = 13.8%) in the pre-test than their peers in the 2019 cohort did (M = 45%, SD = 14.0%). The pre-tests results were similar and both were administered under invigilation conditions in a computer laboratory prior to the start of their BEd programme.
In 2020, how was the administration of the post-test assessment in Maths Intensive adjusted because of the Covid-19 pandemic?
Both cohorts of students wrote the same post-test after the intervention. For the students in the first design cycle, the post-test was administered under invigilated conditions one month after the one-week Maths Intensive course. For the students in the second design cycle, the post-test was administered during the Covid-19 pandemic. As a result, this test was not invigilated but completed by the students remotely within a one-hour time period. It was also conducted four months after the one-week intervention. This impacts on the analysis of results because it is possible that students may have used a calculator (where this was not allowed in the invigilated assessments). It was also possible that students communicated with each other about the test items.
There were several aspects of the post-test administration that were designed to mitigate against student collaboration. First, the order in which the questions appeared in the test was randomised for each student. Second, for multiple-choice questions the order of the options (A, B, C, and D) was randomised. This was intended to make collaboration on questions by number more difficult. A testee could not confer with a fellow testee by referring to Question X as having the answer of Option Y. Instead, to collaborate, they would have to refer to the question stem and the actual options.
Third, the students were given a 24-hour period in which to complete the post-test. This was done for two reasons. The students were given data by the university, but their data bundles were cheaper outside office hours. Several students therefore opted to write the test between 18h00 and 06h00 to save on data costs. In addition, there was a risk of students experiencing load shedding (and so not having access to electricity for their device and their internet connection). The load-shedding timetables were known and impacted on different geographic locations at different times. A student could plan to take the test in the 24-hour window at a time when they had electricity.
Finally, the test was timed for a maximum of one hour. Once a student started the assessment, they had to finish it within that hour. This was intended to discourage collaboration given that there was a limited time to respond. In cases where students lost power, the test interface saved their work, and they could continue after the interruption and the clock counted down from their last log in. This feature was not communicated to the students prior to the test. It was intended to be invoked should a student suddenly lose access to electricity.
We also made some adjustments to the test design to accommodate the fact that students working remotely may use either a computer or a mobile device. Previously-because the students wrote the test in a university computer lab-we knew they were using a computer. So we made sure that the test was designed to be interoperable between a computer screen and mobile handset. The images used were scaled for visibility on a mobile screen. This influenced the test layout because, in considering students who might be using mobile handsets to access the test, horizontal layout was minimised. By way of example, instead of presenting options in a table by displaying options in a row, a vertical column format was used. This is because on a mobile device it not possible to scroll from left to right but only from top to bottom.
What do the 2020 mathematics post-test (and pre-test) data reveal about what students in the second design cycle know and can do?
Focusing on the pre-test result provides us with some information about the mathematics knowledge and skills of the students as they enter the BEd programme. In particular, it shows us whether the second cohort (2020) was similar to, or different from, the first cohort (2019). Table 5 compares attainment in the pre-test and post-test for the two design cycles:
We therefore turn to analysing the assessment data to establish what the students know and can do in relation to the learning outcomes. We consider the relative difficulty evident across each topic within the post-test, and analyse the shift (delta) in facility scores for each item from the pre-test to post-test period for the two cycles (Table 6).
Regarding Additive relations, there was very little change (1 percentage point) in the proportion of students who got questions correct for this topic. There were greater improvements evident for the second design cycle; when considering How numbers work, the average attainment improved by 8 percentage points and for Multiplicative reasoning, there was an improvement in average attainment of 12 percentage points. If one assumes that the change in administration of the test (which was not invigilated for the 2020 cohort) was uniform across the three topic areas, one may infer that there was better learning in relation to multiplicative reasoning and how number works in the second intervention cycle. However, this claim is made cautiously, given the confounding effect of the change in administration (which may not have been uniform across the test).
We turn now to considering the item facility in relation to particular learning outcomes within each topic. This level of analysis provides information about how each cohort of students responded to the questions in the test at item level. It can be used to make claims about what the 2020 students know and are able to do (when they are not under invigilated conditions).
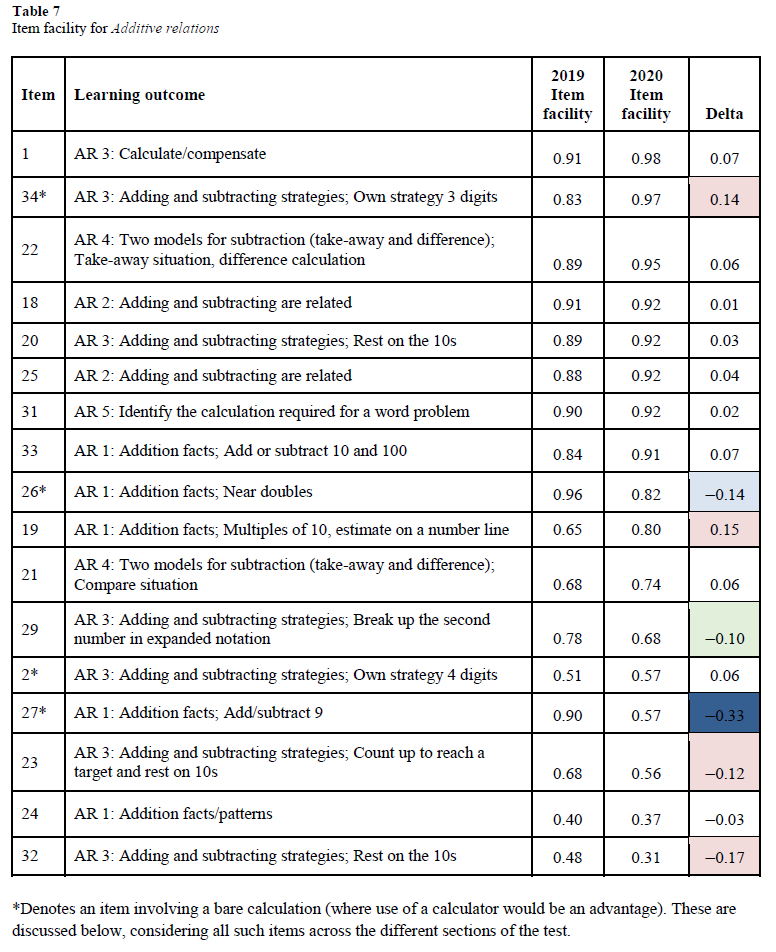
We first consider the item facility for additive relations (AR). The average attainment for this section was 76%. In the first design cycle the average attainment was 77%. So there was very little change from the attainment of the first design cycle. There were several assessment criteria of relevance to this topic:
• AR 1: Addition facts:
a. Add or subtract 10 and 100 from any number
b. Near doubles
c. Multiples of 10
d. Add or subtract 9.
• AR 2: Addition and subtraction are related.
• AR 3: Addition and subtraction strategies:
e. Rest on the 10s
f. Count up to reach a target and rest on 10s
g. Break up the second number in expanded notation
h. Break up the second number using the medium and small number sequence
i. Compensation.
• AR 4: Two models for subtraction (take-away and difference).
• AR 5: Identify the calculation required for a word problem.
Table 7 reveals that the majority of students in both intervention cycles (item facility of more than 0.9) were are able to:
• Apply the two models of subtraction-take away and difference-(AR 4).
• Know that adding and subtracting are related, and write equivalent number sentences for the same additive relation (AR 2).
• Use the "rest on the 10s" strategy (AR 3).
• Calculate by compensation (AR 3).
However, in the second intervention cycle calculating by compensating was not yet mastered for 43% of the students who could not correctly subtract 9 (AR 1). Subtracting 9 can be done using compensation given that one can subtract 10 and then add 1. So, although they could ensure that both sides of an equal sign were equivalent (by compensating) they could not yet apply this skill to subtracting 9. This is despite the vast majority of them being able to add or subtract 10 which is a pre-requisite skill for subtracting 9 by compensating.
Considering the addition facts (AR 1) in the second design cycle, most students (> 80%) were developing accuracy with adding or subtracting 10 or 100 from any number (such as 43 + 10 = . . . ), near doubles (such as 16 + 17 = . . . ). These were question types where it would have been possible for the students in the second design cycle to use a calculator (and so we cannot infer that this is an improvement in mental arithmetic). That 80% of students in the second design cycle could estimate multiples of 10 on a number line is an encouraging finding. This estimation could not be done using a calculator.
Focusing on addition and subtraction strategies (AR 3), the students in the second design cycle were better able to use their own strategy for 3-digit numbers than for 4-digit numbers. This was consistent with the student responses from the first intervention cycle. There were greater proportions of students who could "break up the second number using expanded notation" than there were students able to "count up to, reach a target and rest on the 10s." Very few students (only 31% of the second cycle) were able to break up the second number to bridge or rest on the 10s in simple subtraction situation. For example, they were not able to select how to break up the second number (in this case 5) to rest on the 10 in a calculation such as 13 - 5 = . . . . The expected response was "subtract 5 is broken up into subtract 3 then subtract 2" because 13 - 5 = 13 - 3 - 2 = 10 - 2 = 8. This question was also difficult for the students in the first design cycle, suggesting that greater attention should be paid to this skill in future intervention cycles.
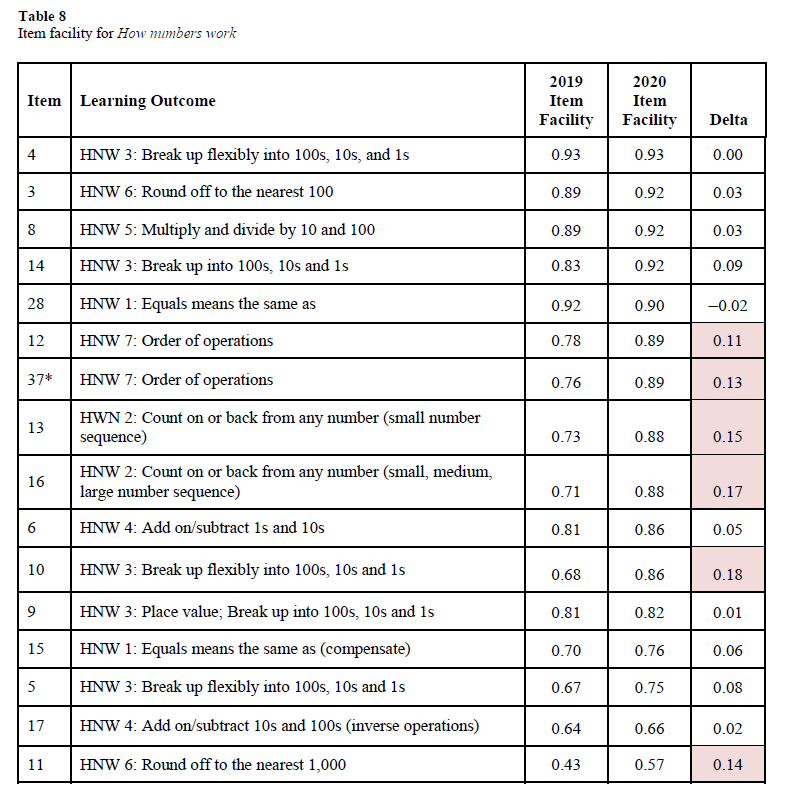
We now consider what can be learnt from the student responses to the post-test items pertaining to the topic of how numbers work (HNW). In this section, the average attainment improved by eight percentage points, from 76% in 2019 to 84% in 2019. There were six assessment criteria:
• HNW 1: Equals means "is the same as."
• HNW 2: Count on or back from any number in 1s, 10s, and 100s.
• HNW 3: Break up flexibly in 100s, 10s, and 1s.
• HNW 4: Add/subtract 10s and 100s.
• HNW 5: Multiply and divide by 10s and 100s.
• HNW 6: Round off the nearest 10, 100, and 1,000.
The relative difficulty of the items in this topic, noted in the second design cycle, largely reflected the same pattern as for the first design cycle. This is evident in Table 8 where all the deltas are less than or equal to 0.17.
By the end of the Maths Intensive course, most students in the second design cycle (more than 80%) demonstrated secure knowledge of place value (HNW 3), and were successfully able to respond to items relating to place value and breaking up numbers into 100s, 10s, and 1s. It should be noted that this included ordering 4-digit numbers from smallest to biggest. Students found it more difficult when working on flexible ways to break up numbers (such as 450 = 3 hundreds and 15 tens) although this was done better than in the first design cycle.
Most students in the second cycle (more than 80%) were able to work on missing number problems and apply the knowledge that equals means "is the same as" (HNW 1). They were able to round off to the nearest 100 (HNW 6), and apply knowledge of the order of operations (HNW 7). Their application of order of operations when working mentally is not known from this test. Most students were also making use of the small, medium, and large number sequences-counting on and back in 1s, 10s, and 100s from any number (HNW 2).
A sizable proportion of the students (> 30%) in the second design cycle were not able to work with inverse operations for adding and subtracting 10 and 100 (HNW 4) and rounding off to the nearest 1,000 (HNW 6), although they could round off to the nearest 100 (HNW 6).
The multiplicative reasoning (MR) topic saw the greatest improvement in attainment from the first to the second design cycle (Table 9). The average attainment improved by 12 percentage points, from 70% in 2019 to 82% in 2020. Multiplicative reasoning included attention to:
• MR 1: Multiplication is a group of something that is repeated.
• MR 2: Times table facts and divisibility rules.
• MR 3: Multiplication and division are inverses.
• MR 4: Sharing and grouping problems.
• MR 5: Distributive property.
• MR 6: Representing multiplication and division (using area and using clue boards).
• MR 7: Calculating with medium and large numbers (area model and using clue boards).
It was in the Multiplicative Reasoning learning outcome where the most substantial change in performance was evident when comparing the first to the second cycle. The majority of students (more than 80%) could correctly respond to items pertaining to multiplicative reasoning (MR 1-7).
A key concept in this section of work was using an area model for multiplication. This is a representation used in primary schools as an alternative to the long multiplication algorithm, which is known to be less error prone. It was new to the students in both design cycles. An example of multiplication using medium and large numbers, and which makes use of the area model is presented in Figure 2.
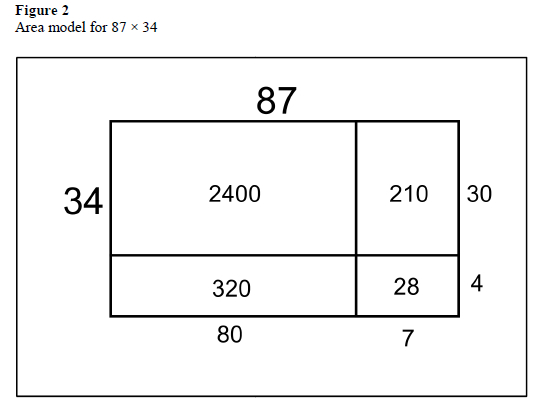
Most students who completed the second design cycle Maths Intensive course were able to use and interpret this multiplication method (MR 6).
Of particular interest was the apparent improvement in attainment by the students in the second cycle relating to division problems. This was evident in the substantial increases in item facility scores for the following:
• Sharing and grouping problems which are word problems involving division (MR 4).
• Times table facts involving divisibility rules; (MR 2).
• Using the distributive property for division (MR 5).
• Dividing with medium and large numbers (MR 7).
Only one of these four items (dividing with medium and large numbers, MR 7) would be easier when having access to a calculator, yet there were substantial increases (or more than 25% of students) in the proportions of students in the second design cycle who successfully answered these items. This is a promising finding with regard to the instructional design for the second design cycle. It requires further examination in relation to the changes made in instructional design.
However, Table 9 also revealed that there are several areas where students in the second design cycle were not yet proficient. They require further support and practice with multiplying large numbers (using their own methods and the area model, MR 6) and working with decimals (which was not given attention in the Maths Intensive course).
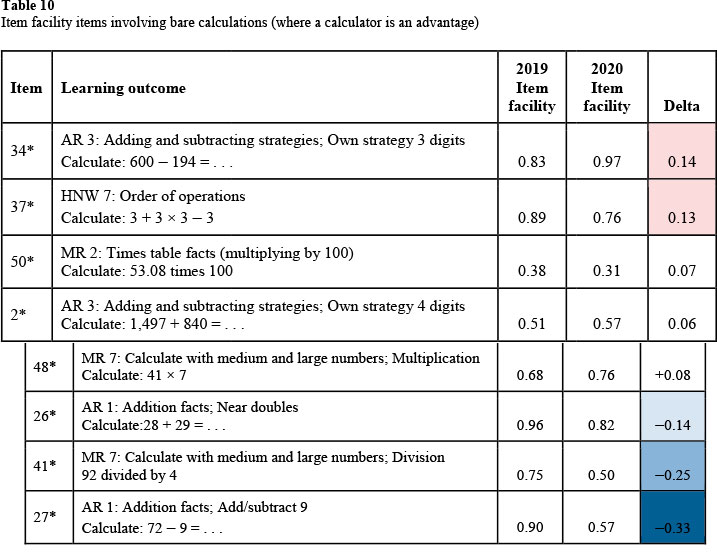
We now consider items where the students in the second design cycle may have been advantaged by using a calculator.
Looking across the learning outcomes (Table 10) there were five bare items where more students in the second cycle answered correctly compared to the first cycle:
• (1) AR 3: 600 - 194 = . . .
• (3) HNW 7: 3 + 3 χ 3 - 3
• (4) MR 2: 53.08 times 100
• (4) AR 3: 1,497 + 840 = . . .
• (5) MR 7: 41 χ 7 = . . .
These are the items that support the assumption that students in the second cycle used a calculator when writing the test remotely. However, looking at the item facility scores for MR 2 (53.08 times 100; IF = 0.31) and AR 3 (1,497 + 840 = . . . ; IF = 0.57), the majority of the students in 2020 were not able to answer these correctly. All of these bare calculation items could have been done accurately with a calculator, simply by pressing the digits and operation symbols in the order provided, on the calculator. It seems that whereas some students in the second design cycle may have used a calculator, it was not the majority of students. If they had all used a calculator, the item facility on the bare calculation items would have been higher.
And there is further empirical evidence that students in the second design cycle seem unlikely to have used calculators. There are a further three bare calculation items where the students in the second design cycle obtained fewer correct answers, when compared to the first cycle:
• (1) AR 1: 28 + 29 = . . .
• (2) MR 7: 92 divided by 4
• (3) AR 1: 72 - 9 = . . .
The students in the second design cycle were less successful than their first cycle peers. The very low item facilities of 50% of students answering correctly for division calculation, and 57 % answering correctly for the subtraction problem, suggest that calculators were not widely used.
Conclusion
This paper describes how results from a mathematics assessment was applied to develop and apply the Maths Intensive module in an initial teacher education programme, and how adjustments had to made to the assessment practices as a result of the Covid-19 pandemic. In particular, it demonstrates how, by mapping each assessment item to a learning outcome and analysing shifts in attainment at item level, effective ways of converting raw data into information that could inform decision-making were found-leading to meaningful reporting (Moloi & Kanjee, 2018). This demonstrated a shift in the purpose of assessment from measuring impact to informing course design and so ultimately, to improving learning and teaching.
Responding to evidence of poor performance in the PrimTEd mathematics assessment, the Maths Intensive course was trialled with first-year students in Bachelor of Education programmes (Foundation Phase and Intermediate Phase) at a comprehensive university. For the first design cycle, a pre-test/post-test design was used to establish the impact of the intervention on learning. The results were promising. The second design cycle was interrupted by Covid-19 and consequently, this design loop was not possible to complete in terms of impact. However, the post-test assessment was used to investigate in some detail what the post-test data revealed about what students knew and could do. Their relative attainment in each topic area was calculated. Because the test was designed against the articulated learning outcomes, it was also possible to reflect on relative attainment by learning outcome.
It was clear that there were more substantial learning gains in the second intervention cycle in relation to the topic focus on multiplication and division (compared to how numbers work and additive relations). There was clear evidence of improvements in relation to use of the area model for multiplication. Reasons for this should be investigated further by attending to the changes in materials design and pedagogy that took place from the first to the second design cycle. This use of the post-test data was useful in that is provided meaningful information to guide detailed and targeted examination of the instructional design changes to inform the future course design.
This paper also reported how the Covid-19 pandemic impacted on the administration of the post-test. Because students were not allowed onto campus, this test was administered remotely. The changes made to the online test design in relation to the sequencing of questions, sequencing of multiple-choice options, and allowing a 24-hour period to respond to the test were documented. Concerned that the shift in administration from invigilated (in the first design cycle) to un-invigilated (in the second design cycle), we did not use the posttest as a basis for comparing the impact of the second design cycle compared to the first.
We assumed that the second design cycle test would be found to be easier by students, given its un-invigilated administration. We examined the bare calculation items that could have been answered correctly simply by pressing the calculator keys in the order provided.
However, there were clear examples where a calculator could have been used but the majority of students still found three of the bare calculation items item difficult. This suggests that the assumption of calculator use and collaboration in un-invigilated settings may not be substantial, or that students-even when they could use a calculator-did not use it correctly. Further research is required on this issue. Testing the assumptions made about student behaviour (if they will cheat by collaborating or by using a calculator) will be important for lecturers making choices about online and remote testing.
Using the item facility scores at item level, it was still possible to obtain meaningful information about relative performance, weighing up attainment in particular topics, and considering the learning outcomes for which there were the greatest and smallest shifts in attainment. We have drawn on the assessment data from this analysis to further improve our instructional design and our assessment design. We trust that others responsible for developing mathematics knowledge for primary teaching in initial teacher education will find the assessment exemplars and learning outcomes useful. Considering a broader interest in assessment design and practices, this article provides an example of how assessment data has been used to create meaningful reports, as well as how assessment practices had to adjust to the Covid-19 pandemic.
Acknowledgements and conflicting interests
This paper has been developed through the Teaching and Learning Development Capacity Improvement Programme (TLDCIP), which is being implemented through a partnership between the Department of Higher Education and Training and the European Union. The authors acknowledge and thank all the ITE institutions and colleagues in mathematics who have contributed, and continue to contribute, to the PrimTEd assessment work stream.
References
Bowie, L., Venkat, H., & Askew, M. (2019). Pre-service primary teachers' mathematical content knowledge: An exploratory study. African Journal of Research in Mathematics, Science and Technology Education, 23(3), 286-297. https://doi.org/10.1080/18117295.2019.1682777 [ Links ]
Fonseca, K., Maseko, J., & Roberts, N. (2018, June 25-29). Students' mathematical knowledge in a bachelor of education (Foundation or Intermediate Phase) programme [Paper presentation]. 24th annual national congress of the Association for Mathematics Education of South Africa, University of the Free State, Bloemfontein, South Africa.
Moloi, M., & Kanjee, A. (2018). Beyond test scores: A framework for reporting mathematics assessment results to enhance teaching and learning. Pythagoras, 39(1), Article 393. https://doi.org/10.4102/pythagoras.v39i1.393 [ Links ]
Moloi, Q., Kanjee, A., & Roberts, N. (2019). Using standard setting to promote meaningful use of mathematics assessment data within initial teacher education programmes. Pythagoras, 40(1), Article 493. https://doi.org/10.4102/pythagoras.v40i1.493 [ Links ]
Roberts, N. (2020). Maths Intensive: First design trial in response to PrimTEd mathematics assessment. In P. Vale, L. Westerway, Z. Nhase, & I. Shudel (Eds.), Proceedings of the 28th Annual Conference of the Southern African Association for Research in Mathematics, Science and Technology Education (pp. 126-142). SAARMSTE.
Roberts, N., Mostert, I., Kakoma, L., Maseko, J., Fonseca, K., Libusha, E. (2020). Maths Intensive course. University of Johannesburg, Centre for Education Practice Research (CEPR).
Stein, M. K., Grover, B. W., & Henningsen, M. (1996). Building student capacity for mathematical thinking and reasoning: An analysis of mathematical tasks used in reform classrooms. American Educational Research Journal, 33(2), 455-488. [ Links ]
Venkat, H., Bowie, L., & Alex, J. K. (2017, October 22-26). The design of a common diagnostic mathematics assessments for first-year BEd students [Presentation]. South African Education Research Association (SAERA) Conference, Port Elizabeth, South Africa.
Wang, F., & Hannafin, M. (2005). Design-based research and technology-enhanced learning environments. Educational Technology Research and Development, 53(4), 5-23. http://dx.doi.org/10.1007/BF02504682 [ Links ]
Received: 27 October 2021
Accepted: 5 February 2022

