


Services on Demand
Article
 English (pdf)
 Article in xml format
 Article references
Indicators

Related links
-
 Cited by Google
 -
 Similars in Google
Share

 Permalink
Journal of Education (University of KwaZulu-Natal)
On-line version ISSN 2520-9868
Print version ISSN 0259-479X
Journal of Education n.70 Durban 2017
RESEARCH ARTICLES
The relationship between school-leaving examinations and university entrance assessments: The case of the South African system
Robert Prince
University of Cape Town. Robert.Prince@uct.c.za
ABSTRACT
Many higher education systems across the globe struggle with the challenges of low throughput rates and high dropout rates. It is estimated that more than half of South African Higher Education students drop out before completing their degree studies and only one in four students complete their undergraduate programmes in regulation time. Access, success and completion rates continue to be racially skewed. The challenges of these low throughput and high dropout rates along racial lines means that effective teaching and learning has to be a major focus for the higher education sector. In addition, extended degree programmes, where degrees are formally done over a longer period of time, have to be considered as part of the future higher education landscape in South Africa. One difficulty is determining which students will benefit from an extended programme. In South Africa there are two assessments of school-leavers that are pertinent to this difficulty. The first is the national school leaving examination, the National Senior Certificate (NSC), which is a statutory requirement for entry into Higher Education. The results of the NSC are norm-referenced (they yield an estimate of the position of the tested individual learner in relation to her peers) and are often difficult to interpret for the purposes of admission, placement and curriculum development. The second assessment is the National Benchmark Tests (NBTs). The NBTs are criterion-referenced (they generate a statement about the behaviour that can be expected of a person with a given score) and test students in three domains: Academic Literacy, Quantitative Literacy and Mathematics. This paper investigates the empirical relationship between the two assessments and argues that they should be seen as complementary in order to address the challenges of placing students in appropriate programmes and creating effective teaching and learning environments.
Introduction
Many higher education systems across the globe struggle with the challenges of low throughput rates and high dropout rates (Prince, 2016). In South African higher education, only 27% of entering students graduate in minimum time and 55% of those entering students never graduate. It is estimated that 40% of graduates take up to two years more than the minimum time for their degree studies (Scott, Yeld and Hendry, 2007; Council on Higher Education, 2013). The poor retention rates, in the order of 45%, exacerbate the problem of students taking longer than the minimum time. Typically, extended degree programmes structure the curriculum in such a manner that students can do their degree studies over the minimum time plus one year. A challenge is how best to identify students that would benefit most from either an extended, or a regular, degree programme. In South Africa, there are two assessments that contribute information for this purpose. The first is the National Senior Certificate (NSC) which is a statutory requirement for entry into higher education. The results of the NSC are often difficult to interpret for the purposes of higher education. The second is the National Benchmark Tests (NBTs) Project (Griesel, 2006). One of the NBTs project objectives is to assess the relationship between entry level proficiencies and school-level exit outcomes (Griesel, 2006, p. 4). The NBTs' conceptualisation, design and implementation make it well placed to provide information for the purpose of placement and curriculum development (Prince, 2016).
Not only the content that is taught at school is essential for performing well in South African higher education. The cognitive abilities and skills underlying the school curriculum content that are learned in one context and are believed to be transferable to another are also important. The NBTs are thus designed to provide information about these abilities and skills which the South African higher education sector requires, in order to make decisions about the most appropriate curriculum structures for students. In Prince (2016) it is argued that ranking applicants for selection is important, but placing students in appropriate curriculum structures which take into account what students can and cannot do is more important; and that the criterion-referenced information gained through the NBTs complements the NSC norm-referenced assessments to be used as a credible and valid mechanism for placing students in the two different curricular routes. In this paper, the NSC subject scores and NBT domain scores achieved by prospective 2016 higher education entrants are used to investigate the relationship between entry level proficiencies (NBT) and school level outcomes (NSC).
The criterion-referenced and the norm-referenced assessments
The two sets of assessments written by prospective students in higher education in South Africa are fundamentally different in terms of purpose, intentions, design and manner of delivery. The National Benchmark Tests are criterion-referenced, which means that they are "constructed to provide information about the level of a test-taker's performance in relation to clearly defined domains of content and/or behaviours (e.g. reading, writing, mathematics) that require mastery" (Foxcroft 2006, p. 9) while the National Senior Certificate examinations are norm-referenced, which means that performance in a particular year is normed to a 'norm group'. Norm-referenced tests are designed to sort and rank students, usually 'on a curve'. The National Senior Certificate determines the extent to which scholars are ready to exit the school system while the National Benchmark Tests determines the extent to which prospective higher education students are ready for the demands of higher education. Norm-referenced and criterion-referenced approaches to assessment should not be seen as a binary choice fraught with tension; rather, the two should be seen as compatible and complementary (Lok, McNaught and Young, 2016).
The norm-referenced National Senior Certificate
The NSC assessments are norm referenced and therefore cannot easily be used to assess the extent to which candidates meet a certain standard in a subject or domain. For the NSC, the raw examination scores are 'standardised' or 'normed' to the 3 to 5 year rolling average score for each subject. After this the school based assessment is statistically moderated by comparing the means of the school based assessment to that of the examination scores and the final score combines the standardised examination mark to the statistically moderated school based assessment in the ratio of 75:25. So, while a candidate may perform well overall, it may be difficult to understand the actual competence in the subject being tested. The Department of Basic Education (DBE) approved the achievement scale for NSC subjects (DBE, 2009, p.5) given in Table 1 below, and the descriptions against the rating codes are not benchmarks or standards that are set through a standard setting exercise, but rather descriptive labels of percentage score ranges.

On completing the NSC, a candidate can qualify for higher certificate, diploma or degree study. Table 2 describes the criteria, from the DBE (2009, p. 5), for entry into Higher Certificate, Diploma or Degree Study that are used in South Africa.
Language learning in Grades 10-12 of the NSC includes the eleven official languages in South Africa, namely, Afrikaans, English, isiNdebele, isiXhosa, isiZulu, Sepedi (Sesotho sa Leboa), Sesotho, Setswana, Siswati, Tshivenda, Xitsonga, as well as non-official languages. These languages can be offered at different levels. However, many South African schools do not offer the home languages of some or all of the enrolled learners but rather have one or two languages offered at 'Home Language' level. As a result, the labels 'Home Language' and 'First Additional Language' refer to the proficiency levels at which the language is offered and not the native (Home) or acquired (as in the additional languages) language of the learner. Currently only English and Afrikaans are used as Languages of Learning and Teaching in South African higher education.
The Home Language level provides for language proficiency that reflects the mastery of basic interpersonal communication skills required in social situations and the cognitive academic skills essential for learning across the curriculum. Emphasis is placed on the teaching of listening, speaking, reading and writing skills at this language level.
The First Additional Language level assumes that learners do not necessarily have any knowledge of the language when they arrive at school. By the time learners enter Grade 10, they should be reasonably proficient in their First Additional Language with regard to both interpersonal and cognitive academic skills. However, the reality is that many learners still cannot communicate well in their Additional Language at this stage. The challenge in Grades 10-12, therefore, is to provide support for these learners at the same time as providing a curriculum that enables learners to meet the standards required in Grade 12. These standards must be such that learners can use their Additional Language at a high level of proficiency to prepare them for further or higher education or the world of work.
All NSC candidates must also write the examinations for either Mathematics or Mathematical Literacy, which are both cognate with, but not the same as, the NBT mathematics and quantitative literacy, as can be seen from the descriptions of them in the National Curriculum Statement (NCS) Curriculum and Assessment Policy Statement (CAPS) documents.
The NCS CAPS document for the Mathematics subject defines Mathematics as
a language that makes use of symbols and notations for describing numerical, geometric and graphical relationships. It is a human activity that involves observing, representing and investigating patterns and qualitative relationships in physical and social phenomena and between mathematical objects themselves. It helps to develop mental processes that enhance logical and critical thinking, accuracy and problem solving that will contribute in decision-making. Mathematical problem solving enables us to understand the world (physical, social and economic) around us, and, most of all, to teach us to think creatively (DBE, 2011a, p.8).
The focus on problem-solving and critical thinking in order to understand real-world phenomena, has strong similarities with the definition of quantitative literacy, but the main focus of the subject is in fact on learning the discipline of mathematics itself in order to ensure "access to an extended study of the mathematical sciences and a variety of career paths" (DBE, 2011a, p.10).
On the other hand, the NCS CAPS for Mathematical Literacy states that the competencies developed through it should
allow individuals to make sense of, participate in and contribute to the twenty-first century world - a world characterised by numbers, numerically based arguments and data represented and misrepresented in a number of different ways (DBE, 2011b, p.8).
It further suggests that these competencies, which include the ability to reason, solve problems, interpret information and use technology, should be developed by exposing learners to both elementary mathematical content and authentic real-life contexts. This exposure is intended to enable the learner to be a "self-managing person, a contributing worker and a participating citizen in a developing democracy" and an "astute consumer of the mathematics reflected in the media (DBE 2011b, p.8)". The emphasis on using mathematical knowledge and skills in context is what makes this subject similar to quantitative literacy, but for higher education the contexts are academic disciplinary contexts, not necessarily everyday life-related contexts, as emphasised in the NSC CAPS document for Mathematical Literacy.
The school-leaving assessment, the National Senior Certificate, has been described as a set of norm-referenced assessments which aim to deliver statutory information for higher education admission. The criterion-referenced National Benchmark Tests with its benchmarked categories of performance for formal study at institutions of higher learning will now be described.
The criterion-referenced National Benchmark Tests
The NBTs are based on academically researched test specifications and use modern test theories (Yen and Fitzpatrick, 2006) to determine test scores. They use criterion-referenced benchmarks set through the modified Angoff standard setting method to place candidate scores in proficiency bands which describe both their preparedness for the demands of higher education and the extent to which the curricula should be responsive to the preparedness of the candidates they do admit. The NBTs assess students and prospective students in the three domains of Academic Literacy; Quantitative Literacy and Mathematics in the languages of instruction, namely English and Afrikaans.
The Academic Literacy test assesses a students' capacity to engage successfully with the language demands of academic study. The test is an assessment of the generic academic reading and reasoning ability of prospective applicants. The construct of academic literacy (Cliff and Yeld, 2006) on which the test is based has a well-theorised history (Bachman and Palmer, 1996; Cummins, 2000; Yeld, 2001; Cliff, Yeld and Hanslo, 2003) and empirical studies have been reported exploring associations between performance on this construct and academic performance in a wide range of South African higher education contexts (Cliff, Ramaboa and Pearce, 2007; Cliff and Hanslo, 2009).
The Quantitative Literacy test assesses a students' ability to manage situations or solve problems of a quantitative (mathematical and statistical) nature in real contexts relevant to quantitative disciplines in higher education (Prince and Archer, 2008; Prince and Simpson, 2016). The definition of quantitative literacy and the construct which underpins the NBTs Quantitative Literacy test (Frith and Prince, 2006; Frith and Prince, 2009) is strongly influenced by the definition of numerate behaviour underlying the assessment of numeracy in the Adult Literacy and Lifeskills (ALL) Survey (Gal, Van Groenestijn, Manly, Schmitt & Tout, 2005, p.152) and the New Literacies Studies' view of literacy as social practice (Street, 2005; Street & Baker, 2006; Kelly, Johnston & Baynham, 2007).
While the Academic Literacy and Quantitative Literacy assessments are generic in nature the Mathematics test assesses a students' ability related to mathematical concepts formally part of the School Mathematics curriculum relevant to the subject Mathematics itself and disciplines such as Physics and Chemistry which require mathematics. The Mathematics assessment therefore assesses the degree to which learners have achieved the ability to do manipulations, synthesise a number of different mathematical concepts, and draw strictly logical conclusions in abstract symbolic contexts (Bohlmann and Braun, 2006). These higher-order skills underlie success in higher education mathematics.
The Academic Literacy, Quantitative Literacy and Mathematics assessments make use of multiple choice items that are mapped onto the respective test specification tables. Responses are scored using the unidimensional three-parameter (a, b, c) Item Response Theory (IRT) model, where a = discrimination, b = difficulty, and c = guessing/pseudo-chance (Yen and Fitzpatrick, 2006).
Academic Literacy, Quantitative Literacy and Mathematics items are scored dichotomously, that is either as right or wrong. Each different form of the three assessments contains common items for equating purposes (Holland and Dorans, 2006) to ensure that performance on different versions of the test is comparable. The standard-setting method that is employed to determine the benchmarks is the modified Angoff method (Hambleton and Pitoniak, 2006). In the modified Angoff method panellists of experts are asked to estimate independently the probability that the borderline candidate (a candidate believed to be located at a performance standard of interest) will answer each item correctly; those probabilities are summed over items for each panellist to arrive at a panellist performance standard, and then these panellist performance standards are averaged to obtain a performance standard for the panel on the test. The process is repeated for all performance standards of interest. Basically, the panellists are estimating the expected standard or cut-score or benchmark of the borderline candidate on each item and then these expected item scores are summed to obtain an estimated true score for the borderline candidate on the collection of test items. The panelist's estimated true score on the test for the borderline examinee is taken as the panelist's estimate of the performance standard.
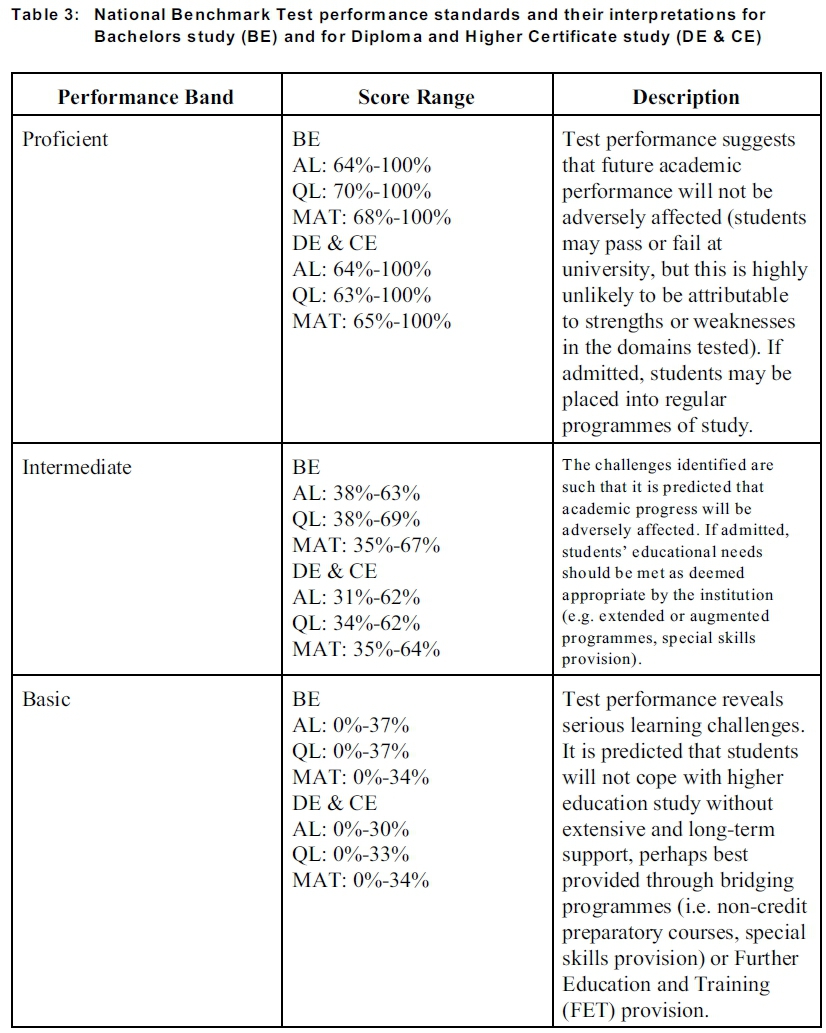
Table 3 provides a description of the Academic Literacy (AL), Quantitative Literacy (QL) and Mathematics (MAT) benchmark levels defining proficiency levels for degree, diploma and higher certificate study, the score ranges and suggested institutional responses to candidates performing at these levels.
Since the majority of the South African higher education cohort scores place students in the Intermediate band, it has been found productive to divide the Intermediate performance band into two, the Intermediate Upper and Lower bands. It is important to note that this division was not done through the standard-setting exercise but rather through taking the mean value of the top and bottom of the 'Intermediate' interval values.
This brief overview of differences between the two assessment systems explicates the complementary nature of norm-referenced tests such as the NSC and criterion-referenced tests such as the NBTs.
The case of the prospective candidates for higher education in South Africa in 2016
Data from 72 517 candidates who wrote both the NSC and NBTs in 2015 for entry into higher education in 2016 will be used to explore the empirical relationship, including complementarity, between the two assessments.
After providing the background characteristics of the entire sample, the overall distribution of scores for prospective higher education candidates who wrote the NSC and NBTs assessments is presented. Firstly, to investigate the relationships between the two assessments correlation analysis is used to look at the concordant and divergent relationships. Secondly, Linear regression is used to explore the linear relationships between the three NBT domains and the NSC subjects cognate to them. Lastly, Bland Altmann plots are used to further explore the relationships between the three NBTs and their four cognate NSC counterparts. The Bland Altman method and the associated plots make the differences between two measurements visually apparent.
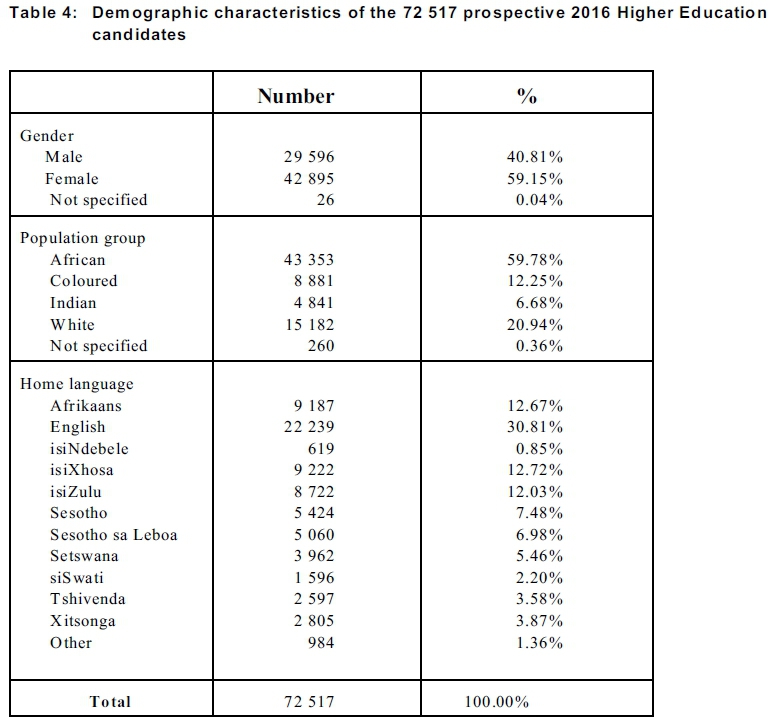
Demographic information of the candidates was obtained through questionnaires and relied on self-reporting. Some of these self-reported demographic characteristics of this sample are shown in Table 4. There were more female than male candidates (59.15%) in this sample. The majority of candidates were African (59.78%) and candidates for whom English was reported as the home language amounted to just under a third (30.81%).
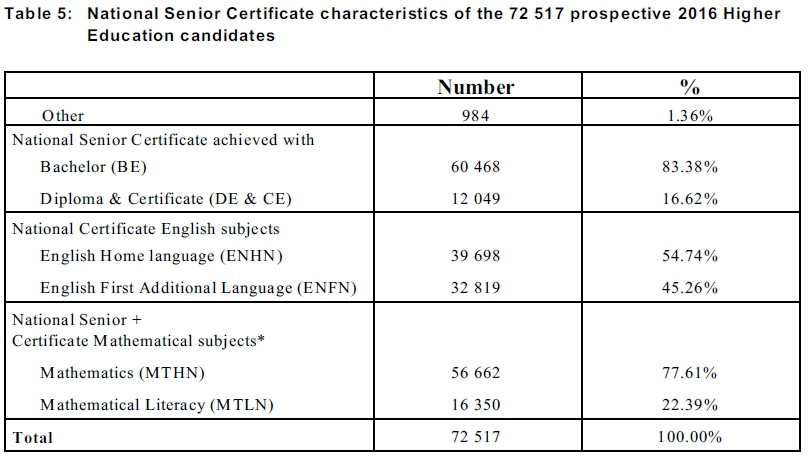
From Table 5 it can be seen that the vast majority (83.38%) of candidates achieved the NSC with a Bachelors pass. Just above half (54.74%) wrote the NSC English Home language assessment. Above three quarters of the candidates (77.61%) wrote the NSC Mathematics assessment.
Table 6 shows how the students performed on the four NSC assessments cognate with the three NBTs and Table 7 shows how the scores of the sample of candidates were distributed among the NSC rating codes.
It is clear that nearly three-quarters of prospective entrants achieved the NSC at level five and above in English, while nearly two-thirds (65.5%) achieved the NSC at level 5 and above in Mathematics. These results would suggest that the majority of these candidates would be able to cope with the Language and Mathematics demands of higher education.
It is clear that nearly three-quarters of prospective entrants achieved the NSC at level five and above in English, while nearly two-thirds (65.5%) achieved the NSC at level 5 and above in Mathematics. These results would suggest that the majority of these candidates would be able to cope with the Language and Mathematics demands of higher education.
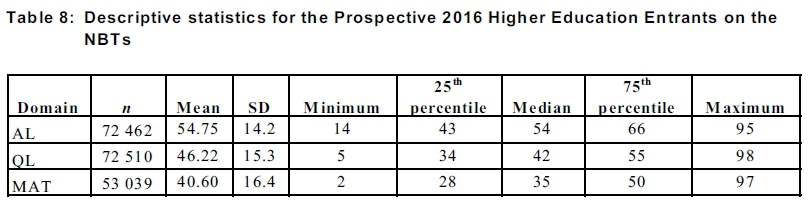
Table 8 shows how the prospective students performed on the NBTs.
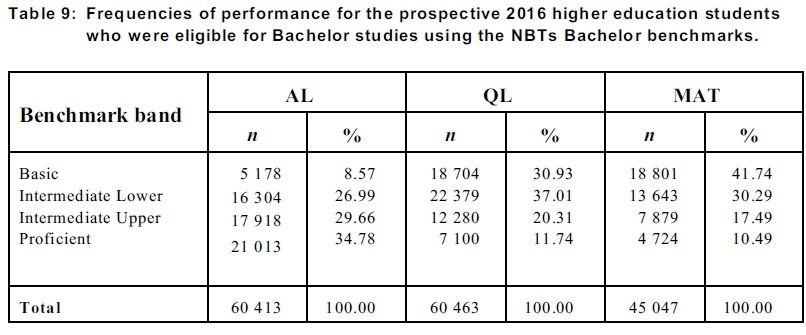
Table 9 shows the distribution of scores of the sample of candidates who achieved a Bachelors NSC pass. Only about a third (34.78%) were classified as proficient in Academic Literacy, while just above ten percent (11.74%) were classified as proficient in Quantitative Literacy and only about ten percent (10.49%) were considered proficient in Mathematics. Most of the candidates had scores in the Intermediate band: 56.65% for AL, 57.32% for QL and 47.78% for Mathematics. These results suggest that the majority of these candidates would have needed some kind of extended support in Mathematics, more than half would have needed supplementary support in Quantitative Literacy and about a third would have required supplementary support in Academic Literacy.
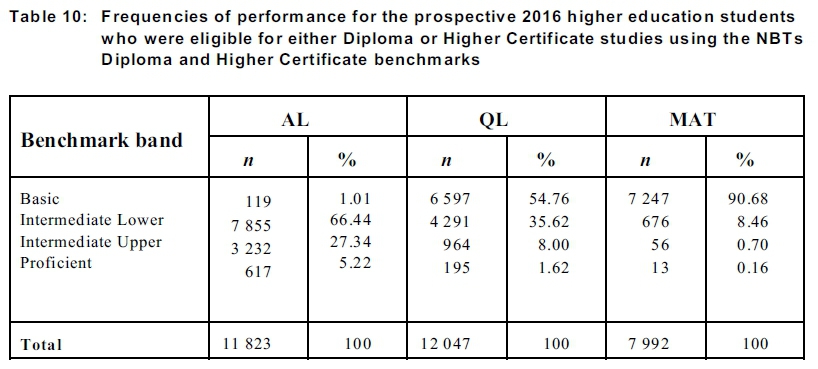
Table 10 shows the distribution of the scores of the sample of candidates in the Diploma and Higher Certificate proficiency bands for those who achieved a Diploma or Higher Certificate NSC pass. The majority (66.44%) were classified as intermediate lower in Academic Literacy, while above fifty percent (54.76%) were classified as basic in Quantitative Literacy and just above ninety percent (90.68%) were considered basic in Mathematics. Most of the candidates had scores in the Intermediate Lower and Basic bands: 67.45% for AL, 90.38% for QL and 99.14% for Mathematics. These results suggest that the majority of these candidates would have needed extensive support in all three domains.
The relationships between the two sets of assessments will now be examined to ascertain whether they are convergent (provide similar information) or divergent (provide different information).
Relationships between the two sets of assessments
Firstly, correlation analysis is used to investigate the convergent and discriminant, also called divergent, validity. Secondly, scatter plots and Bland Altman plots are used to investigate the relationships between scores on the NSC assessments that are cognate to the three NBTs.
Correlation analyses: The convergent and discriminant relationships
Convergent validity is the degree to which a test is similar to (converges on) other cognate tests to which it should theoretically be similar. Discriminant validity on the other hand is the degree to which a test is not similar to (diverges from) other tests to which it should theoretically not be similar. The Pearson linear correlation coefficient is used to measure the extent of convergent and discriminant validity.
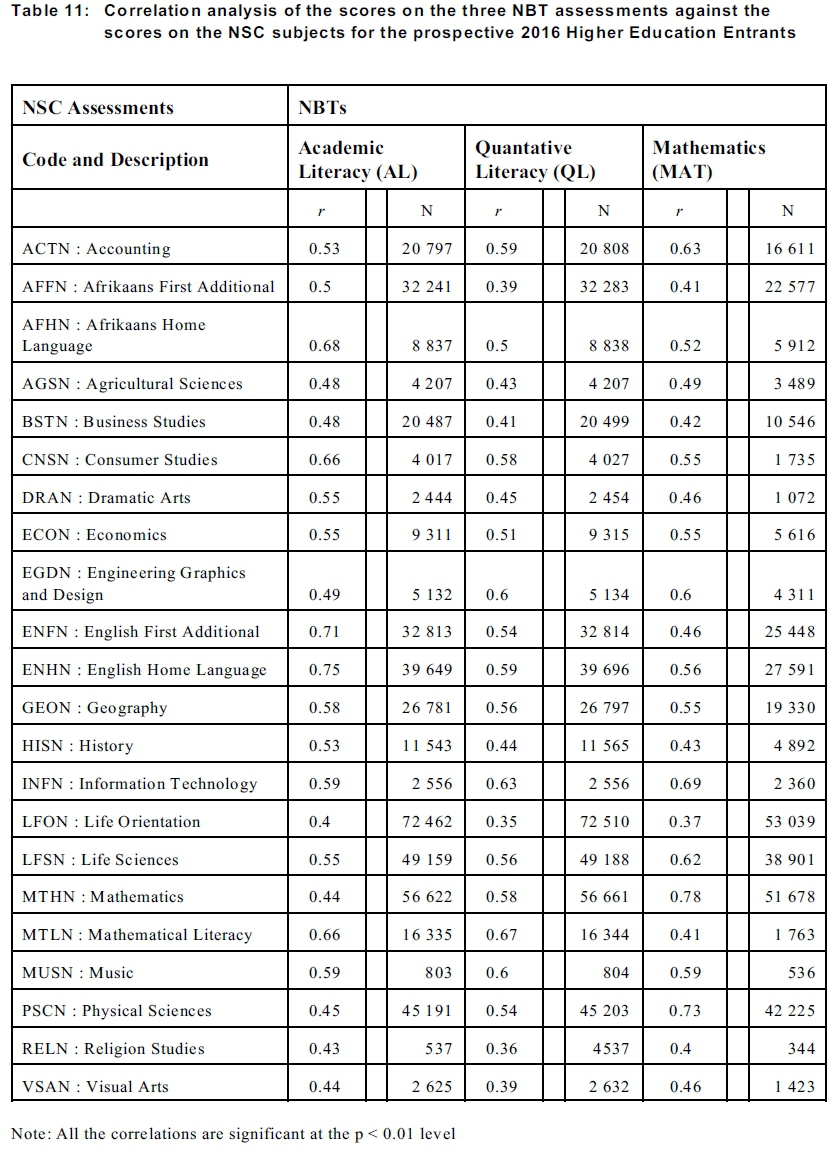
The Pearson correlation coefficient,  is a scale-free measure that assesses the degree to which two variables X and Y are linearly related (Wonnacott and Wonnacott, 1969). It takes on a value between +1 and -1 inclusive, where 1 is total positive correlation, 0 is no correlation, and -1 is total negative correlation. The correlation coefficient can be interpreted as the extent to which a change in one variable relates to a change in a second variable. The square of r is called the coefficient of determination which indicates the proportion of the variance in the second variable that is predictable from the first variable. Cohen (1988) attempted to address the issue of interpreting effect size estimates relative to other effect sizes. He suggested the following guidelines for interpreting correlation coefficients in the social sciences: small (r = 0.1), medium (r = 0.3), and large (r = 0.5). However, Cohen chose these quantities to reflect the typical effect sizes encountered in the behavioral sciences as a whole - he warned against using his labels to interpret relationship magnitudes within particular social science disciplines or topic areas. His general labels, however, illustrate how to go about interpreting relative effects. Carlson and Herdman (2012) on the other hand recommend using r above 0.7 as evidence for convergent validity whereas those below 0.5 should be considered divergent. In this study the largest correlations, all above 0.5, are used to identify those NSC assessments that are convergent to the NBT domains. The correlations between the NBTs and NSC assessments are presented for the entire sample (n = 72 517) of first-time prospective students in South African higher education in Table 11.
From Table 11 it can be seen that performance on the Academic Literacy assessment is most highly correlated with performance on the NSC assessments in English Home language r(n=39 649) = .75, p<.01; English First Additional Language r(n=32 813) = .71, p<.01; Afrikaans Home language r(n=8 837) = .68, p<.01; Mathematical Literacy r(n=16 335) = .66, p<.01 and Consumer Studies r(n=4017) = .66, p<.01. These NSC subjects can be said to be convergent with the NBTs Academic Literacy domain. So that candidates who perform high on these NSC subjects are also likely to perform high on the NBT Academic Literacy assessment and vice versa.
From Table 11 it can also be seen that performance on the Quantitative Literacy assessment is most highly correlated with Mathematical Literacy
r(n=16 334) = .67, p<.01; Information Technology r(n=2 556) = .63, p<.01; Engineering Graphics r(n=5 134) = .6, p<.01; English Home language r(n=39 696) = .59, p<.01; Accounting r(n=20 808) = .59, p<.01; Mathematics r(n=56 661) = .58, p<.01; and Consumer Studies r(n=56 661) = .58, p<.01. These NSC subjects can be said to be convergent with the NBTs Quantitative Literacy domain. So that candidates who perform high on these NSC subjects are also likely to perform high on the NBT Quantitative Literacy assessment and vice versa.
On the other hand performance on the NBTs Mathematics assessment is most highly correlated (convergent) with Mathematics r(n=51 678) = .78, p<.01; Physical Sciences r(n=42 225) = .73, p<.01; Information Technology r(n=2 360) = .69, p<.01; Accounting r(n=16 611) = .63, p<.01; Life Sciences r(n=38 901) = .62, p<.01; and Engineering Graphics and Design r(n=4 311) = .60, p<.01. These NSC subjects can be said to be convergent with the NBTs Mathematics domain. So that candidates who perform high on these NSC subjects are also likely to perform high on the NBT Mathematics assessment and vice versa.
For all three NBT domains, the NSC assessments that are highly correlated (convergent) with them are all fairly cognate and hence consistent with expectations.
Scatter plots and Bland Altman plots
Researchers often need to compare two methods of measurement, or a new method with an established one, to determine whether these two methods can be used interchangeably or whether the new method can replace the established one. In most of these situations, the 'true' value of the measured quantity is unknown.
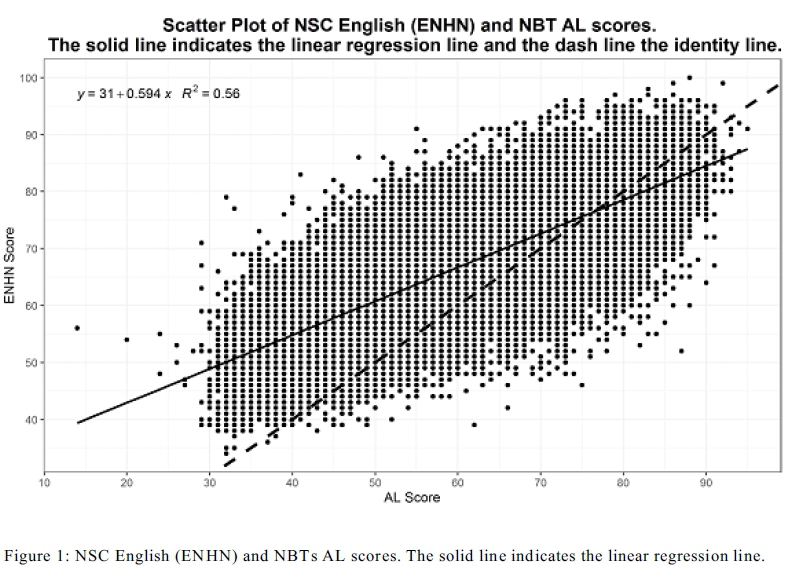
Scatter plots with linear regression and identity lines give an indication of the relationship between the two variables under consideration. The identity line is where the two variables will have equal values and the distribution of the scatter plots in relation to this line gives an indication of the extent to which the two variables deviate from being the same. The linear regression line on the other hand explains the relationship between one dependent variable and an independent variable. The slope of the linear regression line indicates by how much the dependent variable changes for a given change in the independent variable.
Bland and Altman (1986) advocated the use of a graphical method to plot the difference scores of two measurements of a subject against the mean for each subject and argued that if the new method agrees sufficiently well with the old, the old may be replaced. Here the idea of agreement plays a crucial role in method comparison studies.
The Bland-Altman method calculates the mean difference between two methods of measurement (the 'bias'), and 95% limits of agreement as the mean difference ± (1.96 sd). It is expected that the 95% limits include 95% of differences between the two measurement methods. The plot is commonly called a Bland-Altman plot and the associated method is usually called the Bland-Altman method.
In this part of the paper the Bland-Altman method and plots are used to investigate the relationship between performances on the NBTs and their cognate NSC counterparts.
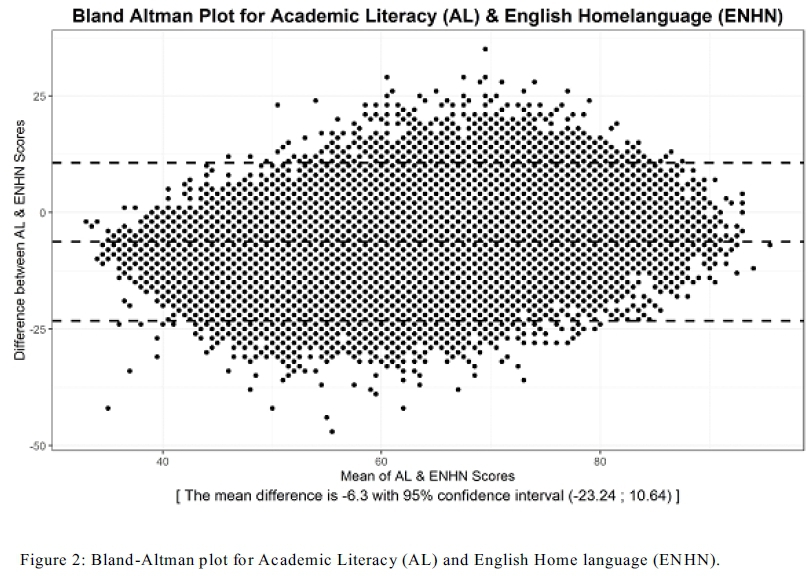
From the correlations in Table 14, scatter plot Figure 1 and Bland-Altman plot Figure 2 for Academic Literacy (AL) and English Home language (ENHN) it can be seen that even though AL is highly correlated with ENHN (r(n=39649) = .75, p<.01) the AL scores are on average 6.3 percentage points lower than the ENHN scores and that for the mean AL and ENHN scores between 45% and 85% many of the differences are outside the 95% confidence intervals. This means that scores on the English Home language assessment over-estimate the scores on the Academic Literacy assessment by 6.3 percentage points and that many scores lie outside of the 95% confidence intervals.
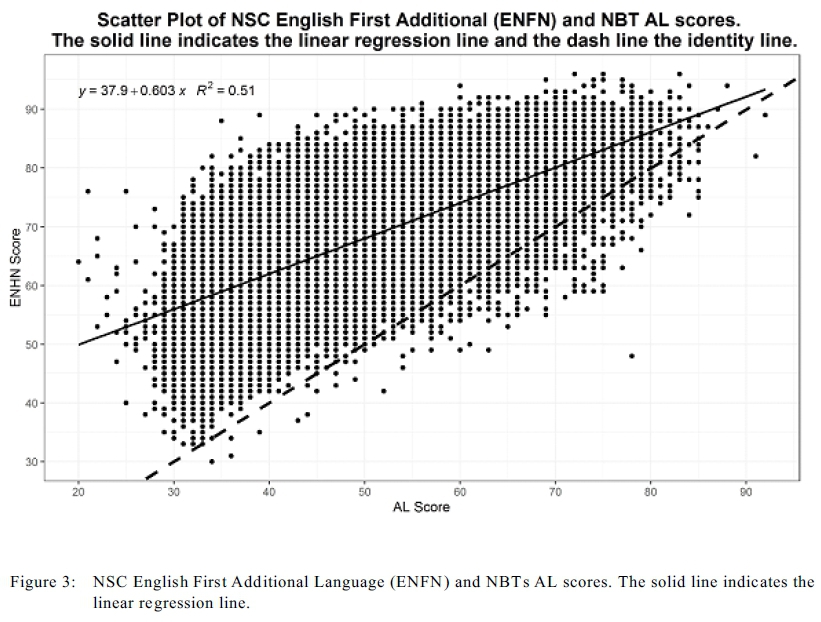
From the correlations in Table 14, scatter plot Figure 3 and Bland-Altman plot Figure 4 for Academic Literacy (AL) and English First Additional Language (ENFN) it can be seen that even though AL is highly correlated with ENFN (r(n=32813) = .71, p<.01) the AL scores are on average 19.1 percentage points lower than the ENFN scores and that for the mean AL and ENHN scores between 40% and 80% many of the differences are outside the 95% confidence intervals. This means that scores on the English First Additional language assessment over-estimate the scores on the Academic Literacy assessment by 19.1 percentage points and that many scores lie outside of the 95% confidence intervals.
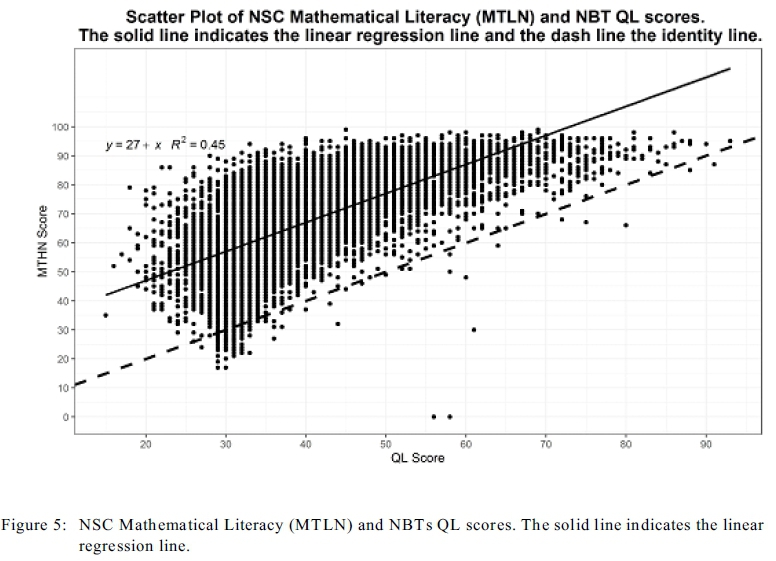
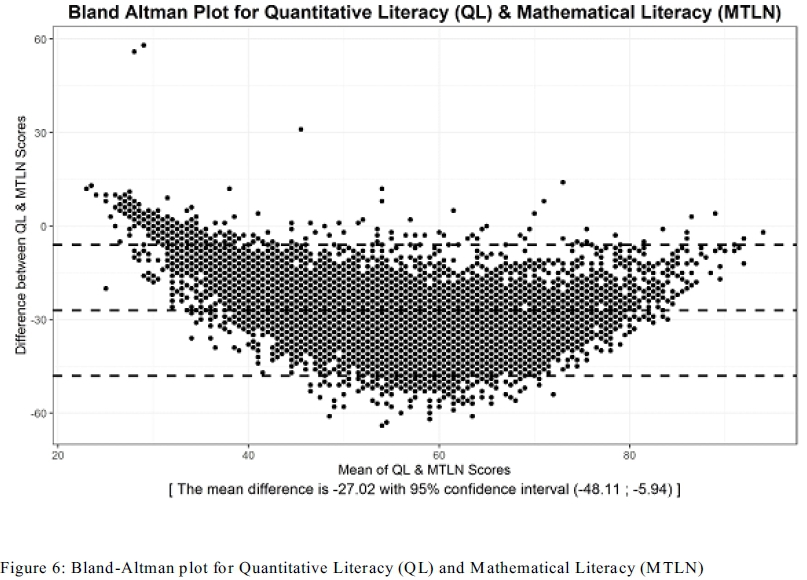
From the correlations in Table 14, scatter plot Figure 5 and Bland-Altman plot Figure 6 for Quantitative Literacy (QL) and Mathematical Literacy (MTLN) it can be seen that even though QL is correlated with MTLN r(n=16334) = .67, p<.01 the QL scores are on average 27.0 percentage points lower than the MTLN scores and that for the mean QL and MTLN scores below 40% the difference is closer to zero whereas between 40% and 80% many of the differences are outside the 95% confidence intervals. This means that scores on the Mathematical Literacy assessment over-estimate the scores on the Quantitative Literacy assessment by 27.0 percentage points and that many scores lie outside of the 95% confidence intervals.
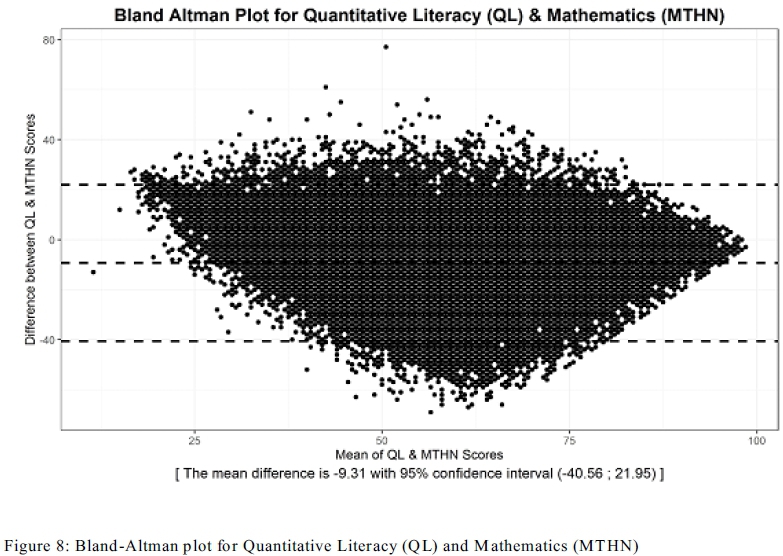
From the correlations in Table 4, scatter plot Figure 7 and Bland-Altman plot Figure 8 for Quantitative Literacy (QL) and Mathematics (MTHN) it can be seen that even though QL is correlated with MTHN (r(n=56661) = .58, p<.01) the QL scores are on average 9.3 percentage points lower than the MTHN scores and that for the mean QL and MTHN scores between 20% and 80% many of the differences are outside the 95% confidence intervals. This means that scores on the Mathematics assessment over-estimate the scores on the Quantative Literacy assessment by 9.3 percentage points and that many scores lie outside of the 95% confidence intervals.
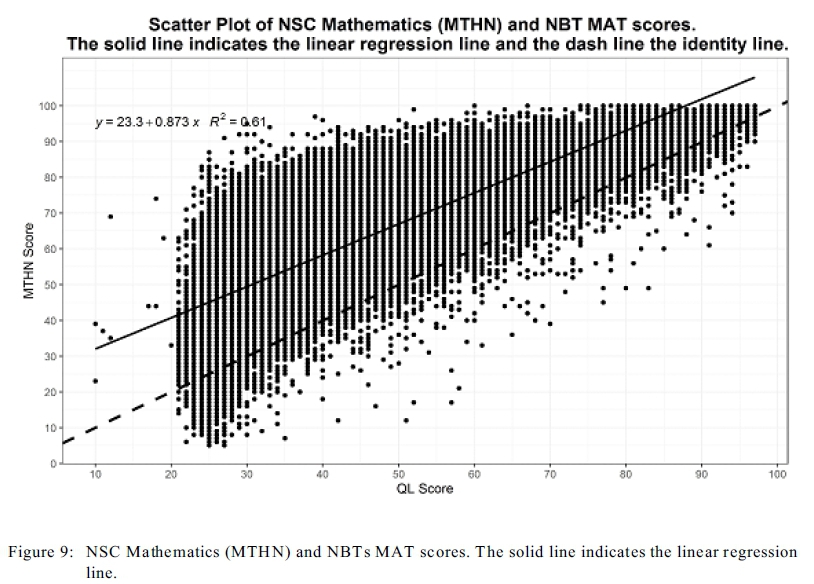
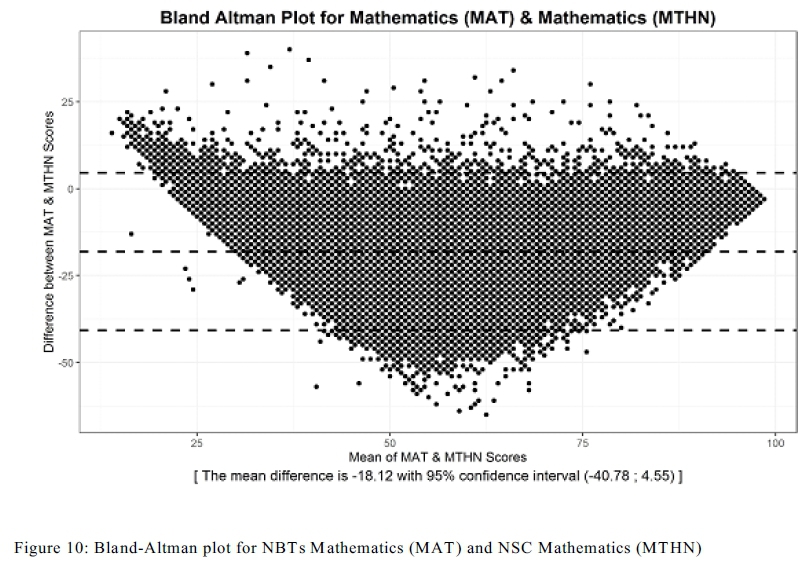
From the correlations in Table 14, scatter plot Figure 9 and Bland-Altman plot Figure 10 for NBTs Mathematics (MAT) and Mathematics (MTHN) it can be seen that even though MAT is correlated with MTHN (r(n=51678) = .78, p<.01) the MAT scores are on average 18.1 percentage points lower than the MTHN scores and that for the mean MAT and MTHN scores below 40% the difference is closer to zero whereas between 40% and 75% many of the differences are outside the lower 95% confidence interval. This means that scores on the NSC Mathematics assessment over-estimate the scores on the NBTs Mathematics assessment by 18.1 percentage points and that many scores lie outside of the 95% confidence intervals.
From the Bland-Altman analyses it can clearly be seen that there is fair agreement between what the NBTs and the cognate NSC assessments assess. However, it is also clear that the mean differences between the two sets of assessments range from -6.3 to -27.0. These differences are particularly large for the mathematical assessments.
Implications for Higher Education
In Prince (2016) it is argued that the need for extended curriculum provision in the higher education landscape is necessary and should continue into the foreseeable future. There is however a strong need to determine which of the extended curriculum or regular programmes are best suited to individual students. While the norm-referenced NSC assessments may be a statutory requirement for higher education study, criterion-referenced assessments such as the National Benchmark Tests can provide the kind of information which is needed to make decisions about which curricular route best suits students in an attempt to improve the graduation rates and address the drop-out rates.
This paper has compared the two national assessments and investigated the empirical relationships between performances on the two. The evidence presented through correlation analysis, linear regression (scatter plots) and Bland-Altman analyses clearly show that the scores on the NSC subjects that are cognate to the NBT domains are sufficiently different for them to be viewed as complementary sets of assessments. This research suggests that it would be appropriate for South African higher education institutions to consider the use of the criterion-referenced NBTs scores and proficiency benchmarks to complement performance on the statutory NSC norm-referenced assessments scores and levels in order to select and place students in extended degree programmes and to ensure that these students are provided with appropriate teaching and learning environments.
Ethical approval
The research reported in this paper has been subjected to ethical review and approved by the research ethics committee of the Centre for Higher Education Development at the University of Cape Town. Candidates writing the National Benchmark Tests (NBTs) sign a declaration allowing the use of their scores for research purposes and they are simultaneously assured of anonymity in such use.
References
Bachman, L.F. and Palmer, A.S. (1996). Language testing in practice. Hong Kong: Oxford University Press. [ Links ]
Bland, J.M. and Altman, D.G. (1986). Statistical methods for assessing agreement between two methods of clinical measurement. Lancet (i), 307-310. [ Links ]
Bohlmann, C. and Braun, M. (2006). Cognitive academic mathematics proficiency. In H. Griesel (Ed.), Access and Entry Level Benchmarks, the National Benchmark Tests Project (35-41). Available at: http://www.hesa.org.za/sites/hesa.org.za/files/2006HESAAccessandEntry LevelBenchmarks.pdf (Accessed 24 February 2015).
Carlson, K.D. and Herdman, A. (2012). Understanding the impact of convergent validity on research results. Organizational Research Methods, 15(1), 17-32. [ Links ]
Cliff, A.F. and Hanslo, M. (2009). The design and use of 'alternate' assessments of academic literacy as selection mechanisms in higher education. Southern African Linguistics and Applied Languages Studies, 27(3), 265-276. [ Links ]
Cliff, A., Ramaboa, K. and Pearce, C. (2007). The assessment of entry-level students' academic literacy: does it matter? Ensovoort, 11(2), 33-48. [ Links ]
Cliff, A.F., Yeld, N. and Hanslo, M. (2003). Assessing the academic literacy skills of entry-level students, using the Placement Test in English for Educational Purposes (PTEEP). Paper presented at the European Association for Research in Learning and Instruction (EARLI) conference, Padova, Italy.
Cliff, A. and Yeld, N. (2006). Domain 1-Academic Literacy, In H. Griesel (Ed.) Access and Entry-level Benchmarks: The National Benchmark Tests Project (19-27). Available at: http://www.hesa.org.za/sites/hesa.org.za/files/2006HESAAccessandEntryLevel Benchmarks.pdf (Accessed 24 February 2015).
Cohen, J. (1988). Statistical power for the behavioral sciences (2nd ed.). Hillsdale, NJ: Erlbaum. [ Links ]
Council on Higher Education (2013). A proposal for undergraduate curriculum reform in South Africa: The case for a flexible curriculum structure. Pretoria: Council on Higher education. Available at: http://www.che.ac.za/sites/default/files/publications/FullReport.pdf (Accessed 2 June 2015). [ Links ]
Cummins, J. (2000). Language, power and pedagogy: Bilingual children in the crossfire. Clevedon: Multilingual Matters Ltd. [ Links ]
Department of Basic Education. (2009). National examinations and assessment. Report on the National Senior Certificate examination results 2009. Pretoria: DBE. Available at: http://www.education.gov.za/LinkClick.aspx?fileticket=l3hlVk9sypk%3d&tabid =92&portalid=0&mid=4359&forcedownload=true. (Accessed 22 January 2018). [ Links ]
Department of Basic Education. (2011a). National Curriculum Statement (NCS). Curriculum and assessment policy statement. Grades 10-12. Mathematics. Pretoria: DBE. Available at: https://www.education.gov.za/Portals/0/CD/National%20Curriculum% 20Statements%20and% 20Vocational/CAPS%20FET%20%20MATHEMATICS%20%20GR%2010-12%20%20Web 1133.pdf?ver=2015-01-27-154314-253. (Accessed 22 January 2018). [ Links ]
Department of Basic Education. (2011b). National Curriculum Statement (NCS). Curriculum and assessment policy statement. Grades 10-12. Mathematical Literacy. Pretoria: DBE. Available at: https://www.education.gov.za/Portals/0/CD/National%20Curriculum%20Statement s%20and %20Vocational/CAPS%20FET%20 %20MATHEMATICAL%20LITERAC Y%20 %20GR%2010-12%20 %20Web DDA9.pdf?ver=2015-01-27-154330-293. (accessed 22 January 2018). [ Links ]
Foxcroft, C. (2006). The Nature of Benchmark Tests. In H. Griesel (Ed.) Access and Entry Level Benchmarks, the National Benchmark Tests Project (7-16). Available at: http://www.hesa.org.za/sites/hesa.org.za/files/2006HESAAccessandEntryLev elBenchmarks.pdf (Accessed 24 February 2015).
Frith, V. and Prince, R. (2006). Quantitative literacy, In H. Griesel (Ed.) Access and Entry Level Benchmarks, the National Benchmark Tests Project (28-34; 47-54). Available at: http://www.hesa.org.za/sites/hesa.org.za/files/2006HESAAccessandEntryLevelBenchmarks.pdf (Accessed 24 February 2015).
Frith, V. and Prince, R. (2009). A framework for understanding the quantitative literacy demands of higher education. South African Journal of Higher Education, 23(1), 83-97. [ Links ]
Gal, I., Van Groenestijn, M., Manly, M., Schmitt, M.J. and Tout, D. (2005). Adult numeracy and its assessment in the ALL Survey: A conceptual framework and pilot results. In T. Scott Murray, Y. Clermont and M. Binkley (Eds), International adult literacy survey. Measuring adult literacy and life skills: New frameworks for assessment. Ottawa: Statistics Canada. Available at: http://citeseerx.ist.psu.edu/viewdoc/download?doi=10.1.1.120.4652&rep=rep1&type=pdf (Accessed 24 February 2015). [ Links ]
Griesel, H. (Ed.). (2006). Access and entry level benchmarks: The national benchmark tests project. Pretoria: Higher Education South Africa. [ Links ]
Hambleton, R.K. and Pitoniak, M.J. (2006). In R.L. Brennan (Ed.), Educational Measurement (4th ed.) (433-470). Westport, CT: Greenwood/Praeger.
Holland, P.W. and Dorans, N.J. (2006). Linking and equating. In R.L. Brennan (Ed.), Educational Measurement (4th ed.) (187-220). Westport, CT: Greenwood/Praeger. [ Links ]
Kelly, S., Johnston, B., & Baynham, M. (2007). The concept of numeracy as social practice. In S. Kelly, B. Johnston & K. Yasukawa (Eds), The adult numeracy handbook. Reframing adult numeracy in Australia. Sydney: NSW Adult Literacy and Numeracy Australian Research Consortium, Sydney University of Technology. [ Links ]
Lok, B., McNaught, C., and Young, K. (2016). Criterion-referenced and norm-referenced assessments: Compatibility and complementarity. Assessment & Evaluation in Higher Education, 41(3), 450-465. [ Links ]
Prince, R. (2016). Predicting success in higher education: The value of criterion and norm-referenced assessments. Practitioner Research in Higher Education Journal, 10(1), 22-38. [ Links ]
Prince, R. and Archer, A. (2008). A new literacies approach to academic numeracy practices in higher education in South Africa. Literacy and Numeracy Studies 16(1), 63-75. [ Links ]
Prince, R. and Simpson, Z. (2016). Quantitative literacy practices in civil engineering study: Designs for teaching and learning. In A-M. Nortvig, B.H. Sorensen, M. Misfeldt, R. 0rngreen, B.B. Allsopp, B., Henningsen & H. Hautopp (Eds), Proceedings of the 5th International Conference on Designs for Learning. (Open Access ed.) Aalborg Universitetsforlag. [ Links ]
Scott, I., Yeld, N. and Hendry, J. (2007). A case for improving teaching and learning in South African higher education. Higher Education Monitor No. 6, Pretoria: Council on Higher Education. [ Links ]
Street, B. (2005). Applying new literacy studies to numeracy as social practice. In A. Rogers (Ed.), Urban literacy. Communication, identity and learning in development contexts. Hamburg: UNESCO Institute for Education. [ Links ]
Street, B. and Baker, D. (2006). So, what about multimodal numeracies? In K. Pahl & J. Rowsell (Eds), Travel notes from the New Literacy Studies. Clevedon: Multilingual Matters Ltd. [ Links ]
Wonnacott, T.H. and Wonnacott, R.J. (1969). Introductory statistics. New York: John Wiley & Sons, Inc. [ Links ]
Yeld, N. (2001). Equity, assessment and language of learning: Key issues for Higher Education selection and access in South Africa. Unpublished PhD Thesis, Cape Town, University of Cape Town. [ Links ]
Yen, W.M., and A.R. Fitzpatrick. (2006). "Item Response Theory." In R.L. Brennan (Ed.), Educational Measurement (4th ed.), (111-153). Westport, CT: Greenwood/Praeger. [ Links ]
Received 8 January 2016
Accepted 4 December 2017

