


Serviços Personalizados
Artigo
 Inglês (pdf)
 Artigo em XML
 Referências do artigo
Indicadores

Links relacionados
-
 Citado por Google
 -
 Similares em Google
Compartilhar

 Permalink
The Independent Journal of Teaching and Learning
versão On-line ISSN 2519-5670
IJTL vol.14 no.1 Sandton 2019
ARTICLES
Quantitative exploration of students' experience in cloud computing in a higher education institution
Natasha MadhavI; Kayode Emmanuel AdetunjiII; Meera K. JosephIII
IIndependent Institute of Education, South Africa
IIUniversity of the Witwatersrand, South Africa
IIIIEEE Computer Society, South Africa
ABSTRACT
The use of cloud computing in the educational sector is still in its evolving stage in countries like South Africa. The readiness for cloud computing in South Africa has already gained momentum, but not many researchers are looking into the quantitative exploration of students' experience in the Cloud even though these cloud technologies are perceived to expand the educational sector through distance learning and data exchange among students. The slow uptake seems to lie with data security. In this paper, the authors investigated the use of cloud services in higher education institutions considering students' experiences. Statistical Package for Social Sciences (SPSS) was used for Likert scale construction and analysis. The results showed that over 65% of participants had problems with the usage of virtual labs due to lack of skills and 89% of participants could learn more through practical experience. However, the IT skill level of students may not determine their outcomes in module tasks while using cloud technologies. A strong significant relationship between perceived ease of use and perceived value of cloud technologies proved that the measure of students' experiences while using cloud technologies will impact the value of the technologies to assist in class module tasks.
Keywords: cloud computing in higher education, student experiences with cloud, SPSS, higher education insitutions
1. INTRODUCTION
In South Africa (SA) skills shortages remain a severe problem, and there is a dire need for the best trained engineers for further developing and sustaining technological advances. Challenges such as a weak economy, population outgrowth, climate change, require a highly qualified expert workforce to address these issues. In this study, we identify strategies for the promotion of technology-enhanced learning within the Faculty of Engineering at the University of Johannesburg to promote learning anytime, anywhere. Al Noor et al. (2010) identify cloud computing as the most ubiquitous technology for deploying and scaling applications through virtualisation. They further indicate that cloud computing can offer diverse services for varied users through virtualisation technology and storage capacity of PCs and servers. Tan and Kim (2011) describe cloud computing technologies as flexible IT management services, such as e-mail, calendar, and collaboration tools that members of the education community can engage with online via
the web at no cost. This allows system administrators to introduce new services and computing capacity online quickly and at minimal costs. By introducing Cloud Computing into educational institutions, it can assist administrators mitigate risks, increase demand, and promote scalability.
Mell and Grance (2011: 7) define cloud computing as a model for enabling ubiquitous, convenient, on-demand network access to a shared pool of configurable computing resources that can be rapidly provisioned and released with minimal management effort or service provider interaction.
Akande and Van Belle (2014) describe cloud computing as an on-demand self-service that provides access to resources that are freely available. With an increase in the adoption of mobile technology, there is a requirement within the higher education institutions (HEIs) to deliver education anytime, anywhere. This paper reviews what cloud computing is and how it can be adopted at learning institutions. We review case studies of cloud computing with the intention of probing into the successes and setbacks on the adoption of cloud computing solutions within HEIs. The paper discusses the findings conducted at a private higher education institution in SA. This institution was chosen due to proximity of the location and a lecturer who had implemented virtual labs in their classrooms.
Former studies on cloud technology highlight the significant contribution it has made in the education sector. Sultan (2010: 109) highlighted the potential benefits of cloud technology to 'cash-strapped educational establishments due to two main factors: flexibility and a pay-as-you-go pricing model'. Sultan (2010) describes how effectively the University of Westminster (UoW) implemented free apps such as Google Apps, to replace the existing student email service, Google Drive which provided each student with up to 7.3GB of email storage capacity, allowing students to store large graphics and multi-media files. Mashandudze and Dwolatzky (2015) indicate that cloud computing offers substantial computing capability that generally may not be affordable especially to small and medium enterprises (SMEs) that may not have the capital to invest in IT hardware and software.
Many HEIs in SA are slowly adopting cloud tools and technologies in the classroom even though this may come with significant restrictions from the IT departments. Encalada and Sequera (2017) developed a system which was integrated with Google, such as Google tools like Docs, Hangouts, Calendar, Drive, Groups, and others.
2. RESEARCH OBJECTIVES AND HYPOTHESES
The main objective is to explore students' experience in the use of cloud computing. The sub-objectives are:
1) to explore the adoption of cloud technologies in teaching and learning in HEIs
2) t o investigate the association among perceived usefulness and perceived value in relation to perceived ease of use and IT skills level of student in the adoption of cloud technologies in HEIs.
The hypotheses are:
-
Null hypothesis (Ho1): There is no statistically significant association between the IT skills of students and their ability to complete their portfolio (assignment) using virtual labs (perceived value).
-
Alternative hypothesis (Ha1): There is a statistically significant association between the IT skills of students and their ability to complete their portfolio (assignment) using virtual labs (perceived value).
-
Null hypothesis (Ho2): There is no statistical significance between enhanced learning experience (perceived ease of use) from virtual labs and the completion of portfolio of evidence for the module through virtual labs (perceived value).
-
) Alternative hypothesis (Ha2): There is a statistical significance between enhanced learning experience (perceived ease of use) from virtual labs and the completion of portfolio of evidence for the module through virtual labs (perceived value).
3. CLOUD COMPUTING FOR 21ST CENTURY TEACHING AND LEARNING
Drivers for the adoption of cloud computing in education
With the majority of today's students owning mobile devices and the availability of Massive Open Online Courses (MOOCs) and online learning, the need for improved internet access and IT infrastructure is critical. Researchers (Sultan, 2010; Gartner, 2009; Katz et al., 2010) have stated that cloud computing allows HEIs to continue to provide valuable resources under budgetary constraints. The adoption of cloud computing is highly essential, especially in HEIs.
Tout, Sverdlik and Lawver (2009) indicate that cloud computing provides a solution to universities by eliminating budgets for technical infrastructure, software licenses and hardware. They further indicate that the adoption of cloud computing can significantly reduce costs in the areas of supportive requirements, such as air conditioning and security mechanisms for server rooms. Ercan (2010) describes cloud computing as an excellent alternative for educational institutions facing financial restrictions as cloud computing will allow educational institutions to operate their information systems effectively without spending any more capital for the computers and network devices. In fact, many learners and educators are using cloud computing applications in their personal lives, such as Google Docs, Google Scholar, etc. Universities are beginning to follow this trend by leveraging on emerging technologies and making these accessible technologies for students and staff (Sultan, 2010).
4. RESEARCH METHODOLOGY
This section discusses the materials and methodology used for this research, which investigates the factors that determined the level of adoption of cloud computing in HEI classrooms. The aim was to observe the decisions of students on their use of cloud computing tools. This study also used a quantitative approach, using a Likert-scaled questionnaire to observe frequencies, and test for dependencies and correlation among specific variables. A quantitative method was adopted because it is an appropriate way to examine relationships among variables based on statistical analysis (Creswell & Creswell, 2017).
A quantitative research design and methodology was used to explore and understand students' experience with the use of cloud-based technologies for educational purposes. A survey was used to determine the level of adoption of cloud computing in HEI classrooms. Likert scales have been extensively used in various psychometric research (Stephens, 1998). The development of Likert scale dates far back as 1932. The first of its kind was based on a five-point scale response (Allen & Seaman, 2007). These scales are common to grading questions from surveys; ranging from answers perceived as high to low rank, or best to worst. Data have been grouped into four major levels of measurements namely; ordinal, nominal, interval, and ratio. SPSS basically combines interval and ratio to make up scale. However, ordinal scales were used in this study.
Sample characteristics
The populace from a research study is neither an individual nor an object, but a representation of a measurement or observation. For this study, a group of networking students was selected from a private higher educational institution to study the adoption of virtual labs in the classroom. Students were asked to connect to Microsoft Virtual Labs to complete their assessments as these labs allowed students to connect to online virtual machines across a network. The benefits for the students were that they were given full access to a real machine that operates in a virtual environment providing access 24/7. Students could thus perform functions to the virtual machine that could be executed in the real-world scenario. There is also the use of software with other students through cloud-based services for storage such as Google groups, which was implemented in the students' course of study.
A simple random sampling method was chosen to select willing participants for the survey. The implementation of random sampling was stress-free, as it does not require many demographic details except for gender and age. This method is well recommended as there is no chance of a biased decision (Creswell & Creswell, 2017). In addition, there was no physical contact with the participants, as the survey was conducted online. The sample size calculated is derived from the formula in equation 1:
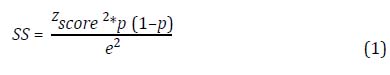
From the equation, the Zscore is drawn as 1.96, for a confidence level of 95% and e is the confidence interval (or error of margin). p is the proportion of the expected outcome, which is taken as 0.5. The adjusted (corrected) was calculated from the estimated calculation. The equation is shown in Equation 2
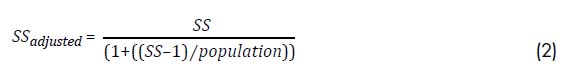
The population is estimated at 90, and the sample size is calculated as 33. After the data collection, five participants were annulled due to numerous blank spaces.
Data collection, design procedure, and analysis
Most variables of study were measured in ordinal form, using a five-point Likert scale ranging from strongly disagree to strongly agree (Joshi et al., 2015). Authors (Vogt, 2011; Brown, 2011; Jamieson, 2004) have been in trivial discussions about coding Likert scale items as either an interval scale or an ordinal variable. The outcome of the discussion theorised that population sample and normality of data can be used to determine the variable types on a Likert scale. However, this study justifies its non-parametric approach from the central limit theorem (Carifio & Perla, 2008) which states that the use of parametric statistical test is advised when the population sample is higher than 30, thereby assuming normal distribution.
The collected data were exported into SPSS for analysis. The initial part of the questionnaire was about demography, which was limited to gender and age. Afterwards, a total of 13 questions were asked and six out of the total were used for analysis. Description statistics including cross-tabulation with tests were used for analysis. Somers' delta (Somers d) was used to test association measurements strength and significance. Somers d is applicable for nonparametric measure of strength of association and direction between two ordinal dependent and independent variables (Newson, 2002). Goodman and Kruskals' gamma is also a nonparametric measure of strength of association but more tolerable than Somers d. Values are calculated in symmetric measures without classifying variables as dependent or independent. Symmetric measures were also observed using the Goodman and Kruskals' gamma. A hypothesis was stated to examine our results. As noted earlier, the Null hypothesis, Ho1 states that there is a statistically significant association between the IT skills of students and their ability to complete their portfolio (assignment) using virtual labs. Alternative hypothesis, Ha1 states that there is no statistically significant association between the IT skills of students and their ability to complete their portfolio (assignment) using virtual labs. The second hypothesis states that Ho2 is when there is a statistical significance between enhanced learning from virtual labs and improved knowledge. While Ha2 states that there is no statistical significance between enhanced learning from virtual labs and improved knowledge. The confidence interval is 0.95 and the reference significant value (p-value) is 0.05.
5. RESULTS AND DISCUSSION
This section shows the data obtained from the SPSS output and analysis. Table 1 shows the gender participation statistics. The disparity on gender still conforms to the study conducted by the Organization for Women in Science for the Developing World (OWSD), which summarises scientific discipline variation, decision making, opportunity equality, and health and social status as factors to gender inequality in science and technology (Elan, 2017). Gender demographics showed that 66.7% of the participants were male and 33.3% were female. An approximately normally distributed histogram chart is shown in Figure 1, displaying the distribution of participants' skill level. However parametric tests were not used because most of the data were not normally distributed, hence choosing a non-parametric test (Creswell & Creswell, 2017).
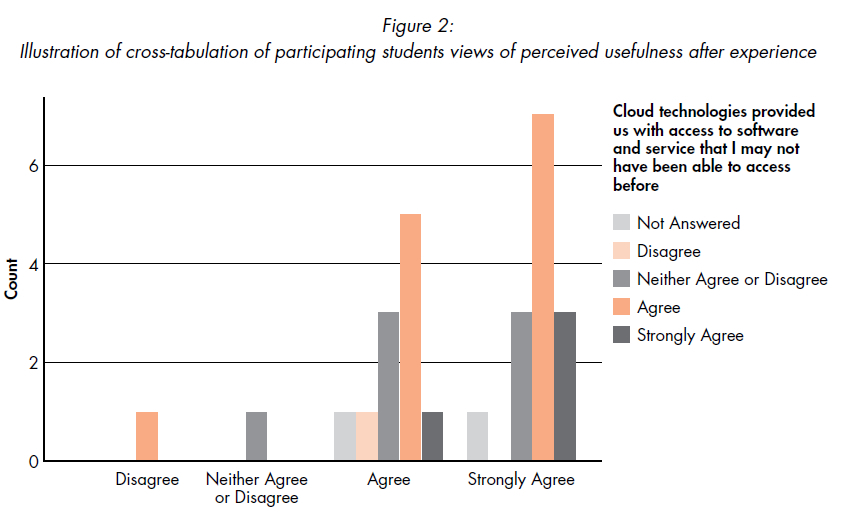
The cross-tabulation of experience of students that made use of virtual labs to the outcome of the experience (cloud technologies provided us with access to software and services that I may have not been able to access before) is illustrated in Figure 2.
Table 1 shows a perceived ease of use of virtual labs, as it enhances the learning experience of about 89% of participating students. The students with a three-point level of IT skills (Beginner, Intermediate, and Expert) were cross-tabulated against the perceived value (the use of virtual labs assisted me with the completion of my portfolio for this module).
Somers d and Gamma were used to test for measures of association, while checking the significance of independence. Tables 3 and 4 show the directional and symmetric measures for IT skills and perceived value of cloud computing.
From Tables 3 and 4, it is seen that the Somers d and the Goodman and Kruskal Gamma value indicates a very low positive correlation between the targeted variables, with the value of 0.115 and 0.155 respectively. Furthermore, the approximate significance value (p-value) is 0.602, thereby higher than 0.05 (>0.05). This also makes the variables independent of each other, thereby accepting the null hypothesis, Ho1. The same measures were carried out on perceived usefulness after experience; that is, cross-tabulation of participating students enhanced learning experience after using virtual labs (perceived usefulness) with the improvement of knowledge and understanding after the enhanced experience (perceived value).
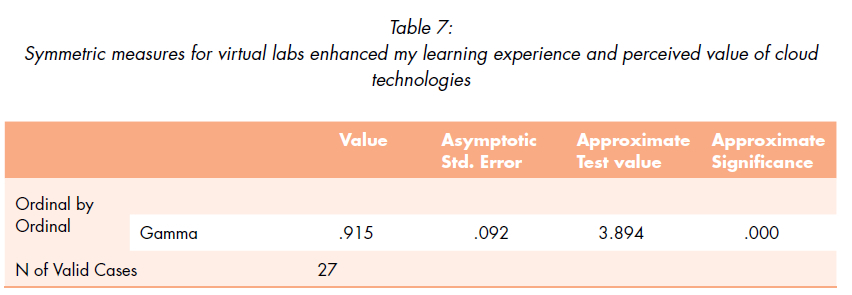
Focusing on the Strongly Agree row/column intersection from Table 5, it is seen that the value has a high percentage of 88.9 %. This explains the positive correlation of PEOU and PV. Tables 6 and 7 shows the results from the directional and symmetric measures of association.
Somers d value (0.628) from Table 6 shows that there is an association between the perceived ease of use (through the question - Virtual labs enhanced my learning experience) and perceived value (through the question - Virtual labs improved my knowledge and understanding of the learning content). This indicates that students' experience in using cloud technologies will moderately determine the outcome of the value yielded from module assignments. Furthermore, the value of the approximate significance (0.00) shows that the said association is statistically significant. The Goodman and Kruskal gamma value (0.915) also showed a high strength of association, with a statistically significant value (0.00), accepting the alternative hypothesis (Ha2).
6. CONCLUSION
The drive of this quantitative non-experimental correlational examination was to explore and understand students' experience with the use of cloud-based technologies for educational purposes. A virtual lab application was the cloud tool used by students to complete subject-related tasks. It was observed from the results that students were able to use and improve from the experience of virtual lab usage. We explored the adoption of cloud technologies for teaching and learning in an HEI, showing the perceived usefulness, perceived ease of use and perceived value of participants after taking a module through virtual labs. We could demonstrate directional/symmetric measures for IT skills and perceived value of cloud computing. There was no significant correlation between the IT skills of students and their perceptions, suggesting that IT skills level of students may not determine their outcomes in module tasks while using cloud technologies.
Directional/Symmetric measures for perceived ease of use and perceived value of cloud technologies were also computed, with results showing a strong significant relationship between them. This suggests that the smooth and enhanced use of cloud technologies will always positively impact the value of cloud technologies to helping in module tasks. However, the limitation of this study is that the participants are taken from a sample of networking students from a private HEI and so cannot be applicable to all potential students in South Africa but can guide towards the analysis in other locations. Lastly, the significance of this research study was to augment existing knowledge on cloud computing adoption in higher education institutions in South Africa.
REFERENCES
Akande, A.O. & Van Belle, J.P. (2014) Cloud computing in higher education: A snapshot of software as a service. In Adaptive Science & Technology (ICAST). IEEE 6th International Conference, October pp.1-5.
Allen, I.E. & Seaman, C. A. (2007) Likert scales and data analyses. Quality progress 40(7) pp.64-65. [ Links ]
Al Noor, S., Mustafa, G., Chowdhury, S.A., Hossain, M.Z. & Jaigirdar, F.T. (2010) A proposed architecture of cloud computing for education system in Bangladesh and the impact on current education system. International Journal of Computer Science and Network Security 10(10) pp.7-13. [ Links ]
Brown, J.D. (2011) Likert items and scales of measurement. Statistics 15(1) pp.10-14. [ Links ]
Carifio, J. & Perla, R. (2008) Resolving the 50-year debate around using and misusing Likert scales. Medical education 42(12) pp.1150-1152. [ Links ]
Creswell, J.W. & Creswell, J.D. (2017) Research design: Qualitative, quantitative, and mixed methods approaches. California: Sage publications. [ Links ]
Elan, S. (2017) Gender inequality continues in science and technology. https://www.researchinformation.info/news/analysis-opinion/gender-inequality-continues-science-and-technology (Acccessed 20 July 2017).
Encalada, W.L. & Sequera, J.L.C. (2017) Model to Implement Virtual Computing Labs via Cloud Computing Services. Symmetry 9(117). www.mdpi.com/2073-8994/9/7/117/pdf (Acccessed 27 January 2019). [ Links ]
Ercan, T. (2010) Effective use of cloud computing in educational institutions. Procedia-Social and Behavioral Sciences 2(2) pp.938-942. [ Links ]
Gartner. (2009) Cloud Computing Inquiries at Gartner [Web log post]. http://blogs.gartner.com/thomas_bittman/2009/10/29/cloud-computing-inquiries-at-gartner (Acccessed 25 August 2017).
Joshi, A., Kale, S., Chandel, S. & Pal, D.K. (2015) Likert scale: Explored and explained. British Journal of Applied Science & Technology 7(4) pp.396-403. [ Links ]
Jamieson, S. (2004) 'Likert scales: how to (ab) use them' Medical education 38(12) pp.1217-1218. [ Links ]
Katz, R., Goldstein, P., Yanosky, R. & Rushlo, B. (2010) Cloud computing in higher education. EDUCAUSE 10 http://net.educause.edu/section_params/conf/CCW (Accessed 5 October 2017).
Malloy, A.D., Grant, D.M. & Bogues-Hill, J. (2013) Cloud computing: increasing the 'T'pipeline in STEM majors. International Journal of Cloud Computing 1,2(2-3) pp.123-139. [ Links ]
Mashandudze, E. & Dwolatzky, B. (2015) Major Challenges Impeding the Fast Adoption of Cloud Computing: A Case Study of South African Organisations and Emerging Economics. Open Journal of Mobile Computing and Cloud Computing 2(1) pp.1-18. [ Links ]
Mell, P. & Grance, T. (2011) The NIST Definition of cloud computing. Recommendations of the National Institute of Standards and Technology, Nist Special Publication 145(67) 7. [ Links ]
Newson, R. (2002) Parameters behind 'nonparametric' statistics: Kendall's tau, Somers' D and median differences. Stata Journal 2(1) pp.45-64. [ Links ]
Stephens, L.J. (1998) Schaum's outline of theory and problems of beginning statistics. McGraw-Hill, USA.
Sultan, N. (2010) Cloud computing for education: A new dawn? International Journal of Information Management 30(2) pp.109-116. [ Links ]
Tashkandi, A.N. & Al-Jabri, I.M. (2015) Cloud computing adoption by higher education institutions in Saudi Arabia: an exploratory study. Cluster Computing 18(4) pp.1527-1537. [ Links ]
Tan, X. & Kim, Y. (2011) Cloud computing for education: A case of using google docs in MBA mba group projects. 2011 International Conference on Business Computing and Global Informatization, July, Shanghai, China pp.641-644.
Tout, S., Sverdlik, W. & Lawver, G. (2009). Cloud computing and its security in higher education. Proceedings of ISECON 26, Washington DC, US, 2314.
Vogt, W.P. (Ed.) (2011) SAGE quantitative research methods. London: Sage. [ Links ]
Date of submission 6 August 2018
Date of review outcome 19 December 2018
Date of acceptance 31 January 2019

