


Services on Demand
Article
 English (pdf)
 Article in xml format
 Article references
Indicators

Related links
-
 Cited by Google
 -
 Similars in Google
Share

 Permalink
Town and Regional Planning
On-line version ISSN 2415-0495
Print version ISSN 1012-280X
Town reg. plan. (Online) vol.83 Bloemfontein 2023
http://dx.doi.org/10.38140/trp.v83i.7353
RESEARCH ARTICLE
Locational patterns of warehousing facilities in the City of Cape Town municipality
Liggingspatrone van pakhuisfasiliteite in die Kaapstad-munisipaliteit
Pharallo ea libaka tsa lits'ebeletso tsa polokelo ea thepa masepaleng oa toropo ea Cape Town
Masilonyane MokheleI; Brian Fisher-HollowayII
IHead of Department Urban and Regional Planning, Cape Peninsula University of Technology, PO Box 652, Cape Town, 8000. Phone: 021 440 2246, email: mokhelem@cput.ac.za, ORCID: https://orcid.org/0000-0002-0182-5739
IILecturer, Department Urban and Regional Planning, Cape Peninsula University of Technology, PO Box 652, Cape Town, 8000. Email: fisherhollowayb@cput.ac.za, ORCID: https://orcid.org/0000-0002-6008-5275
ABSTRACT
The proliferation of globalisation and e-commerce has led to an increasing number of warehousing facilities in cities and regions, which may contribute to the negative externalities of air pollution, noise pollution, and traffic congestion. Despite the close relationship between logistics and different sectors of the economy, there is a paucity of literature on the connection between warehousing and different land-use categories. Focusing on the City of Cape Town municipality in South Africa, the article aims to analyse the locational patterns of warehousing facilities relative to the transport infrastructure and the industrial, retail, and office land use. The study was based on a descriptive quantitative design wherein kernel density was employed in ArcGIS to analyse the locational patterns of warehousing facilities across the municipality. Data on the floor area of the industrial, retail, and office land use were classified into several ranges to ascertain the intensity of the land use relative to the concentration of the warehousing facilities. It was discovered that warehousing facilities cluster in the highly accessible areas within the municipality, namely the port's environs, in the vicinity of the main junctions, and adjacent to arterial roads, which provide connections to the national roads. The areas with the highest concentration of warehousing facilities also accommodated the most significant percentage of industrial and retail land use. It is recommended that the existing warehousing clusters be prioritised in future warehousing development or consolidation, and that the future increase of the industrial and retail land use within the City of Cape Town municipality include a commensurate increase of space for warehousing facilities or vice versa.
Keywords: Cape Town, Cape Town municipality, locational patterns, logistics, logistics clustering, manufacturing, warehouse facilities, warehousing
OPSOMMING
Die verspreiding van globalisering en e-handel het gelei tot 'n toenemende aantal pakhuisfasiliteite in stede en streke, wat kan bydra tot negatiewe eksterne aspekte soos lugbesoedeling, geraasbesoedeling en verkeersopeenhopings. Ten spyte van die noue verband tussen logistiek en verskillende sektore van die ekonomie, is daar min literatuur oor die verband tussen pakhuise en verskillende grondgebruikkategorieë. Met die fokus op die Kaapstad-munisipaliteit in Suid-Afrika, ontleed die artikel die liggingspatrone van pakhuisfasiliteite relatief tot die vervoerinfrastruktuur en die industriële, kleinhandel- en kantoorgrondgebruik. Die studie is gebaseer op die beskrywende kwantitatiewe ontwerp waarin kerndigtheid in ArcGIS gebruik is om die liggingspatrone van pakhuisfasiliteite regoor die munisipaliteit te ontleed. Data oor die vloeroppervlakte van die industriële, kleinhandel- en kantoorgrondgebruik is in verskeie reekse geklassifiseer om die intensiteit van die grondgebruik relatief tot die konsentrasie van die pakhuisfasiliteite vas te stel. Daar is ontdek dat pakhuisfasiliteite in die hoogs toeganklike gebiede binne die munisipaliteit groepeer, naamlik die hawe se omgewing, in die omgewing van die hoofaansluitings, en aangrensend aan arteriële paaie, wat verbindings met die nasionale paaie verskaf. Die gebiede met die hoogste konsentrasie van pakhuisfasiliteite het ook die grootste persentasie industriële en kleinhandelgrondgebruik geakkommodeer. Dit word aanbeveel dat die bestaande pakhuisklusters geprioritiseer word in toekomstige pakhuisontwikkeling of konsolidasie en dat die toekomstige toename van die nywerheids- en kleinhandelgrondgebruik binne die Kaapstad-munisipaliteit 'n eweredige toename van ruimte vir pakhuisfasiliteite insluit of omgekeerd.
KAKARETSO
Ho ata ha boikopanyo ba lichaba tsa lefatse le khoebo ea marang-rang ho entse hore ho be le palo e ntseng e eketseha ea libaka tsa polokelo metseng e meholo le litoropong, 'me sena se ka susumetsa tsilafalo ea moea, le ho eketseha hoa lerata le tsubuhlellano ea sephethephethe ka hare ho naha. Leha ho na le kamano e hlakileng lipakeng tsa thepa le mafapha a fapaneng a moruo, ho na le bofokoli ba lingoliloeng tse mabapi le khokahano lipakeng tsa litsi tsa polokelo ea thepa le likarolo tse fapaneng tsa tsebeliso ea mobu. Sengoloa sena se lekola masepala oa Toropo ea Motse Kapa Afrika Boroa, 'me se ikemiselitse ho sekaseka mekhoa ea sebaka sa polokelo ea thepa e amanang le meaho ea lipalangoang le ts'ebeliso ea mobu ea indasteri, mabenkele le liofisi. Boithuto bona bo ne bo ipapisitse le moralo o hlalosang moo ho sebelisitsoeng ArcGIS ho sekaseka mekhoa ea sebaka sa polokelo ea thepa ho masepala. Lintlha tse mabapi le pharallo ea libaka tsa ts'ebeliso ea mobu tsa indasteri, mabenkele le liofisi li arotsoe ka mekhahlelo e mengata ho netefatsa matla a ts'ebeliso ea mobu ha e bapisoa le bongata ba meaho ea polokelo. Ho ile ha fumanwa hore libaka tsa polokelo e kopane dibakeng tse fihlellehang habonolo ka hara masepala, e leng ditikoloho tsa boema-kepe, haufi le mateano a maholo, le mabapi le mebila e fanang ka dikgokelo tsa mebila e meholo ea naha. Libaka tse phahameng ka ho fetisisa tsa lits'ebeletso tsa polokelo le tsona li amohetse liperesente tse kholo tsa tsebeliso ea mobu oa indasteri le mabenkele. Ho khothaletsoa hore lihbaka tse seng li ntse li le teng tsa polokelo ea thepa li behoe ka sehloohong ntlafatsong ea nakong e tlang ea polokelo kapa khokahanyo; mme meralo ea kamoso ea tshebediso ea mobu oa diindaseteri le mabenkele ka hara Masepala oa toropo ea Motse Kapa e kenyeletsa keketseho e lekanang ea sebaka bakeng sa libaka tsa polokelo.
1. INTRODUCTION
The proliferation of globalisation and e-commerce has augmented the relevancy of logistics and supply-chain processes, facilitating the increasing flow of goods between points of origin and points of consumption (Li, 2014: 1; Verhetsel et al., 2015; Lan, Yang & Huang 2017: 66; De Oliviera, Dablanc & Schorung, 2022: 1). The number of logistics facilities has accordingly increased globally in cities and metropolitan regions (Xiao et al., 2021: 1; deSouza, Ballare & Niemeier, 2022: 1). Although they are an integral element of modern economic systems, the increasing number of logistics facilities can induce negative externalities that contribute to the declining performance of cities and regions. The ramifications of the burgeoning logistics facilities and the underlying processes include, inter alia, air pollution, noise pollution, and traffic congestion (Taylor, Tseng & Yue, 2005: 1667). These problems bring into the spotlight the importance of the positioning of logistics facilities within cities and regions. The article focuses specifically on warehousing, a crucial component of logistics (Darvazani & Norrman, 2015: 1) and an essential link in the supply-chain networks at local and global scales (Singh, Chaudhary & Saxena, 2018). The positioning of warehousing in the supply chain networks affects the overall efficiency of supply chains (Singh, Chaudhary & Saxena, 2018). Warehousing facilities are also pertinent because they are space intensive (Verhetsel et al., 2015: 111) - an attribute that cements the importance of location.
The literature acknowledges that close relationships exist between logistics and different sectors of the economy (Karayun, Aydin & Gulmez, 2012: 25). There is, however, a paucity of literature that analyses, through a geographical or spatial planning lens, the connections between warehousing and different land-use categories. Focusing on the City of Cape Town municipality in South Africa, the article aims to analyse the locational patterns of warehousing facilities relative to the transport infrastructure and the industrial, office, and retail land use. As planning can potentially influence warehousing development and the distribution of the resultant negative externalities (Yuan, 2019: 528), realising this research aim is crucial to ensuring that the locational efficiencies of warehousing and the associated land use are augmented through appropriate policies and planning initiatives (Mokhele & Fisher-Holloway, 2022: 73).
2. LITERATURE OVERVIEW
2.1 Relationship between logistics and different sectors of the economy
The correlation between the logistics industry and the economy has attracted the attention of numerous researchers, who argue that the advancement of logistics is an essential factor towards augmenting economic development (Lan et al., 2017; Karayun et al., 2012: 25; Li & Chen, 2021: 1; Gao et al., 2018: 28; Wang, 2010: 395). Logistics processes are, therefore, involved in the activities of different sectors such as agriculture, industry, business services, and transport (Li et al., 2017: 880). In light of the proclaimed interconnections, it is essential to empirically analyse the relationship between the logistics industry and non-logistical enterprises (Lang et al., 2017; Gao et al., 2018: 28; Yan et al., 2022). For instance, in Pizhou, China, Gao et al. (2018: 31) discovered that the extent of the relevance of connections between logistics and other sectors decreased from highest to lowest in the following order: the primary sector, the tertiary sector, and the secondary sector.
Several authors particularly note a close relationship between the logistics sector and manufacturing, whose analysis is essential for improving the two sectors' efficiency (Yan et al., 2022: 2). Accordingly, the literature acknowledges the connections between the placement of logistics facilities and industrial areas. Some scholars even argue that logistics space is a form of industrial space (He et al., 2018: 2). It is argued that the degree of the linkages influences the development of the logistics and manufacturing industries and the economy's overall performance. Modern logistics and supply-chain processes can reduce the logistics cost of manufacturing enterprises. In that way, more effort and resources can be channelled towards improving the core business of the manufacturing establishments. Therefore, it is paramount to understand the linkages between the logistics and manufacturing industries (Zheng et al., 2022).
A range of empirical literature documents the connections between logistics and manufacturing. For instance, Zheng et al.'s (2022: 2) study identified a spatial distribution pattern of logistics and the manufacturing industry in the Yangtze River Delta, China. Of direct relevance to the paper's focus, some studies specifically analysed the connections between warehousing (as a component of logistics and supply-chain management) and the establishments operational in other economic sectors. In the examination of the concentration of warehousing and distribution centres in Southern California, United States of America, Jaller, Pineda and Phong (2017) discovered that the number of warehousing and distribution (W&DC) establishments in a zip code could be explained by the number of establishments in both the manufacturing and the transport sectors. In this regard, the zip codes with a more significant presence of manufacturing establishments (and transport services) were more likely to accommodate W&DC establishments. This finding is aligned with the understanding that the proximity to the manufacturing (and retail) facilities underlines the importance of being positioned geographically close to the customers and the requisite distribution (Jaller et al., 2017). The literature argues that logistics facilities emerge and evolve in response to the agglomeration of manufacturing firms and the need to distribute their outputs to diverse areas locally and globally (Chhetri, Butcher & Corbitt, 2014: 226; Makushin & Goryachko, 2022: 527). The efficient delivery of products from the manufacturing plants to the warehousing facilities and then to the retailers is crucial; hence the optimal warehousing placement has become an important strategic decision for organisations linked to the manufacturing sector (Singh et al., 2018).
Aligned with the assertion above, De Oliveira et al. (2020) observed the spatial relationship between the location of warehouses and the concentration of commercial establishments in Belo Horizonte, Brazil. Most of the warehouses (74%) were situated in neighbourhoods with a median number of commercial establishments, showing that warehouses were positioned close to the retailers but not in more commercially densified zones (De Oliveira et al., 2020). Drawing from the literature, the paper focuses on the connections between logistics establishments and manufacturing/ industrial, retail, and office land use.
2.2 Conceptual frame of reference: The spatial clustering of logistics facilities
Clustering is a common phenomenon in spatial development. It is argued that the main factors influencing the clustering of logistics facilities include external scale economies, market demand, and government policy guidance (He et al., 2018: 7). It is crucial to highlight the vagueness of the concept of clustering because the elasticity affects its definition and empirical investigation (Martin & Sunley, 2003: 29). The literature primarily draws on the work of Porter (2000: 16), who defines a cluster as "... a geographically proximate group of interconnected... linked by commonalities and complementarities". From this definition, it should be emphasised that there should be functional linkages and interactions between the firms that constitute a cluster. Furthermore, for a cluster to exist, the linked firms must be geographically proximate (Martin & Sunley, 2003). This type of clustering is accurately referred to as spatial clustering.
Logistics clusters denote the groups of logistics firms positioned in close geographical proximity. Identifying logistics clusters is difficult because the requisite information about the firms' linkages is typically unavailable. However, given that the information on the positioning of the firms is ordinarily available, geographical proximity is often used to identify spatial clusters, unfortunately assuming or ignoring the requisite linkages and interactions (Hylton & Ross, 2018: 352). In this regard, it can be argued that the different methods that can be employed to identify and map the spatial clusters (i.e. warehousing or logistics clusters in the context of the article) best only reflect the existence and the location of possible clusters, given that no insight is provided into the inter-firm linkages (Martin & Sunley, 2003: 31).
This limitation will become apparent with the discussion of the research methods employed in the study.
In light of the connections mentioned above between logistics and manufacturing, some researchers argue that the clustering of logistics facilities is beheld as industrial and can, therefore, be identified as unique industrial clusters (He et al., 2018; Hylton & Ross, 2018; Rivera, Gilgor & Sheffi, 2016). The literature argues that agglomeration economies may give the logistics clusters peculiar advantages. Logistics clustering in industrial areas potentially grants additional benefits to the establishments, including the efficient warehousing processes and the transport services prompted by the sharing of resources and the availability of significant transport infrastructure (Sheffi, 2010; Rivera, Sheffi & Knoppen, 2016: 286). Hylton and Ross (2018) imply that, although the literature identifies logistics clusters as industrial clusters, there is a limited understanding of the logistics-related clusters compared to other cluster types. Informed by this argument, the article's analysis of warehousing clustering is not limited to the industrial areas.
3. STUDY AREA
This article is based on the study area of the City of Cape Town municipality in the Western Cape province of South Africa (Figure 1). Compared to other areas in sub-Saharan Africa, the City of Cape Town provides a business environment conducive to logistics operations; hence it is an ideal location for logistics establishments (Scholvin, 2017).
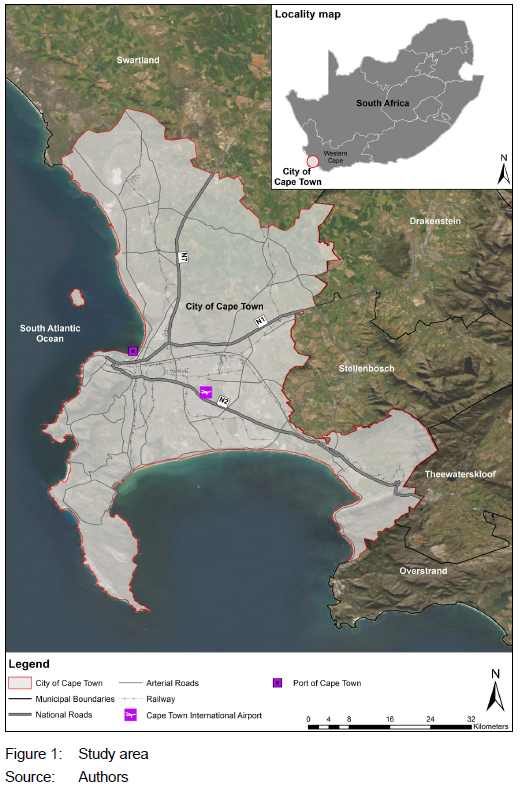
With the second-largest municipal economy in South Africa, the City of Cape Town is situated in a geographically strategic area with sea, land, and air transport connections. A diverse road-based infrastructure in the municipality, especially the national and arterial roads, is essential for logistics processes. Draper and Scholvin (2012) note that South African ports are crucial in facilitating containerised trade. In this regard, the City of Cape Town houses the second-largest container port in South Africa (GAIN Group, 2020), one of the few exceptions in sub-Saharan Africa regarding efficiency (Scholvin, 2017). Regarding air transport, the City of Cape Town municipality has the second-busiest airport in South Africa, an international gateway to the southernmost part of the African continent.
Furthermore, the municipality boasts a railway network that facilitates the transporting of passengers and freight. This network connects various areas of the municipality and facilitates transport across the regional and national scales. It is, however, essential to acknowledge that the utilisation of rail for freight has declined in South Africa over time. For instance, the rail's market share of the tonnes shipped in the country declined from 23% in 2011 to 16% in 2019 (Havenga et al., 2021: 11).
The preceding summary of the sea-, air- and land-based transport infrastructure reflects that the City of Cape Town municipality is an apt study area for analysing the locational patterns of warehousing facilities relative to other land-use categories. The importance of this infrastructure is highlighted in the findings section.
4. RESEARCH DESIGN AND METHODS
4.1 Research design
Falling within the umbrella of applied research, the study was based on a quantitative descriptive research design. The descriptive design intends to provide a picture of a phenomenon as it naturally occurs (Bickman & Rog, 2008: 15), by providing descriptions of, for instance, its size, location, and frequency. Descriptive studies, therefore, do not attempt to explain the cause-and-effect relationships between phenomena (Odongo & Ma, 2021: 764).
With important implications for data collection and analysis, correct identification of the level and units of analysis is critical in research (Bickman & Rog, 2008: 13). As alluded to in the overview of the study area section, the level of analysis used in the study was the City of Cape Town municipality, as defined by the official administrative municipal boundary. The units of analysis were the warehousing Arms (facilities) located within the municipal area. These were analysed against the industrial, retail, and office land-use categories, which were geographically aggregated at the level of the transport zones across the municipality.
4.2 Data collection
Three types of secondary data were required to address the study's aim: the locational data of the warehousing facilities; the industrial, retail, and office land-use data, and the data on the positioning of the transport infrastructure in the City of Cape Town. The geospatial information of warehousing facilities was obtained from AfriGIS in a geographic information system (GIS) shapefile format. After it was cleaned, the warehousing facilities locational data formed a foundation for the analysis. The land-use data were acquired from the City of Cape Town municipality in a geodatabase format. The geodatabase contained 2018 dataset on industrial, retail, and office floor area (in square metres) within the 848 transport zones across the municipality. Finally, the data on the positioning of the transport infrastructure (road, rail, port, and airport) were obtained from the National Geo-spatial Information in a shapefile format.
4.3 Data analysis
The kernel density spatial analysis tool was employed in ArcGIS 10.3.1 to establish and visually demonstrate the locational patterns and intensity of the warehousing facilities across the City of Cape Town municipality. A highly popular nonparametric approach (Botev, Grotowski & Kroese 2010), the kernel density tool calculates the density of the points (warehousing facilities in the context of the article) utilising a prescribed bandwidth (Carlos et al., 2010). Kernel density computes the x and y values to determine the predicted density through the following formula (Esri, n.d.):
where:
• i =1, ,n are the input points. Only include points in the sum if they are within the radius distance of the (x, y) location.
• popi = the population field value of point I, which is an optional parameter.
• disti = the distance between point i and the (x, y) location.
Once predicted, a correction is applied by multiplying the sum of the point features to ensure that the spatial integral equals the number of points (sum or population field) rather than always being equal to the value of one (Esri, [n.d.]; Mokhele & Mokhele, 2022: 12). The formula's logic is based on Silverman's (1986) quartic kernel, which calculates the distances between the point features to generate a raster output illustrating high- to low-density values. Per the literature review section discussing the use of secondary data that does not include linkages between firms (Hylton & Ross, 2018; Martin & Sunley, 2003), kernel density identifies potential spatial clusters.
The land-use data had to be categorised into several ranges to analyse the geographical distribution of the retail, industrial, and office floor area relative to the placement of the warehousing facilities. The ranges utilised for the retail land use were informed by the report of Rode & Associates (2020: 44) on the spatial trends of non-residential land-use categories in the City of Cape Town. The ranges, which were aligned with the size of shopping centres, were as follows: 5 000m2- 11 999m2, 12 000m2-24 999m2, 25 000m2-49 999m2, 50 000m2-99 999m2, and 100 000m2 and greater. For completeness of the ranges, the following low range was incorporated in the analysis: 1m2-4 999m2.
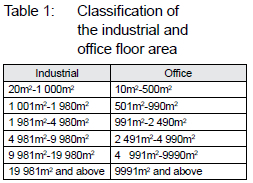
For the industrial and office land use, the analysis used the following categories of firm sizes as a starting point: fewer than 50 employees, 50-99 employees, 100-249 employees, 250-499 employees, 500-999 employees, and 1 000 and more employees (Bureau of Labor Statistics, 2019). Applying a requirement of 20m2 per person for the industrial/light manufacturing premises and 10m2 per person for the office land use, the calculated floor area ranges are displayed in Table 1.
The categories mentioned above of the retail, industrial, and office land use were employed in ArcGIS (together with the warehousing locational data) to decipher the geographical patterns between the land-use classes and the warehousing facilities.
The final part of the analysis focused on calculating the retail, office, and industrial floor area percentages in the transport zones across the municipality. This was achieved by first superimposing the warehousing facilities data on the geodatabase reflecting the retail, office, and industrial land use across the transport zones. The transport zones that did not accommodate warehousing firms were removed from the dataset in ArcGIS. Out of the 848 transport zones, only 86 accommodated warehousing facilities.
To better understand the relationship between the retail, office, and industrial floor area and the warehousing facility locations, the next step was to calculate the percentage of the floor area of each land-use category within the 86 transport zones. To achieve this, the geodatabase's attribute table was exported from ArcGIS to Microsoft Excel, where the total floor area of each land-use category in each of the 86 transport zones was tallied. The floor area of each land use was divided by the total floor area (of the three land-use types) to calculate the extent of its presence in each transport zone. To determine the floor-area density in percentage, the value was multiplied by 100. To display the calculated floor-area percentages on the maps, the geodatabase containing the 86 transport zones was catalogued into intervals of 19%. The floor-area percentage of each land use was thus divided into the following categories: 0%, 1%-20%, 21%-40%, 41%-60%, 61%-80%, and 81%-100%. This classification provided an opportunity to illustrate the density of the industrial, retail, and office land-use categories relative to each other and the concentration of the warehousing facilities.
Finally, geographically weighted regression (GWR) was used to analyse the relationships between the spatial count of warehousing, in their respective transport zones, with the three land-use categories of industrial, office, and retail. The outcome is represented as an R-squared (R2) value, which illustrates the strength of the relationship. The higher the R2 value, the stronger the relationship. Unlike the conventional regression equation, the GWR uses dependant and explanatory variables to formulate separate equations for each feature and provides custom predictions, taking into account the characteristics of the feature and those of its neighbours (Mennis, 2006: 872). Each feature's spatial coordinates are employed to compute the distances between the features. These distances were then utilised in a kernel function to calculate weights, indicating the degree of spatial relationship or dependence between different observations (Wheeler & Páez, 2010: 461).
The GWR analysis was conducted in ArcGIS 10.3.1 to determine the spatial relationship between warehousing and different land-use categories. The input features, consisting of spatially joined warehousing and land-use data, and the explanatory variable, consisting of the 'join count' of warehousing features in each transport zone, remain the same in the GWR model. The dependent variable is the only feature interchanged between the three land-use categories of industrial, office, and retail to calibrate the model's formula to determine the R2 value.
4.4 Limitations of the research
The article has three main limitations. First, the study relied solely on secondary data aggregated at the transport zone level, making the article susceptible to the modifiable areal unit problem (MAUP). The MAUP reflects the results' sensitivity to the spatial aggregation level used in the analysis (Tuson et a/., 2019).
Secondly, by its nature, descriptive research is not meant to address questions of a causal nature; hence the article cannot be used to draw causal inferences (Bickman & Rog, 2008: 16; Odongo & Ma, 2021: 764) between warehousing, transport infrastructure, and other land-use categories.
Thirdly, because the analyses were based on one study area of the City of Cape Town municipality, the findings on the relationship between warehousing, transport infrastructure and the retail, industrial, and retail land use cannot be generalised to other areas.
5. FINDINGS AND DISCUSSION
This section presents and discusses the analysis results relative to the literature reviewed in Section 2.
5.1 Clustering of warehousing facilities
In the manner of the assertion by Hylton and Ross (2018) as well as Martin and Sunley (2003) on the use of secondary data in spatial analysis, the output of kernel density analysis (in Figure 2) depicts the possible clustering of the warehousing facilities relative to the transport infrastructure, namely the national roads, arterial roads, railway lines, Cape Town International Airport, and Port of Cape Town.
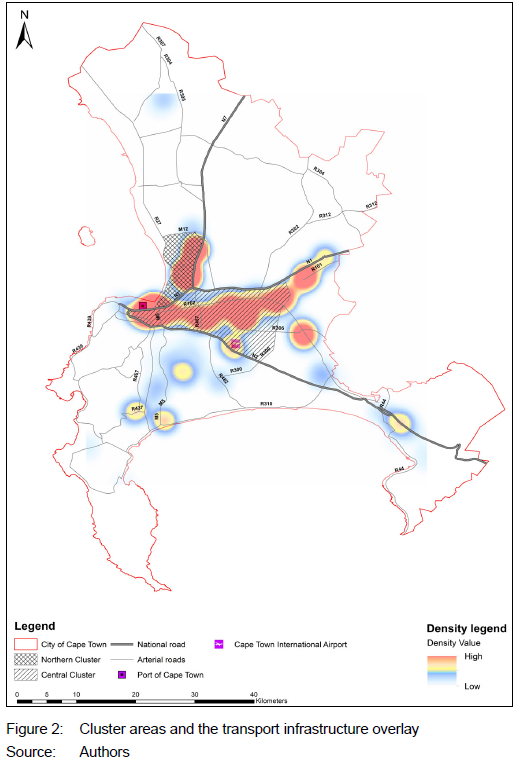
Aligned with the literature's assertion that the positioning of warehousing clusters is informed by the proximate availability of major transport infrastructure (Hylton & Ross, 2018: 3; Sheffi, 2010: 3: Rivera, Sheffi & Knoppen, 2016: 286), the warehousing density values are high around the Port of Cape Town, extending eastwards along the Voortrekker development corridor (R102) south of the N1 national road. It is noted that, in most instances, the high-density values are not abutting the N1 but are instead situated in the environs of the development corridor mentioned above. It can be deciphered that the pattern of the facilities not located along the N1 and N2 is partly influenced by the limited access granted directly off the national roads; hence the establishments are located along the arterial routes with easy access to the national roads. Furthermore, it is observed that the clustering of the warehousing facilities is positioned mainly between the N1, N2, and R300. This area is referred to as the City of Cape Town's central warehousing cluster (Figure 2). Further showing the possible influence of road-based accessibility on the placement of the warehousing facilities within the central cluster, the area in the environs of the R300/N1 junction accommodates high-density values. This segment has the potential to provide the establishments quick access to the N1 and the different areas of the municipality via the R300 road.
Moderate density values of warehousing facilities characterise the environs of Cape Town International Airport. The cluster in the airport's environs is positioned along the N2 and in the vicinity of the R300, which provides a linkage to the N1 national road. Despite the propensity of airports to be the centres of the logistics facilities clustering, the literature has shown that, given the geographically wide extent of the airport catchment, economic activities that are understood to be airport-related are not always located near airports (Mokhele & Mokhele, 2022: 5; 2023: 2).
There are islands of warehousing clusters with moderate values to the southwest of the municipality, which are positioned relatively far from the central cluster between the N1 and N2 national roads. This pattern affirms the influence of significant transport infrastructure on the positioning of logistics clusters (Hylton & Ross, 2018: 3; Rivera, Sheffi & Knoppen, 2016: 286; Sheffi, 2010: 3).
The area north of the intersection of the N1 and N7 national roads, contiguous with the port environs, also accommodates high-density values of the warehousing facilities. This zone is referred to as the City of Cape Town's northern warehousing cluster (Figure 2). From the inter-regional point of view, this location is arguably one of the most accessible points in the municipality because it is the only place where two national roads intersect (also refer to Makushin & Goryachko, 2022: 520; Pokrovskaya, Orekhov, Kapustina & Kizyan, 2020: 3).
Per the literature reviewed in Section 2 (e.g. Makushin & Goryacko, 2022; Hylton & Ross, 2018: 3; Sheffi, 2010: 3; Rivera, Sheffi & Knoppen, 2016: 286), the results show that warehousing facilities cluster in highly accessible areas within the municipality. The most significant spatial concentration is thus situated in the port's environs, in the vicinity of the main junctions, and also adjacent to arterial roads, which provide linkages to the national roads. The arterial roads are also weaved across one another, providing linkage opportunities between the cluster areas and other locations within and beyond the municipality. Although the clusters of warehousing facilities also appear to be positioned near the railway, it is acknowledged that the railway infrastructure is, in most instances, positioned parallel to the arterial routes to form an anchor of development corridors, particularly the Voortrekker corridor.
As discussed earlier in this section and displayed in Figure 2, areas with the highest density values can be grouped into two main zones: the central and the northern warehousing clusters. With the highest warehousing density values, the Port of Cape Town is positioned between these two main zones. Some areas identified with moderate and low-density values are located on the edge of these main zones. It is also observed that most of the clusters within the two primary zones are geographically proximate to one another - close enough to be regarded as a potential network of warehousing clusters. Although not analysed in the article, the network of the shared infrastructure associated with the agglomeration of warehousing facilities can promote an environment where inter-firm relationships can be established and nurtured (Makushin & Goryachko, 2022: 521; Rivera, Sheffi & Knoppen, 2016: 286). The literature partly validates the observation, as it suggests that the nature of the clusters is recognised by geographical proximity and the possible sharing of the infrastructure (Subramanian & Gunasekaran, 2016).
5.2 Location of warehousing facilities relative to the industrial, retail, and office land use
Building upon the preceding results on the clustering of the warehousing facilities in highly accessible areas within the municipality, Figure 3 shows that the largest concentration of the warehousing facilities is within the zones that accommodate the high concentration of retail, with the floor area of 50 000m2-99 999m2 and 100 000m2 and more. There is a relatively minor number of facilities within the lower range of the retail space of 5 000m2-11 999m2. The findings show that the higher the concentration of retail land use, the higher the number of warehousing facilities. To benefit from diverse traffic (i.e. public transport, foot and vehicular traffic), it is observed that the highest concentration of the retail floor space is not located off the national roads but instead positioned mainly in the vicinity of the regional roads. Retail establishments strive to secure sites with high demand potential, which can be characterised by the zones with high accessibility and traffic flow, and targeting such prime locations results in the spatial clustering of retailers (Makushin & Goryachko, 2022: 525: Nilsson & Smirnov, 2016: 111).
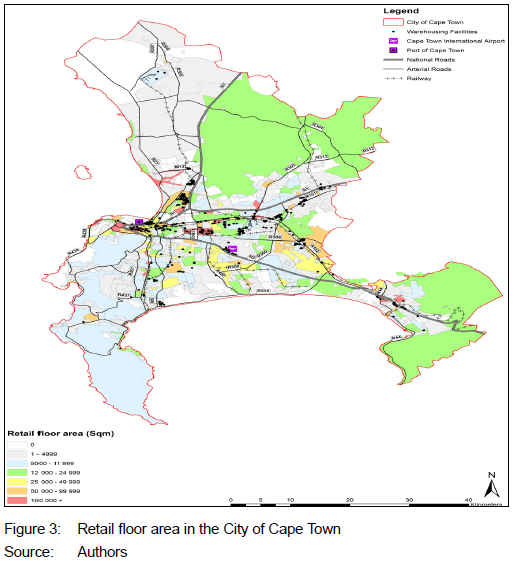
Figure 4 shows that warehousing facilities agglomerate within the areas that accommodate the largest floor area of industrial activities, specifically the zones with more than 19 980m2 of industrial floor space. In part supporting the argument that logistics space is an industrial space (He et al., 2018: 1), the results reflect a pattern between the placement of the warehousing facilities and the major industrial areas within the City of Cape Town municipality. The concentration of the industrial floor area (and accordingly warehousing) is mainly adjacent to the arterial roads, which provide linkages to the national roads (Hylton & Ross, 2018: 3; Sheffi, 2010: 3: Rivera, Sheffi & Knoppen, 2016:286). The arterial roads are weaved across one another and grant access to the industrial areas, providing various linkage opportunities. The results show that the higher the concentration of industrial land use in highly accessible areas, the higher the number of warehousing facilities.
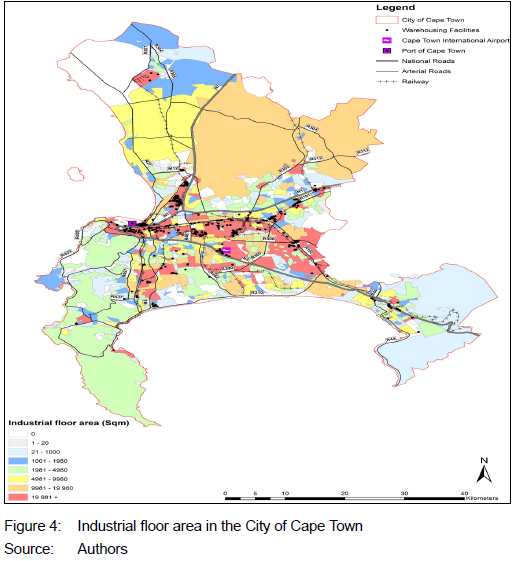
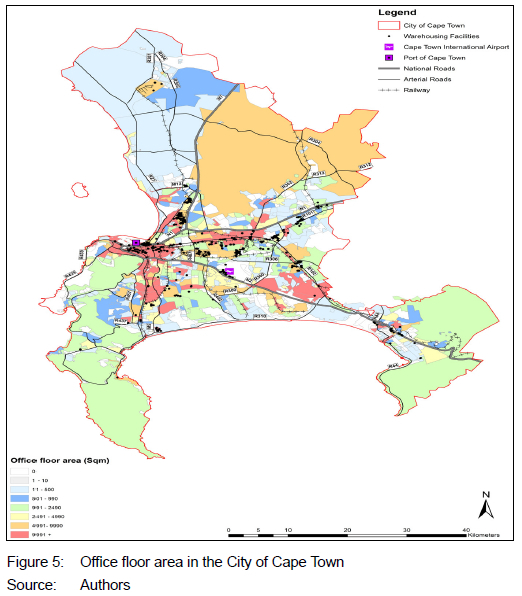
Figure 5 shows that the warehousing facilities primarily concentrate in the areas with a high floor area of office land use, i.e. the ranges of 4 991m2-9 990m2 and 9 991m2 and more. However, given that the highest range of 9 991m2 is lower compared to the highest range of the retail and industrial floor area, the nuances of the pattern in Figure 5 are addressed in the next section of the article with the discussion of the proportion of the different land-use categories relative to each other.
5.3 Proportion of the retail, industrial, and office floor area relative to each other
It was crucial to analyse further the locational patterns identified in Figures 2, 3, 4 and 5, in order to understand the relative proportion of the different land-use categories. Figure 6 depicts the percentage of the industrial, retail, and office floor area (relative to the total floor area of the three categories) in the applicable transport zones. The results confirm a connection between industrial land use and the positioning of warehousing facilities. The first plate of Figure 6 displays that the largest concentration of the warehousing facilities is situated within the zones that accommodate the most significant percentage of the industrial floor area (81%-100%) relative to the retail and office activities in a given zone. These areas represent the primary industrial nodes in the City of Cape Town (Mokhele & Mokhele, 2022: 9-10), once more cementing the potential connection between logistics (and specifically warehousing) and the industrial or manufacturing sector.
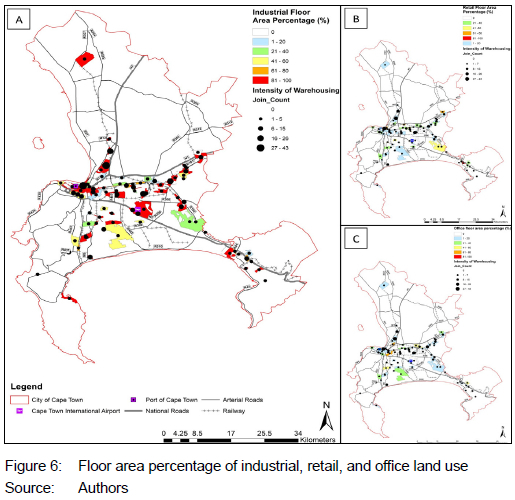
Despite the results showing a relationship between the density of the warehousing facilities and the retail land use (Figure 4), the second plate of Figure 6 shows that retail activities are not the dominant land use in the respective transport zones. The concentration of warehousing is mainly within the zones where the retail floor area comprises a minute 1%-20% of the total floor area.
Similarly, the concentration of the warehousing facilities is mainly within the zones where the office floor area makes up 1%-20% of the total floor area (third plate of Figure 6). Notably, many warehousing facilities are located in the transport zones that reflect 0% of the office floor area relative to the industrial and retail land use. The dominance of the industrial floor area causes this anomaly. Whereas Figure 5 illustrates a high office floor area in some zones, the percentage of office land use is skewed due to a disproportionately high industrial floor-area percentage. For example, one transport zone accommodated a total floor area of 2 758 477m2, with the office floor area comprising only 6 560m2. This means that the office floor area, compared to other land-use categories, equated to less than one percent, that is, 0.24%.
Table 2 illustrates that the GWR's R2 value for industrial land use was approximately 0.7408. The high R2 value indicates that roughly 74.08% of the industrial land-use data variance can be explained by the join count of warehousing features. This suggests a strong relationship between warehousing and industrial land use. The R2 value of office land use was approximately 0.0031. The very low R2 value suggests that only roughly 0.31% of the variance in the office land-use data can be explained by the join count of warehousing features. This indicates a very weak relationship between warehousing and office land use. Retail land use had an R2 value of approximately 0.1408, suggesting that the join count of warehousing features can explain approximately 14.08% of the variance in the retail land-use data. While stronger than the relationship with office land use, it is weaker than the relationship with industrial land use.
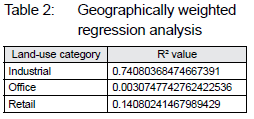
The GWR results above indicate that the relationship between the join count of warehousing features and land use varies across different land-use categories, with a strong relationship with the industrial land use, a very weak relationship with the office land use, and a moderate relationship with the retail land use. These results reflect the correlation between the logistics industry and the economy (Lan et al., 2017; Karayun et al., 2012: 25; Li & Chen, 2021: 1; Gao et al., 2018: 28; Wang, 2010: 395), and discussed further in Section 6.
6. CONCLUSION
Economic globalisation and e-commerce result in the proliferation of logistics activities and warehousing facilities in cities and regions, calling for a well-considered placement of warehousing facilities. The article analysed the locational patterns of warehousing facilities in the City of Cape Town municipality relative to different elements of the transport infrastructure and the industrial, retail, and office land use. Following the analysis of secondary data in ArcGIS, the article found connections between the placement of warehousing facilities and the transport infrastructure (road-, air-, and sea-based) and the industrial and retail land use. The warehousing facilities in the City of Cape Town are clustered in two main zones: the central cluster, positioned mainly between the N1, N2 and R300 roads, and the northern cluster, positioned north of the intersection of the N1 and N7 national roads. With the highest warehousing density values, the Port of Cape Town is positioned at the confluence these two main zones. The study also found a strong relationship between the positioning of warehousing and industrial land use, and a moderate relationship between the placement of warehousing and retail land use.
In light of the article's results summarised above, it is recommended that the City of Cape Town municipality consider the interrelated considerations below in spatial planning and land-use management efforts. These should be considered in compiling or revising the spatial development frameworks, district plans, local area plans, and zoning regulations or by-laws in the municipality.
• For the initiatives on the placement and consolidation of warehousing facilities in the municipality, the existing warehousing cluster areas should be prioritised and strengthened. This prioritisation would ensure a full realisation of the agglomeration economies within the cluster zones and improve the economic performance of the municipality. Areas that could be prioritised include the following zones and contiguous areas: the northern warehousing cluster, enclosed by the N1, N7, R27 and M12 roads, and the central warehousing cluster, bounded by the N1, N2 and R300 roads (refer to Figure 2 in Section 5.1). The municipality could introduce overlay zones in these zones to facilitate and regulate warehousing consolidation relative to the retail, office, and industrial land-use categories. Furthermore, the existing rail infrastructure could facilitate future logistics and supply chain processes. Therefore, warehousing should be promoted along the road-based infrastructure and around train stations in anticipation of future demand and improved rail service.
• The future increase of the industrial and retail floor area within the existing warehousing clusters should include a commensurate increase of warehousing floor area or vice versa. This approach would enhance the relationships between warehousing and related land-use categories by positioning them in geographically proximate areas. The municipality should, therefore, ascertain the indicative proportion between warehousing and the different land-use categories.
• For the new industrial and retail zones (or mixed-use zones) that would be established in the municipality, there should be a provision for the placement of warehousing facilities. To enhance potential linkages with the existing cluster areas, the new zones should have easy connections to major vehicular routes in the municipality, such as the N1, N2, N7, R300 and R27.
Considering these recommendations in spatial planning and land-use planning would ensure that the City of Cape Town municipality is, at least in part, prepared to cater to future warehousing needs amid the increasing e-commerce and globalisation.
REFERENCES
BICKMAN, L. & ROG, D.J. 2018. Applied research design: A practical approach. In: Bickman, L. & Rog, D.J. (Eds). The Sage handbook of applied social research methods. Thousand Oaks, CA: Sage Publications, pp. 3-43. https://doi.org/10.4135/9781483348858.n1 [ Links ]
BOTEV, Z.I., GROTOWSKI, J.F. & KROESE, D.P. 2010. Kernel density estimation via diffusion. The Annals of Statistics, 38(5), pp. 2916-2957. https://doi.org/10.1214/10-AOS799 [ Links ]
BUREAU OF LABOR STATISTICS, U.S. DEPARTMENT OF LABOR. 2019. 43.5 percent of manufacturing workers in establishments with 250 or more workers in March 2018. [Online]. Available at: <https://www.bls.gov/opub/ted/2019/43-point-5-percent-of-manufacturing-workers-in-establishments-with-250-or-more-workers-in-march-2018.htm> [Accessed: 31 August 2022]. [ Links ]
CARLOS, H.A., SHI, X., SARGENT, J., TANSKI, S. & BERKE, E.M. 2010. A density estimation and adaptive bandwidth: A primer for public health practitioners. International Journal of Health Geographies, 9. https://ijhealthgeographics.biomedcentral.com/articles/10.1186/1476-072X-9-39 [ Links ]
CHHETRI, P., BUTCHER, T. & CORBITT, B. 2014. Characterising spatial logistics employment clusters. International Journal of Physical Distribution and Logistics Management, 44(3), pp. 221-241. DOI: 10.1108/ IJPDLM-03-2012-0086 [ Links ]
DARVAZANI, H. & NORRMAN, A. 2015. Toward a relevant agenda for warehousing research: Literature review and practitioners' input. Logistics Research, 8(1), pp. 1-18. DOI: 10.1007/s12159-014-0120-1 [ Links ]
DE OLIVEIRA, L.K., LOPES, G.P., DE OLIVIERA, R.L.M. & BRACARENSE, L.D.F.P. 2020. Locational context for warehouse facilities in urban areas: A case study in Belo Horizonte (Brazil). Transportation Research Proceedia, 48, pp. 401-415. https://doi.org/10.1016/j.trpro.2020.08.048 [ Links ]
DE OLIVIERA, R.L.M., DABLANC, L. & SCHORUNG, M. 2022. Change in warehouse spatial patterns and rental prices: Are they related? Exploring the case of US metropolitan areas. Journal of Transport Geography, article 10345, pp. 1-16. https://doi.org/10.1016/j.jtrangeo.2022.103450 [ Links ]
DESOUZA, P.N., BALLARE, S. & NIEMEIER, D.A. 2022. The environmental and traffic impacts of warehouses in Southern California. Journal of Transport Geography, 104, pp. 1-7. https://doi.org/10.1016/j.jtrangeo.2022.103440 [ Links ]
DRAPER, P. & SCHOLVIN, S. 2012. The economic gateway to Africa? Geography, strategy and South Africa's regional economic relations. South African Institute of International Affairs, occasional paper No. 121. [Online]. Available at: <https://media.africaportal.org/documents/saia_sop_121_draper_scholvin_20121005.pdf> [Accessed: 17 February 2022]. [ Links ]
ESRI. [n.d.]. How kernel density works. [Online]. Available at: <https://pro.arcgis.com/en/pro-app/2.8/tool-reference/spatial-analyst/how-kernel-density-works.htm> [Accessed: 27 August 2022]. [ Links ]
GAIN GROUP. 2020. Sector study: Logistics - South Africa. [Online]. Available at: <https://www.rvo.nl/sites/default/files/2020/08/sector-study-logistics-in-south-africa.pdf> [Accessed: 25 November 2021]. [ Links ]
GAO, Y., CHANG, D., FANG, T. & LUO, T. 2018. The correlation between logistics industry and other industries: An evaluation of the empirical evidence from China. The Asian Journal of Shipping and Logistics, 34(1), pp. 27-32. https://doi.org/10.1016/j.ajsl.2018.03.004 [ Links ]
HAVENGA, J.H., DE BOD, A., SIMPSON, Z.P., SWARTZ, S. & WITTHÖF, I.E. 2021. A proposed freight and passenger road-to-rail strategy for South Africa. Helsinki: UNU-WIDER. [Online]. Available at: <https://sa-tied.wider.unu.edu/sites/default/files/SA-TIED-Havenga-Report.pdf>[Accessed: 7 August 2021]. [ Links ]
HE, M., SHEN, J., WU, X. & LUO, J. 2018. Logistics space: A literature review from the sustainability perspective. Sustainability, 10, article 2815, pp. 1-24. https://doi.org/10.3390/su10082815 [ Links ]
HYLTON, P.J. & ROSS, C.L. 2018. Agglomeration economies' influence on logistics clusters' growth and competitiveness. Regional Studies, 52(3), pp. 350-361. https://doi.org/10.1080/00343404.2017.1327708 [ Links ]
JALLER, M., PINEDA, L. & PHONG, D. 2017. Spatial analysis of warehouses and distribution centres in Southern California. Transportation Research Record: Journal of the Transportation Research Board, 2610(1), pp. 44-53. https://doi.org/10.3141/2610-06 [ Links ]
KARAYUN, I., AYDIN, H.I. & GULMEZ, M. 2012. The role of logistics in regional development. Annals - Economy Series, 4, pp. 25-31. [ Links ]
LAN, S., YANG, C. & HUANG, G.Q. 2017. Data analysis for metropolitan economic and logistics development. Advanced Engineering Informatics, 32, pp. 66-76. https://doi.org/10.1016/j.aei.2017.01.003 [ Links ]
LI, G., FENGJUN, J., CHEN, Y., JIJUAN, J. & SIJING, L. 2017. Location characteristics and differentiation mechanism of logistics nodes and logistics enterprises based on points of interest (POI): A case study of Beijing. Journal of Geographical Sciences, 27(7), pp. 879-896. https://doi.org/10.1007/s11442-017-1411-7 [ Links ]
LI, X. 2014. Operations management of logistics and supply chain: Issues and directions. Discrete Dynamics in Nature and Society, Article 701938, pp. 1-7. 10.1155/2014/701938. [ Links ]
LI, X. & CHEN, F. 2021. Impact of logistics development on economic growth: An empirical research from Guangdong province in China. Complexity, article 9950935, pp. 1-12. https://doi.org/10.1155/2021/9950935 [ Links ]
MAKUSHIN, M.A. & GORYACHKO, M.D. 2022. The geographical patterns of the warehouse property market in the Moscow urban agglomeration. Urban Studies, 12(4), pp. 520-530. https://doi.org/10.1134/S2079970522700253 [ Links ]
MARTIN, R. & SUNLEY, P. 2003. Deconstructing clusters: Chaotic concept or policy panacea? Journal of Economic Geography, 3(1), pp. 5-35. https://doi.org/10.1093/jeg/3.1.5 [ Links ]
MENNIS, J. 2006. Mapping the results of geographically weighted regression. Cartographic Journal, 43(2), pp. 171-179. DOI: 10.1179/000870406X114658 [ Links ]
MOKHELE, M. & FISHER-HOLLOWAY, B. 2022. Inclusion of warehousing and distribution in the Cape functional region's spatial plans. Town and Regional Planning, 80, pp. 66-76. DOI: https://doi.org/10.18820/2415-0495/trptrp80i1.7 [ Links ]
MOKHELE, M. & MOKHELE, T. 2022. Spatial configuration of logistics Arms relative to Cape Town International Airport, South Africa. Logistics, 6(3), article 49. https://doi.org/10.3390/logistics6030049 [ Links ]
MOKHELE, M. & MOKHELE, T. 2023. Characterization of airfreight-related logistics Arms in the City of Cape Town, South Africa. Logistics, 7(3), article 38. https://doi.org/10.3390/logistics7030038 [ Links ]
NILSSON, I.M. & SMIRNOV, O.A. 2016. Measuring the effect of transportation infrastructure on retail Arm co-location patterns. Journal of Transport Geography, 51, pp. 110-118. https://doi.org/10.1016/j.jtrangeo.2015.12.002 [ Links ]
ODONGO, J.O. & MA, D.K. 2021. Perspectives in urban planning research: Methods and tools. Current Urban Studies, 9(4), pp. 759-778. https://doi.org/10.4236/cus.2021.94045 [ Links ]
POKROVSKAYA, O., OREKHOV, S., KAPUSTINA, N. & KIZYAN, N. 2020. Formation of logistics facilities in transport corridors. IOP Conference Series: Materials Science and Engineering, 918. DOI:10.1088/1757-899X/918/1/012032 [ Links ]
PORTER, M.E. 2000. Location, competition, and economic development: Local clusters in a local economy. Economic Development Quarterly, 14(1), pp. 15-34. https://doi.org/10.1177/089124240001400105 [ Links ]
RIVERA, L., GILGOR, D. & SHEFFI, Y. 2016. The benefits of logistics clustering. International Journal of Physical Distribution & Logistics Management, 46(3), pp. 242-268. https://doi.org/10.1108/IJPDLM-10-2014-0243 [ Links ]
RIVERA, L., SHEFFI, Y. & KNOPPEN, D. 2016. Logistics clusters: The impact of further agglomeration, training, and firm size on collaboration and value added services. International Journal of Production Economics, 179, pp. 285-294. DOI: 10.1016/j.ijpe.2016.05.018 [ Links ]
RODE & ASSOCIATES. 2020. Commercial property trends in Cape Town up to 2040. [ Links ]
SCHOLVIN, S. 2017. Cape Town as a gateway city: Interlinking the sub-Saharan oil and gas sector globally. In: Paddison, R. (Ed.). Cities in the global economy. London: Sage, pp. 256-272. [ Links ]
SHEFFI, Y. 2010. Logistics intensive clusters. Cuadernos Aragoneses De, 20(1), pp. 11-17. [ Links ]
SILVERMAN, B.W. 1986. Density estimation for statistics and data analysis. New York: Chapman and Hall. [ Links ]
SINGH, R.K.R., CHAUDHARY, N. & SAXENA, N. 2018. Selection of warehouse location for a global supply chain: A case study. IIMB Management Review, 30, pp. 343-356. https://doi.org/10.1016/j.iimb.2018.08.009 [ Links ]
SUBRAMANIAN, N. & GUNASEKARAN, A. 2016. Fourth party logistics service providers and industrial cluster competitiveness: Collaborative operational capabilities framework. Industrial Management & Data Systems, 116(7), pp. 1303-1330. https://doi.org/10.1108/IMDS-06-2015-0248 [ Links ]
TAYLOR, M.A., TSENG, Y. & YUE, W.L. 2005. The role of transportation in logistics chain. Texila International Journal of Management, 5(1), pp. 1657-1672. DOI: 10.21522/tijmg.2015.05.01.art015 [ Links ]
TUSON, M., YAP, M., KOK, M.R., MURRAY, K., TURLACH, B. & WHYATT, D. 2019. Incorporating geography into a new generalized theoretical and statistical framework addressing the modifiable areal unit problem. International Journal of Health Geographies,18, article 6. https://doi.org/10.1186/s12942-019-0170-3 [ Links ]
VERHETSEL, A., KESSELS, R., GOOS, P., ZIJLSTRA, T., BLOMME, N. & CANT, J. 2015. Location of logistics companies: A stated preference study to disentangle the impact of accessibility. Journal of Transport Geography, 42, pp. 110-121. https://doi.org/10.1016/j.jtrangeo.2014.12.002 [ Links ]
WANG, A. 2010. Research of logistics and regional economic growth. iBusiness, 2, pp. 395-400. https://doi.org/10.4236/ib.2010.24052 [ Links ]
WHEELER, D.C. & PÁEZ, A. 2010. Handbook of applied spatial analysis. In: Fischer, M. & Getis, A. (Eds). Handbook of applied spatial analysis. Heidelberg: Springer Berlin, pp. 461-462. DOI: 10.1007/978-3-642-03647-7 [ Links ]
XIAO, Z., YUAN, Q., SUN, Y. & SUN, X. 2021. New paradigm of logistics space reorganization: E-commerce, land use, and supply-chain management. Transportation Research Interdisciplinary Perspectives, 9, pp. 1-11. https://doi.org/10.1016/j.trip.2021.100300 [ Links ]
YAN, B., DONG, Q., LI, Q., YANG, L. & AMIN, F.U.I. 2022. A study of the interaction between logistics industry and manufacturing industry from the perspective of integration field. PLoS ONE, 17(3), pp. 1-39. https://doi.org/10.1371/journal.pone.0264585 [ Links ]
YUAN, Q. 2019. Planning matters. Institutional perspectives on warehousing development and mitigating its negative impacts. Journal of the American Planning Association, 85(4), pp. 525-543. DOI: 10.1080/01944363.2019.1645614 [ Links ]
ZHENG, W-L., WANG, J-W., MAO, X.H. & LI, J.-F. 2022. Ecological efficiency evaluation and spatiotemporal characteristics analysis of the linkage development of the logistics industry and manufacturing industry. Frontiers in Energy Research, vol. 9, article 709582, pp. 1-13. DOI: 10.3389/fenrg.2021.709582 [ Links ]
Received: June 2023
Peer reviewed and revised: September 2023
Published: December 2023
* The author(s) declared no potential conflicts of interest with respect to the research, authorship, and/or publication of this article

