


Servicios Personalizados
Articulo
 Inglés (pdf)
 Articulo en XML
 Referencias del artículo
Indicadores

Links relacionados
-
 Citado por Google
 -
 Similares en Google
Compartir

 Permalink
Town and Regional Planning
versión On-line ISSN 2415-0495
versión impresa ISSN 1012-280X
Town reg. plan. (Online) vol.83 Bloemfontein 2023
http://dx.doi.org/10.38140/trp.v83i.7472
REVIEW ARTICLE
Transit-oriented development, development corridors and economic access: The Louis Botha development corridor's impact
Vervoer-georiënteerde ontwikkeling, ontwikkelingskorridors en ekonomiese toegang: die impak van die Louis Botha-ontwikkelingskorridor
Tsoelopele e shebaneng le lipalangoang, litsela tsa nts'etsopele le phihlello ea moruo: tsusumetso ea Louis Botha development corridor
Bradley van der WaltI; Ockert PretoriusII
IB (Hons) student, Department of Urban and Regional Planning, University of Johannesburg, Johannesburg, 2006, South Africa. Phone: (+27) 71 372 7305, email: vanderwaltbradley@gmail.com, ORCID: https://orcid.org/0009-0003-1503-8327
IILecturer, Department of Urban and Regional Planning, University of Johannesburg, Johannesburg, 2006, South Africa. Phone: (+27) 11 559 6428, email: opretorius@uj.ac.za, ORCID: https://orcid.org/0000-0002-9353-820X
ABSTRACT
Apartheid's impact on South Africa's urban spatial patterns persists, resulting in spatial fragmentation and inequality. Unsustainable urban sprawl exacerbates challenges related to economic access. To address said challenges, the City of Johannesburg (CoJ) implemented the Corridors of Freedom (CoF) initiative, emphasising economic inclusion. Amid substantial public sector investment, the initiative prioritised the Louis Botha Development Corridor (LBDC) to create a dense, mixed-use, walkable urban environment. However, limited research investigated the LBDC's impact from an economic access perspective. This study investigates how the LBDC has improved economic access and provides policy insights for urban areas in South Africa, within the conceptual framework of transit-oriented development (TOD) and development corridors. A quantitative research approach using Network Analyst reveals that the Rea Vaya Bus Rapid Transit (BRT) system increased economic access by 16% compared to other LBDC transport services. This study demonstrates the potential of the dual implementation of TOD and development corridors to foster economic access in the study area and concludes with policy recommendations centred on cross-departmental collaboration, feasibility studies and risk allocation, location-based criteria and transit accessibility targets, transit-oriented design guidelines, and integrated transport systems.
Keywords: Development corridors, economic access, Louis Botha Development Corridor, spatial data analysis, transit-oriented development
OPSOMMING
Apartheid se impak op Suid-Afrika se stedelike ruimtelike patrone duur voort, wat lei tot ruimtelike fragmentasie en ongelykheid. Onvolhoubare stedelike uitbreiding vererger uitdagings verbonde aan ekonomiese toegang. Om genoemde uitdagings aan te spreek, het die Stad Johannesburg (CoJ) die 'Corridors of Freedom' (CoF) inisiatief geïmplementeer, met klem op ekonomiese insluiting. Te midde van aansienlike investering deur die publieke sektor, het die inisiatief die Louis Botha Ontwikkelingskorridor (LBDC) beklemtoon om 'n digte, gemengde gebruik, loopbare stedelike omgewing te skep. Nietemin, beperkte navorsing het tans die LBDC se impak vanuit 'n ekonomiese toegangsperspektief ondersoek. Hierdie studie ondersoek hoe die LBDC ekonomiese toegang verbeter het en verskaf beleidsinsigte vir stedelike gebiede in Suid-Afrika, binne die raamwerk van vervoer-georiënteerde ontwikkeling (TOD) en ontwikkelingskorridors. 'n Kwantitatiewe navorsingsbenadering met gebruik van 'Network Analyst' toon dat die Rea Vaya Bus Rapid Transit (BRT) stelsel ekonomiese toegang met 16% verbeter het in vergelyking met ander LBDC vervoerdienste. Hierdie studie demonstreer die potensiaal van die gesamentlike implementering van TOD en ontwikkelingskorridors om ekonomiese toegang in die studie area te bevorder en sluit af met beleidsaanbevelings wat sentreer op geïntegreerde vervoerstelsels, onder andere.
KAKARETSO
Tsusumetso ea puso ea khethollo tsamaisong ea libaka tsa litoropo tsa Afrika Boroa e ntse e tsoela pele, 'me e khina teka-tekano ea libaka. Khaho e sa tsitsang ea litoropo e mpefatsa mathata a amanang le phihlello ea moruo. Ho rarolla liqholotso tse boletsoeng, Toropo ea Johannesburg (CoJ) e kentse tsebetsong morero oa Corridors of Freedom (CoF), o tobokelitseng kenyeletso ea moruo. Har'a matsete a mangata a lekala la sechaba, boikitlaetso bona bo beile pele Louis Botha Development Corridor (LBDC) ho theha tikoloho ea litoropo e teteaneng, e tsoakiloeng, e ka tsamauoang. Leha ho le joalo, lipatlisiso tse fokolang li ile tsa batlisisa phello ea LBDC ho latela pono ea phihlello ea moruo. Patlisiso ena e lekola ka moo LBDC e ntlafalitseng phihlello ea moruo le ho fana ka leseli la maano bakeng sa libaka tsa litoropo tsa Afrika Boroa. E boetse e seka-seka LBDC e ikamahantse le moralo oa nts'etsopele e shebaneng le lipalangoang (TOD) le liphaseje tsa nts'etsopele. Mokhoa oa ho etsa lipatlisiso o sebelisang Network Analyst o senola hore tsamaiso ea Rea Vaya Bus Rapid Transit (BRT) e ekelitse phihlello ea moruo ka 16% ha e bapisoa le litsebeletso tse ling tsa lipalangoang tsa LBDC. Boithuto bona bo bonts'a bokhoni ba ho kenya ts'ebetsong habeli ha TOD le litsela tsa nts'etsopele ho khothaletsa phihlello ea moruo sebakeng sa boithuto. E boetse e phethela ka likhothaletso tsa maano tse shebaneng le tsebelisano-mmoho ea mafapha a fapaneng, boithuto, litekanyetso tse thehiloeng le lipehelo tsa phihlello ea lipalangoang, tataiso ea moralo e tsepamisitsoeng, le litsamaiso tse kopanetsoengng tsa lipalangoang.
1. INTRODUCTION
South Africa's extensive landscapes were heavily moulded by the apartheid system's racial segregation ideology (Du & Gelman, 2018; Geyer & Du Plessis, 2013: 37). As such, Coloured, Black, and Indian inhabitants were restricted to residing in overpopulated and under-serviced townships on the far outskirts of cities (Geyer & Du Plessis, 2013: 39). While effort has been exerted since 1994 to mend South Africa as a whole, the country is still the face of fragmentation (Hofer et al., 2021: 1855). The essence of apartheid planning lingers in South Africa's urban spatial patterns, manifesting in spatial inequality, fragmentation, and urban sprawl (Dewar, 2017: 28). The relatively unplanned growth of cities, driven by rural-urban migration (Yiran et al., 2020: 14) and policy-led housing development beyond the periphery (De Swardt et al., 2005: 101), has led to a spatial pattern featuring low-density residential areas and high-density townships (Yusuf & Allopi, 2010). This unsustainable expansion deprives disadvantaged populations without private modes of transport of economic access (Musakwa & Van Niekerk, 2014: 4), as sprawl in its various forms obstructs accessibility by reducing the quality of residential and destination accessibility (Torrens & Alberti, 2000: 24), altering travel patterns (Musakwa & Niekerk, 2014: 2), increasing travel times and distances between land uses, and diminishing walkability (Wang, Shi & Zhou, 2020). The enduring sprawl intensifies economic accessibility challenges (Tomlinson, 2019). Disadvantaged communities in South Africa depend heavily on economic access (Tomlinson, 2019), a fundamental element for household well-being, regional competitiveness, community health, social connections, and upward mobility (Mahendra & Seto 2019: 4). Employment, in particular, fosters personal meaning, social networks, and overall quality of life by providing economic benefits and vital resources (Giloth, 2019: 1; Cartwright & Marrengane, 2016). Given the significance of economic access, the associated spatial challenges need to be overcome.
In an attempt to correct the spatial mismatch between areas of economic opportunity and human settlements, the City of Johannesburg (CoJ) incorporated transport-related investments in their service-provision programmes (Cartwright & Marragane, 2016: 23). To provide strategic direction for these investments, the CoJ turned to transit-oriented development (TOD) through its Corridors of Freedom (CoF) initiative, with particular focus on economic inclusion (Wood, 2021: 2460). The foundations of the CoF initiative, including the Louis Botha Development Corridor (LBDC), were laid in 2006 to promote TOD and mixed-use development along the Bus Rapid Transit (BRT) network (Harrison et al., 2019: 3). Political support was secured in 2013, accompanied by detailed strategic frameworks for the LBDC and other corridors, with a decade-long capital budget of R1.5 billion (Harrison et al., 2019: 4). Infrastructure upgrades and social facility enhancements commenced in 2014, with the LBDC reaching 50% completion by June 2015 (Planact, 2018: 17).
Despite a leadership change in August 2016, the project continued as the 'Transit Oriented Corridors', achieving substantial infrastructure improvements as of 2016, including road resurfacing, BRT stations, housing developments, clinics, urban precincts, parks, and pedestrian bridges (Planact, 2018: 17).
The CoF initiative, composed of development corridors, seeks to alter ingrained spatial patterns and guide future city growth towards areas with a complete selection of social services and amenities and quality transit infrastructure services (CoJ, 2012: 13). It strives to create more inclusive and accessible opportunities for the residents of Johannesburg and economies of scale that are attractive to investors by optimising compact, connected, and resilient development in and around high-intensity movement corridors (CoJ, 2012: 12). This initiative represents the convergence of the concepts of TOD and development corridors through their shared aim of creating integrated, efficient, and sustainable urban environments through hubs of mixed-use, compact, and high-density development located around transit nodes (CoJ, 2012: 17). The central objective of their dual implementation is the manifestation of well-connected, accessible, economically diverse, and socially inclusive neighbourhoods and precincts where residents can live, work, and access urban amenities and opportunities within close proximity to reliable public transportation. Ultimately, the objective is to reduce travel times, distances, and economic exclusion, enhancing overall urban inclusion and liveability.
Numerous studies have been conducted on TOD and development corridors and their implementation within the South African context. Masingi (2019) studied the CoF flagship programme and its associated projects and their potential in stimulating employment in the townships of Soweto and Kagiso. Lionjanga and Venter (2017) focused on well-being improvements associated with the CoF and the Rea Vaya BRT system. Simoes (2014), on the other hand, studied the Turffontein Development Corridor (TDC), with specific focus on non-motorised transportation. Existing studies, respectively, identify potential economic and social benefits associated with the CoF, including through the effects of the Rea Vaya BRT system and the accelerated provision of affordable housing. However, limited research has been undertaken on the broad potential of CoF in mitigating urban challenges in South Africa and the required policy interventions to extract said potential. In the context of the CoF, further research is required to identify policies that are transferable to different contexts, in order to enhance potential accessibility benefits. This reflects the aim of the research, which is to determine the potential of the strategic implementation of TOD and development corridors in mitigating central spatial challenges in the South African urban milieu, with specific reference to economic access. The associated objectives in this regard are to analyse the impact of the LBDC on increasing economic access in the CoJ, and to investigate the features of the policy environment central to the successful implementation of LBDC and the broader CoF initiative in the CoJ. A related contribution of this research is thus to inform policy interventions in other cities in South Africa and other developing countries toward the synergistic implementation of TOD and development corridors.
The motive in selecting the LBDC is centred on the availability of ample industrial land, its diverse population, decaying precincts, and medium-density developments. This underlines the economic potential of the study area and its central role in providing access to opportunities to local and regional communities (CoJ, 2012: 28). Selecting the LBDC enables the investigation of the CoF initiative as a holistic intervention toward improved infrastructure, services, and stimulating economic accessibility for communities from different backgrounds and income levels (Planact, 2018 18). While featuring a mix of residential, commercial, and retail spaces, the LBDC is predominantly residential in nature, catering for a wide range of income groups and spatial preferences. Functioning as a residential area, the corridor is characterised by a fairly equitable distribution of social services and infrastructure. As a potential transport hub in the future, the corridor forms part of Phase 1C of the Rea Vaya BRT system and is serviced by supporting public transport systems such as Gautrain buses, Minibus Taxis, and Metrobus (CoJ, 2013: 29).
As this study follows a quantitative research methodology, GIS was used to conduct a spatial analysis (through the Network Analyst tool) to investigate the extent to which the LBDC has improved economic access. In addition, the related policy environment is discussed to provide insights on TOD and development corridor implementation in the CoJ and other South African and developing country contexts.
2. LITERATURE REVIEW
The objective of the literature review is to provide an overview of challenges related to economic access in different contexts, as well as an overview of the TOD and development corridor concepts as potential planning instruments for urban spatial challenges in South Africa.
2.1 Challenges of economic access
The overall spatial patterns of cities in the Global North and South embody, to different degrees, urban sprawl (Van Niekerk, 2018: 70). In the Global North, urban areas rank relatively high in multiple dimensions of sprawl, bringing about significant environmental, economic, and social consequences (OECD, 2018: 6, 11). Spatial patterns consist of suburban developments that are mainly mono-functional and dispersed in nature (Dieleman & Wegener, 2004). In most instances, the consequence of these sprawled development patterns is poor destination accessibility (Torrens & Alberti, 2000: 24), due to greater travelling distances between residences and economic opportunities. In the Global South, urban areas are generally characterised by urban sprawl manifesting in informal, high-density settlements (Oyalowo, 2022: 694; Van Niekerk, 2018: 70). Access to areas of economic opportunity is limited, due to, inter alia, isolated, peripheral residential developments, the lack of access roads, as well as the fragmented nature of urban growth (OECD, 2018: 6; Reyes & Peon, 2022). As such, the spatial pattern and location of formal and informal housing developments in urban areas in the Global South hinder inclusion, mobility, and access to economic opportunities and other essential destinations.
These characteristics are also reflected in South Africa's urban structure, due to colonial and apartheid spatial planning (Adebayo, 2012: 6). The cost of urban sprawl is the quality of the disadvantaged population's living environment (Tomlinson, 2019) and deprivation of economic access - for those without private vehicles (Musakwa & Van Niekerk, 2014: 2) - to factories, shopping centres and other forms of business facilities (Parliamentary Liaison Office, 2017: 2). Urban sprawl is the source of an undesirable externality - unsustainable development - and, by extension, a condition of poor accessibility (Ewing, 2008; Frenkel & Ashkenazi, 2008: 3). The latter is due to communities being located far from opportunities and said opportunities themselves being spatially segregated and dispersed (Torrens & Alberti, 2000: 24), decreasing walkability and increasing travelling time (Bowyer, 2015: 69; Wang et al., 2020).
Access relates to the ease or difficulty of reaching opportunities or destinations (Mahendra & Seto, 2019: 4), and may be improved by aligning residential locations with urban opportunities (Yuliastuti, Sukmawati & Purwoningsih, 2018), or improving transport networks and connectivity. Opportunity, in this context, refers to the economic sphere, i.e. employment opportunities, and is measured using units of time or distance (Venter & Cross, 2014: 44). In this study, economic access refers to reaching employment opportunities, which is identified as properties zoned as either business, commercial, and industrial, as these provide goods and services which require labour as a factor of production (CoJ, 2018).
2.2 The development corridor concept
A development corridor links two economic nodes at each end via nodal lines, with the nodes functioning as key points in towns, cities, or industrial areas (Brand, 2018: 63). These nodes are interdependent, facilitating the flow of economic activities, including both physical transport and information sharing (Brand, Geyer & Geyer, 2017: 12). The interaction between nodes drives the development corridor's vitality, fostering further growth and development potential (Geyer, 1988). Development corridors involve dense economic activity along their routes, which stimulate various markets and offer advantages to adjacent areas (Harrison & Todes, 1996: 70). Serving as spatial instruments to connect different land uses and nodes in cities (Brunner, 2013: 2), corridors may foster urban growth and promote economic interaction (Yeates, 1984), and may be implemented to mitigate unique challenges in specific contexts, including addressing spatial disparities and foster sustainable development. These corridors are strategically identified for investment and are a focus of economic and spatial policies (Juffe-Bignoli et al., 2021: 2). Development corridors are formed through the integration of axes (Brand & Drewes, 2021: 2696), representing nodal lines that agglomerate infrastructure and communication, fostering socio-economic interactions (Geyer, 1988). They serve as conduits between market supply and demand, playing a pivotal role in a city's economic landscape, enabling the movement of goods and people while shaping their economic footprint (Brunner, 2013: 1; Brand & Drewes, 2020: 122). Central to development corridors are integrated transportation networks, including rail, air, road, and sea, which facilitate the seamless connection of processes such as consumption, production, and distribution (Yeates, 1984) within and between key economic hubs (Hope & Cox, 2015: 45). High economic cohesiveness in said networks leads to corridors with dispersed impacts, while low cohesiveness results in clustered, isolated effects (Brand, 2018: 67). Network effects are as important to development corridors as economic viability and the integration and attraction between urban centres. Four critical factors in network development, as emphasised by Felipe et al. (2012), include vertical network integration, which depends on land use and population densities, impacting accessibility, economic activity, and movement; information network integration, which fosters knowledge exchange, spurring regional investments, integration, and knowledge sharing for economic growth; complete transport networks, including links and nodes, which cut transaction costs, enhance reliability, and play a pivotal role in economic activity, as well as interconnectivity in technologies, which expands trade and interaction.
2.3 The TOD concept
TOD has emerged as a planning instrument capable of mitigating the proliferating outcomes of urban sprawl and reduced mobility (Ibraeva et al., 2020; Li et al., 2019). Central to TOD is its propagation of moderate-to high-density developments that foster mixed-use communities within 0.8km-1km - or walking distance - from the nearest local transit stations (De Vos, Van Acker & Witlox, 2014: 2; Lang et al., 2020: 2). TOD fosters a complementary integration between land and movement (FasTracks, 2008), catalysing synergies to bring about economic, social, and environmental benefits.
Furlan et al. (2019: 127) state that TOD strives to design and plan communities to provide spaces that enhance liveability, achieve low-impact and eco-mobility public transport systems, and create a future model for eco-cities. From an access perspective, TOD strives to increase opportunities for communities to satisfy their daily travel needs through the use of non-motorised (Evans & Pratt, 2007: 2) and public transportation (Li et al., 2019; Nyunt & Wongchavalidkul, 2020: 57). Non-transportation objectives of TOD include, inter alia, supporting economic revitalisation or development; reducing infrastructure-related costs; providing affordable quality housing options; encouraging smart growth (Cervero et al., 2004), and mitigating urban sprawl (Papa & Bertolini, 2015: 70).
The latter is achieved by promoting compact, dense development through the agglomeration of unique places, linking public services, workplaces, recreational activities, and transit stations (Lang et al., 2020: 2). In effect, the clustering of jobs, industries, residences, and retail destinations close to public transit facilities means that areas of economic opportunity are more concentrated and accessible, increasing regional population and employment density (Noland et al., 2014: 16). TOD thus creates nodes with improved access to ensure higher frequencies of service delivery and accessibility (Singh et al., 2017). With regard to economic access, the TOD factor, destination accessibility (Ogra & Ndebele, 2014: 540), refers to the development of transport systems in a way that facilitates access to a range of destinations such as social, employment, and recreational facilities (Sivakumaran et al., 2014). From a density perspective, access is a significant aspect of TOD (Singh et al., 2017).
There are various required planning instruments to ensure successful TOD implementation, as illustrated in Table 1.
TOD seeks to promote urban developments characterised by walkability, high population density, mixed-use, access to public transport, and, ultimately, accessibility (Jackson & Kochitzky, 2009).
2.4 Synergies in TOD and development corridor implementation
There is significant potential synergy inherent to the dual implementation of TOD and development corridors. The first is with reference to integrated development, with TODs manifesting as high-density, compact, mixed-use nodes connected by corridors that facilitate the movement of trade, goods, and people between the stations and adjacent areas (Noichan & Dewancker, 2018). This enhances the potential diffusion of economic activity, both in the concentrated locations of the transit stations and in the precincts linear to the corridor infrastructure. Their dual implementation is also mutually beneficial to both components (Garcia & Crookston, 2019), with the corridor improving access to TOD nodes, increasing their viability, while increased usage of the corridors enhances their attractiveness in terms of linear development and investment in adjacent areas. This mutual benefit translates in increased economic potential of the area in which they are located, stimulating vibrancy, activity, and production, while increasing connectivity for local and regional communities to access opportunities as a result of development synergies.
Case studies of dual implementation include Portland, Oregon, where a rail corridor connects the city centre to the northern parts of the city (Borkowitz et al., 2013). This rail line has stimulated linear, mixed-use development along its route, in addition to providing access to a multitude of areas and opportunities to local residents and communities. The rail stations are developed as TODs, where planning incentives have been put in place to attract high-density, compact developments, including affordable housing and commercial spaces. Similarly, Curitiba, in Brazil, has implemented a BRT system with various axes that connect different parts of the city (DeWeerdt, 2016: 53; Harrison et al., 2019: 8). Diverse residential and commercial land uses have located along the road infrastructure of the corridors which act as catalysts of growth, while specific zoning regulations have been put in place adjacent to BRT stations, acting as TODs, to encourage high-density and mixed-use development. This has attracted additional economic activities toward the corridors and stations, stimulating output and opportunity creation, and facilitating access.
2.5 TOD, development corridors, and the CoF
The CoF concept in Johannesburg has effectively applied TOD principles to transform the city's urban landscape (CoJ, 2012: 9). This concept aligns with TOD principles by emphasising high-density, mixed-use development in close proximity to transit nodes, progressively decreasing density further from the city core (Lang et al., 2020). By promoting these high-density living and working environments, the CoF aim to create vibrant, people-centric urban areas consistent with TOD ideals. A core element of the CoF concept is its focus on transit infrastructure (CoJ, 2012: 9). These development corridors are designed to be the backbone of the city's transportation system, and the plan actively encourages the use of public transport over private vehicles (CoJ, 2012: 14). This approach not only reduces travel times and costs but also makes public transit more accessible, fostering a transit-oriented lifestyle.
The CoF, like TOD principles, place a strong emphasis on reducing private car usage (Calthorpe, 1997). This is achieved by prioritising pedestrian-oriented development, limiting managed parking, and providing convenient transit stops and stations along the development corridors (CoJ, 2012: 17). By discouraging private vehicle use, both concepts aim to create cleaner and more sustainable urban environments. Furthermore, the CoF envision the creation of compact and walkable communities around transit nodes and along the corridors (CoJ, 2012: 13). These neighbourhoods are designed to be supported by social amenities, local shops, parks, schools, and clinics, making it convenient for residents to access essential services and public transit facilities on foot (CoJ, 2012: 13). Economic opportunities are a key focus of CoF, aiming to stimulate economic growth and support small-scale informal economies (CoJ, 2012: 17). By bringing living and working spaces into close proximity, residents can access job opportunities without the need for lengthy commutes (Noland et al., 2014).
3. STUDY AREA
Located in the north of Johannesburg, South Africa, the LBDC is situated between the Johannesburg central business district (CBD) and the northern parts of the city around the township of Alexandra (Risimati, Gumbo & Chakwizira, 2021). The location of the LBDC is indicated in Figure 1.
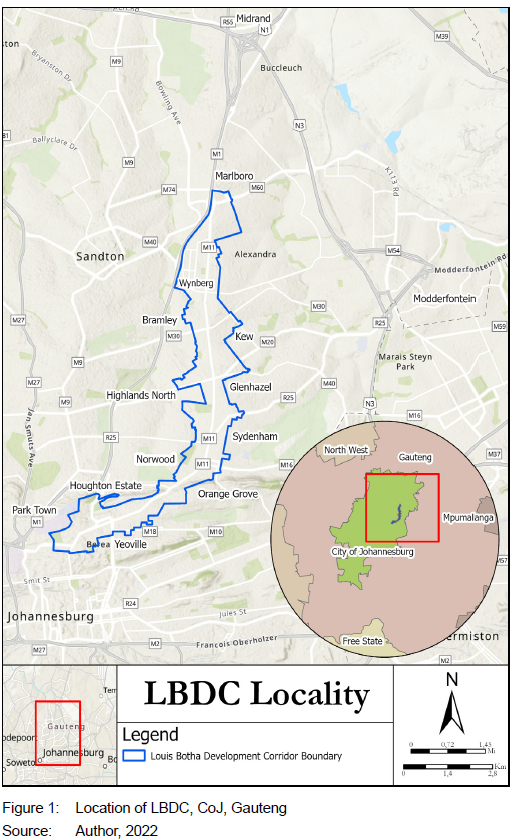
While residential areas such as Sydenham, Orange Grove, Houghton Estate, Observatory, and Belle-Vue dominate the southern parts of the corridor, industrial and commercial areas such as Wynberg, Bramley, and Kew make up most of the northern parts of the corridor (CoJ, 2012: 26). The corridor has significant links to major employment, economic, and growth nodes in the city such as Midrand, Sandton, and Greenstone/ Modderfontein (Risimati, Gumbo & Chakwizira, 2021: 718). The CoF were rolled out to connect the remote and marginalised settlements located in the northern and southernmost parts of the CoJ (Harrison et al., 2019: 3). This was done in an attempt to link various adjacent municipalities, enabling access to employment opportunities while bringing people together. The LBDC constitutes Phase 1C of the Rea Vaya BRT, which includes designated lanes and bus stations (Wood, 2021: 2460).
4. RESEARCH METHODOLOGY
Toward achieving the research objectives, including to analyse the impact of the LBDC on increasing economic access in the CoJ, a quantitative research approach was applied by conducting a spatial analysis in which quantities - meters and the number of business, commercial, and industrial-zoned properties - were used to compare access to economic opportunities.
As such, distance and the number of economic opportunities were the main variables quantified in the spatial analysis to measure accessibility and serve as premise for the study's findings. The Rea Vaya BRT system is a significant and critical intervention in realising the accessibility benefits of TOD in the LBDC. Accordingly, the locations of Rea Vaya bus stations and other existing transportation services -minibus taxi ranks, Gautrain bus stops, and Metrobus bus stops - in the corridor were the starting points for measuring access in terms of distance to areas of economic opportunity. Access was measured according to the LBDC Strategic Area Framework's (SAF) services access standards of a successful TOD, which deems facilities and opportunities accessible if they are within 800m (0.8km) of the nearest public transport interchange (CoJ, 2012). The Network Analyst tool was used to calculate the 800m service areas of each Rea Vaya bus station, minibus taxi rank, Gautrain bus stop, and Metrobus bus stop in the corridor. This is because all economic opportunities in the service areas of each transportation facility in the corridor were deemed accessible. The Network Analyst tool was used to determine the number of economic opportunities that could be accessed within 800m of all nine Rea Vaya bus stations and all 11 other transportation facilities in the corridor, via accessible roads. The average number of economic opportunities accessible using the Rea Vaya BRT system was compared to the average number of economic opportunities accessible, using the other existing transportation services. The spatial analysis helped determine the extent to which the LBDC (through the Rea Vaya BRT system) improved access to economic opportunities.
To avoid redundancy in accessible opportunities and ensure more accurate results, the overlapping service areas for Rea Vaya bus stations (1 and 2, 3 and 4, 7 and 8) were examined in pairs. Due to their close proximity, these areas had overlapping coverage, so their service areas were merged.
Similarly, the 800m service areas of Taxi rank 4, Gautrain bus stops 2, 3, and 4, and Metrobus stop 3 overlapped at the southwestern-most point of the LBDC. This overlap meant that all three transport services provided access to some of the same economic opportunities. Consequently, the service areas of the overlapping stations were merged, and the total accessible economic opportunities were divided among the relevant transportation services.
5. FINDINGS
5.1 Rea Vaya bus stations
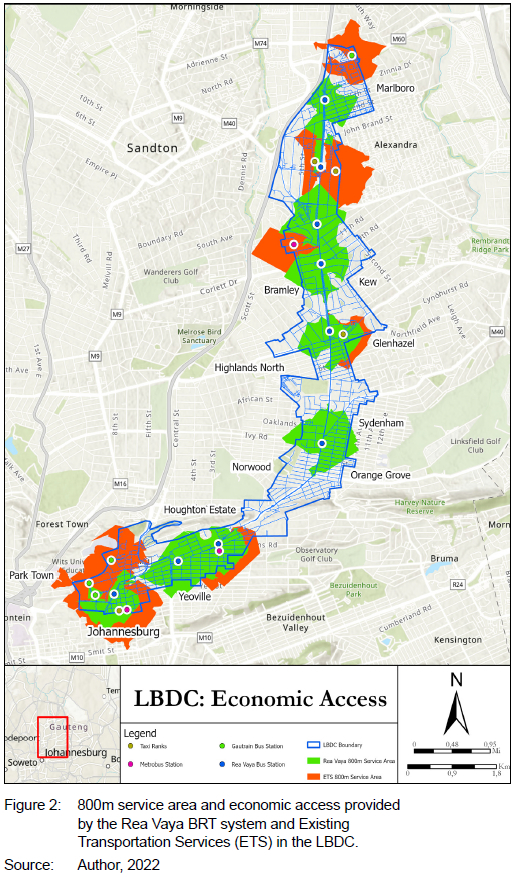
Table 2 provides details on the economic access provided by the Rea Vaya BRT system in the LBDC, with reference to the service areas of each bus station (see Figure 2), the number of accessible business, commercial, and industrial-zoned properties located within 800m of each Rea Vaya bus station, and the total number of economic opportunities accessible from each individual bus station and the BRT system as a whole.
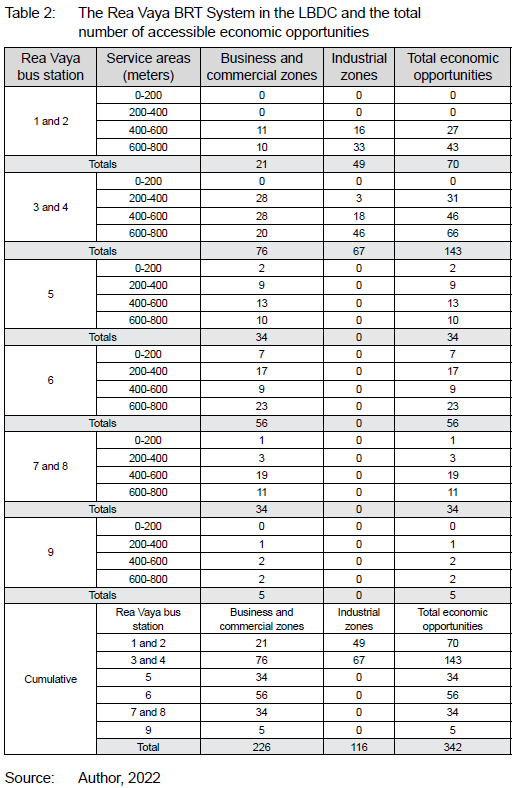
Since 455 business and commercial-zoned properties, and 270 industrial-zoned properties were identified in the LBDC, it was found that Rea Vaya bus stations 1 and 2 provide access to 70 economic opportunities, providing access to 5% of business and commercial-zoned properties, 18% of industrial-zoned properties, and 10% of all economic opportunities in the corridor.
Rea Vaya bus stations 3 and 4 provide access to 143 economic opportunities, accounting for 17% of business and commercial-zoned properties, 24% of industrial-zoned properties, and 20% of all economic opportunities in the corridor. Rea Vaya bus station 5 provides access to only business and commercial-zoned properties. Given that Highlands North is a non-industrial region catering mainly for residential properties, there are no industrial properties accessible within the 800m service area of bus station 5. As such, Rea Vaya bus station 5 provides access to 34 economic opportunities, accounting for 7% of business and commercial-zoned properties and 5% of all economic opportunities in the corridor.
Much like Rea Vaya bus station 5, there are no accessible industrial-zoned properties in the 800m service area of bus station 6. Located in Orange Grove, the region is mainly residential in nature. Therefore, Rea Vaya bus station 6 provides access to 56 economic opportunities, accounting for 12% of business and commercial-zoned properties and 8% of all economic opportunities in the corridor. Similarly, Rea Vaya bus stations 7 and 8 provide access to 34 economic opportunities, accounting for 7% of business and commercial-zoned properties and 5% of all economic opportunities in the LBDC. Lastly, Rea Vaya bus station 9 is located on the northern fringes of the CBD and thus provides access to zero industrial-zoned properties. The station does, however, provide access to five business and commercial-zoned properties, accounting for 1% of these properties and 0.7% of all economic opportunities in the LBDC. Ultimately, as noted in Table 2, the Rea Vaya BRT system provides access to 226 business and commercial-zoned properties, and 116 industrial-zoned properties. Therefore, the entire BRT system - through its 9 bus stations - provides access to 342 economic opportunities or 47% of economic opportunities in the LBDC.
5.2 Existing transportation services
Table 3 provides details on the economic access provided by the existing transportation services in the LBDC, with reference to the service areas of each transport facility (see Figure 2); the number of accessible business, commercial, and industrial-zoned properties located within 800m of each transport facility, and the total number of economic opportunities made accessible by each individual transport service provider and by all existing transportation services as a collective.
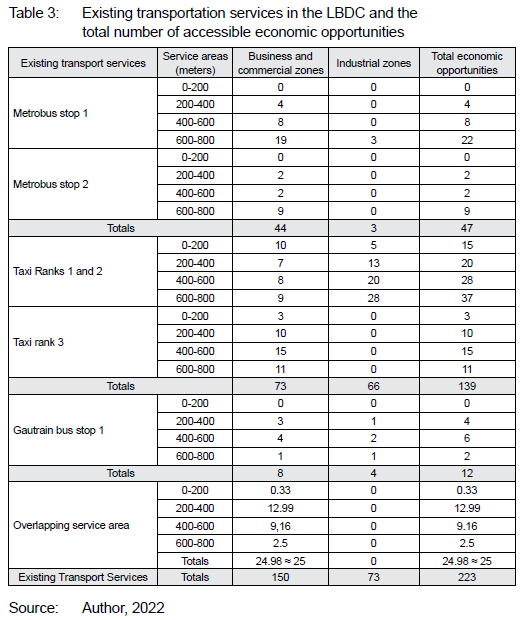
As per Table 3, the Metrobus service, through bus stops 1 and 2, provides access to 47 economic opportunities in the corridor, which accounts for 7% of business and commercial-zoned properties, 1% of industrial-zoned properties, and 6% of all identified economic opportunities in the LBDC. In addition, Metrobus bus stop 3 provides access to 4 economic opportunities which accounts for 1% of business and commercial-zoned properties and 0.5% of all identified economic opportunities in the corridor.
Taxi ranks 1 and 2 were examined together because of their close proximity to one another and the subsequent overlapping of their service areas. They were found to provide access to 100 economic opportunities, which accounts for 7% of business and commercial-zoned properties, 24% of industrial-zoned properties, and 14% of all identified economic opportunities in the LBDC. Taxi rank 3 provides access to 39 economic opportunities, which accounts for providing access to 9% of business and commercial-zoned properties, zero industrial-zoned properties, and 5% of all the identified economic opportunities in the LBDC. Taxi rank 4 provides access to 4 economic opportunities, which accounts for 1% of business and commercial-zoned properties, zero industrial-zoned properties, and 0.5% of the identified economic opportunities in the LBDC. Gautrain bus stop 1 provides access to 12 economic opportunities, which accounts for 2% of business and commercial-zoned properties, 1% of industrial-zoned properties, and 1.7% of all identified economic opportunities in the LBDC. Gautrain bus stops 2, 3 and 4 were examined together because of their close proximity to one another and the subsequent overlapping of their service areas. As such, Gautrain bus stations 2, 3 and 4 provide access to 24 economic opportunities, which accounts for 5% of business and commercial-zoned properties, zero industrial-zoned properties, and 3% of all identified economic opportunities in the LBDC. The existing transportation services (taxi ranks, Gautrain Bus, and the Metrobus) in the LBDC provide access to 150 business and commercial-zoned properties, accounting for 33% of all identified business and commercial facilities in the corridor. The existing transport services also provide access to 73 industrial-zoned properties in the corridor, accounting for 27% of all identified industrial facilities in the LBDC. In total, as per Table 3, access is provided to 223 economic opportunities in the LBDC, accounting for 31%.
Based on the findings of the spatial analysis, the Rea Vaya BRT system and its 9 bus stations located along Louis Botha Avenue provide access to 226 business and commercial-zoned properties. Since 455 business and commercial-zoned properties were identified in the LBDC, the Rea Vaya BRT system provides access to 49% of those properties. The existing transportation services in the corridor provide access to 150 business and commercial-zoned properties. These existing transportation facilities provide access to 33% of all the identified business and commercial-zoned properties in the LBDC. The introduction of the Rea Vaya BRT system has improved access in the LBDC, which is evident in the 16% increase in access to business and commercial-zoned properties in the corridor. While some Rea Vaya bus stations provide more access than others, the transport system as a whole increases access to economic opportunities. With regard to industrial-zoned properties, the Rea Vaya BRT system provides access to 116 of these properties in the corridor. Since 270 industrial-zoned properties were identified in the corridor, the Rea Vaya BRT system provides access to 43% of these properties. On the other hand, existing transportation services in the corridor provide access to 73 industrial properties, which accounts for 27% of all identified industrial-zoned properties in the corridor. These findings are illustrated in Figure 3.
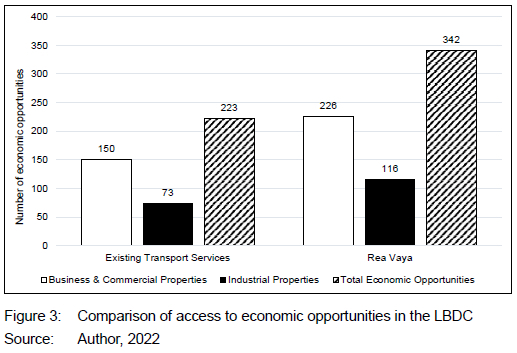
Having considered the extent to which the Rea Vaya BRT system has improved access to business and commercial-zoned properties and industrial-zoned properties, respectively, it is also necessary to determine the extent to which it improved access to economic opportunities overall. Of the 725 economic opportunities identified in the corridor, the Rea Vaya BRT system provides access to 342 (see Figure 3), providing access to 47% of all identified economic opportunities. Existing transportation services provide access to 223 economic opportunities, thus providing access to 31% of all identified economic opportunities.
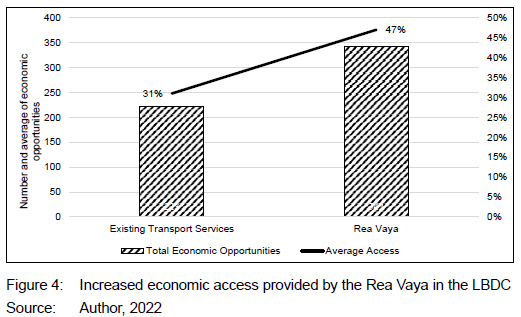
As per Figure 4, the introduction of the Rea Vaya BRT system increased access to economic opportunities by 16%. Much of this increase can be attributed to the fact that the Rea Vaya bus stations are located along Louis Botha Avenue, the spine of the development corridor around which economic facilities congregate and develop, while existing transport services and their associated bus stops and stations are located along through and local streets.
6. SYNTHESIS
6.1 The LBDC and access to economic opportunities
The spatial analysis found that the Rea Vaya BRT system provides access to 47% of all identified business, commercial-, and industrial-zoned properties in the corridor, while existing transportation services provide access to 31% of these properties. As such, the LBDC, through the Rea Vaya BRT system, increased access to economic opportunities by 16%. This illustrates the potential impact of the LBDC
and the strategic implementation of TOD and development corridors on increasing economic access in the CoJ. This finding is aligned with that of Mirzahossein et al. (2020) regarding Copenhagen's economic access improvements as a result of its TOD Finger Plan; Masingi (2019) on the CoF initiative and its accessibility benefits for the urban poor in Soweto, and that of Lionjanga and Venter (2017) regarding the positive impact of the CeF on imp roaed travel time. This is fsrther Unload to the potential broad er benefits of TOD and development corridors, including improved destination accessibility (Ogra & Ndebele, 2014); the creation of mixed-u se, high-density communities (Vale, 2015: 70); addressing spatial inequality and fragmentation (Boraine et al., 2006; Dewar, 2017), and fostering inclusivity, social cohesion, and mitigation of urban sprawl (Lang et al., 2020).
6.2 COJ strategic policy environment
Another research objective is to investigate the features of the policy environment central to the successtul implementation ef LBDC ond the broader CoF initiative in the CoJ. Toward achieving this objective, in line with Section 2.3, Table 4 elucidates the Corporation ofthe central implementation instruments - in the context of TOD and development corridors - in the CoJ strategic policy environment.
The incorporation of TOD in the CoJ policy environment is evident across multiple key instruments. The City's IDP, LUMS, SDF, SITPF, and GDS all acknowledge the significance of TOD and development corridors in realising an inclusive and accessible urban form. The policies bring to light numerous strategies such as promoting mixed-use and high-density developments to encourage and support TOD, as these regulations shape urban growth (Huang & Tang, 2012); prioritising TOD corridors and nodes; investing in mass public transportation systems to influence transport supply and demand and enhance economic access (Mouter & van Wee, 2021) and encouraging public-private partnerships for cost reliability, efficiency, and financial security benefits (Ndebele, 2018: 8). The policies also pay special attention to community engagement for higher quality TOD initiatives (Ballering 2022); affordable housing initiatives to address urban sprawl and enhance economic access (SAPOA, 2016: 12; Lang et al., 2020), and development incentives to attract investors (SAPOA, 2016: 25) and ensure accessibility and inclusivity in TODs.
6.3 Toward extracting TOD and development corridor potential
While there are notable efforts to incorporate TOD and development corridors in the CoJ, some strategic policies such as the GDS require further review and integration of TOD and development corridors goals and objectives, as successful implementation requires all relevant stakeholders to be involved in all phases of the project (SAPOA, 2016: 7). The implementation of TOD and development corridors ought to be included as a strategic priority in the policy, outlining how these instruments fit into broader urban development plans and how they align with other policy priorities. In addition, cross-departmental collaboration for policy development should also be adopted to ensure that the various stakeholders involved in urban development are aligned in their approach to TOD and development corridor implementation.
From a PPP perspective, the IDP needs to explore opportunities for public-private partnerships to finance, accelerate implementation, and operate transport infrastructure linked to TOD and development corridors. The COJ ought to conduct comprehensive feasibility studies to identify suitable infrastructure PPP projects and assess potential related risks. The COJ's IDP ought to stipulate the roles, responsibilities, and risk allocation between the public and private sectors to build investor confidence and ensure successful completion of projects. In addition, to integrate affordable housing in TOD nodes and corridors and ultimately ensure inclusivity for all residents (Coleman, 2018), the inclusionary housing policy also requires additional focus. Location-based criteria and transit accessibility targets to align the policies with TOD and development corridor goals for a more accessible and inclusive city ought to be established in affordable housing policies such as the inclusionary housing policy.
These policies should prioritise the development of inclusionary housing units in areas with good access to public transportation, setting targets for a percentage of inclusionary housing units to be located within a certain distance from transit stations within development corridors.
The SITPF needs to include strategies to create a multimodal transportation network that will ensure increased social inclusion and economic access in TOD nodes and corridors (Mouter & Van Wee, 2021). Transport policies such as the SITPF should include and emphasise multimodal transport as core strategy. To optimise the accessibility potential of public transportation services for successful implementation, policies ought to clearly state the significance of integrating the various modes of transport to create an efficient transport network. Long-term strategies should be put in place to develop a comprehensive multimodal transport network in TOD corridors to ensure seamless transfers between the different modes of transport in the city, in order to ultimately enhance access. The LUMS also requires additional focus to enable mixed-use and high-density developments in TOD nodes and corridors. Therefore, it is recommended that the CoJ develop and include transit-oriented design guidelines within the land-use scheme that promotes the principles of TOD and development corridors.
From a spatial policy perspective and in relation to other levels of planning, the LBDC SAF does not exist in isolation; it is rather regarded as an essential part within the broader package of plans and policies considered earlier. The SAF translates the intent of the CoJs GDS, IDP, SDF, Regional Development Framework, and informs the City's Precinct Plans. The framework's vision is premised on theories and best practices of TOD and development corridors, seeking to create urban spaces with a mix of high-density land uses within walkable precincts, anchored by transit facilities (CoJ, 2012: 13). However, the framework requires additional focus as no consideration is given to multimodal transport approaches to further enhance the accessibility impact of the Rea Vaya BRT and the supporting public transport systems in the corridor.
It is recommended that integrated transport system plans be considered with the development of transit corridors and incorporated into policy documents such as the LBDC SAF, to maximise access to economic opportunities. The Reya Vaya BRT system is the spine around which the LBDC has been developed with taxi ranks, the Metrobus, and the Gautrain Bus serving as supplementary transport services. Strategies should be put in place to develop integrated, user-oriented transport services. The TOD framework should make an integrated transport system a significant broad policy outcome and, therefore, provide guidance on linking the formal and informal transport services in the corridor to create an integrated multimodal transportation network. This will grant passengers access to at least two modes of transport to get to economic opportunities in the corridor perhaps beyond 800m. Providing a variety of transport modes will ensure that all users are accommodated and catered for based on their preferences and financial situation.
It must, however, be noted that, while the integration of transportation services is beneficial, duplication of such services (for instance, two transportation services running the same routes) must be avoided, in order to optimise resources. Integration that enables good use of resources could entail, for example, engaging with the east-west taxi route operators to align their stops with stops on the north-south BRT routes, enabling them to work together harmoniously and complement one another. Transport interchanges serve as places that attract and distribute trips, and integrate transport, allowing commuters to transfer between different modes of public transport. It is recommended that the CoJ work with relevant public transport providers to develop strategies in the SAF for the provision of more feasible infrastructure and service enhancements required to facilitate integrated transport systems such as transport interchanges/hubs. The framework should promote, encourage, support, and provide guidance on investment, planning, and location decisions of more transport interchanges that can accommodate the Rea Vaya buses, Metrobuses, Gautrain buses, and taxis. The SAF should include the results of a comprehensive assessment that clearly indicates the most suitable locations for transport interchanges (if any), in addition to the Watt Street Interchange. This assessment can include consideration of existing travel patterns of taxis, Metrobuses, and Gautrain buses, and where strategic networks coincide or overlap in the corridor. In addition, the SAF should clearly and in detail stipulate the positive outcomes of good modal interchanges. The direction provided in the framework should indicate that transport interchanges in the corridor could act as catalysts for surrounding development, enhance transportation choices and the range of destinations and, subsequently, improve access to opportunities.
7. CONCLUSIONS
The research aimed to determine the potential of the strategic implementation of TOD and development corridors in mitigating central spatial challenges in the South African urban milieu, with specific reference to economic access. The research sought to analyse the impact of the LBDC in this regard and investigate policy environment in the CoJ toward successful implementation. It was found that the LBDC has the potential to increase access to economic opportunities, while recommendations were delineated to amplify the potential inherent to the CoF. The latter focuses on increased cross-departmental collaboration, feasibility studies and risk allocation, location-based criteria and transit accessibility targets, transit-oriented design guidelines, and integrated transport systems as policy insights on TOD and development corridor implementation in the CoJ. This connects to existing research on these instruments as potential planning tools to guide urban growth and mitigate urban sprawl, and to create inclusive communities encompassing public transit systems with increased access to housing, economic opportunities, transportation, and other essential services for all residents. The findings and recommendations are applicable to the wider South African and developing country context, as they inform the benefits of dual TOD and development corridor implementation in potentially mitigating spatial challenges, and the policy interventions required to extract related benefits. This is a central contribution of the research. Limitations of this study include that, at the time of data collection, some properties in the corridor were undergoing rezoning. Therefore, while a property might be zoned as business, commercial, or industrial, secondary land-use rights permit other uses.
Secondly, this study examined the accessibility aspect of TOD. However, successful TOD is not limited to accessibility outcomes. The success of the LBDC can also be measured in terms of the extent of mixed-use development, high residential density, pedestrian orientation, connectivity, limited managed parking, and a topological road network.
Lastly, the Rea Vaya buses had also not been procured yet, thus the transport service was not operational at the time the research was conducted. The extent to which the LBDC enhances economic access and stimulates developmental processes and growth may be impacted once the BRT line is operational.
This research considered the contribution the LBDC has made to accessibility. The SAF does, however, highlight a great deal more than merely accessibility outcomes, since a TOD development corridor is also concerned with supporting land uses. Therefore, in addition to supporting improvements in accessibility, SAF has also supported changes in land use that will support any kind of mass transit network. As such, the value of the SAF with regard to changing the character and development trends of the LBDC is a future avenue of research.
In addition, the primary focus of the study is a proximity comparison between TOD, in this case the Rea Vaya BRT and other transit services, to improve economic access. In essence, the study is a geographical footprint comparison. However, the study could be extended by first, looking at the potential feet in volume each transport service in comparison brings and how that translates to economic opportunity, and secondly, what the socioeconomic profile for each transport service in comparison is and how that translates to economic opportunity.
REFERENCES
ADEBAYO, A. 2012. A tale of two African cities: Hyper growth, sprawl and compact city development. [Online]. Available at: <https://www.isocarp.net/data/case_studies/2172.pdf> [Accessed: 17 June 2022]. [ Links ]
BAJRACHARYA, B., KHAN, S. & LONGLAND, M. 2005. Regulatory and incentive mechanisms to implement transit-oriented development (TOD) in South East Queensland. [Online]. Available at: <https://espace.curtin.edu.au/bitstream/handle/20.500.11937/31664/164239_164239.pdf?sequence=2> [Accessed: 3 August 2023]. [ Links ]
BALLERING, P. 2022. Public participation definitely can add value to transit-oriented developments: A study of public participation within Dutch TOD practice. Unpublished Master's thesis, Radboud University, The Netherlands. [Online]. Available at: <https://theses.ubn.ru.nl/handle/123456789/13499> [Accessed: 4 August 2023]. [ Links ]
BERG, C.N., DEICHMANN, U., LIU, Y. & SELOD, H. 2017. Transport policies and development. The Journal of Development Studies, 53(4), pp. 465-480. https://doi.org/10.1080/00220388.2016.1199857 [ Links ]
BORAINE, A., CRANKSHAW, O., ENGELBRECHT, C., GOTZ, G., MBANGA, S., NARSOO, M. & PARNELL, S. 2006. The state of South African cities a decade after democracy. Urban Studies, 43(2), pp. 259-284. https://doi.org/10.1080/00420980500416990 [ Links ]
BORKOWITZ, T., DAHLIN, K., GASTALDI, G., GOODMAN, K., HARRISON, L., HOSSER-COX, S. et al. 2013. OMSI-Clinton: A corridor for invention and innovation. [Online]. Available at: <http://archives.pdx.edu/ds/psu/19587> [Accessed: 13 October 2023]. [ Links ]
BOWYER, D. 2015. Measuring urban growth, urban form and accessibility as indicators of urban sprawl in Hamilton, New Zealand. Lund: Lund University. [Online]. Available at: <https://core.ac.uk/download/pdf/289938022.pdf> [Accessed: 17 July 2022]. [ Links ]
BRAND, A. 2018. The use of corridor development as a strategic and supporting instrument towards the development of national space economies. Unpublished Phd thesis, North-West University, South Africa. [Online]. Available at: <http://hdl.handle.net/10394/28696> [Accessed: 15 June 2022]. [ Links ]
BRAND, A. & DREWES, E. 2020. Structuring South Africa's national economic space: A regional corridor network model approach. Town and Regional Planning, 77, pp. 120-136. https://doi.org/10.18820/2415-0495/trp77i1.9 [ Links ]
BRAND, A. & DREWES, J.E. 2021. Regional corridor model: Towards a regional corridor model. Environment and Planning B: Urban Analytics and City Science, 48(9), pp. 2691-2709. https://doi.org/10.1177/2399808320987844 [ Links ]
BRAND, A., GEYER, H.S. & GEYER, H.S. (jnr). 2017. Corridor development in Gauteng, South Africa. GeoJournal, 82, pp. 311-327. https://doi.org/10.1007/s10708-015-9683-x [ Links ]
BRUNNER, H. 2013. What is economic corridor development and what can it achieve in Asia's subregions? Asian Development Bank Economics Working Paper Series, 117. https://dx.doi.org/10.2139/ssrn.2306801 [ Links ]
CALTHORPE, P. 1997. The next American metropolis: Ecology, community, and the American dream. 3rd edition. Princeton, NJ: Princeton Architectural Press. [ Links ]
CARLTON, I. & FLEISSIG, W. 2014. Advancing equitable transit-oriented development: Steps to avoid stalled equitable TOD projects. New York: Living Cities. [Online]. Available at: <https://www.livingcities.org/resources/259-steps-to-avoid-stalledequitable-tod-projects> [Accessed: 23 July 2022]. [ Links ]
CARTWRIGHT, A. & MARRENGANE, N. 2016. Urban governance and turning African cities around. [Online]. Available at: <https://www.pasgr.org/wp-content/uploads/2016/11/Urban-Governance-and-Turning-African-Cities-Around_City-of-Johannesburg_.pdf> [Accessed: 23 July 2022]. [ Links ]
CERVERO, R. 2004. Transit-oriented development in the United States: Experiences, challenges, and prospects. Washington, DC: Transport Research Board. [ Links ]
COJ (CITY OF JOHANNESBURG). 2011. Joburg 2040 Growth and Development Strategy. [Online]. Available at: <https://www.joburg.org.za/about_/Documents/joburg2040.pdf> [Accessed: 3 August 2023]. [ Links ]
COJ (CITY OF JOHANNESBURG). 2012. Louis Botha Avenue Development Corridor Strategic Area Framwork. [Online]. Available at: <https://www.sajr.co.za/wp-content/uploads/attachments/louis-botha-final-sajr.pdf?sfvrsn=2> [Accessed: 21 June 2022]. [ Links ]
COJ (CITY OF JOHANNESBURG). 2013. Strategic Integrated Transport Plan Framework for the City of Johannesburg. [Online]. Available at: <https://www.joburg.org.za/Campaigns/Documents/2014%20Documents/CoJ%20SITPF.pd> [Accessed: 3 August 2023]. [ Links ]
COJ (CITY OF JOHANNESBURG). 2018. City of Johannesburg Land Use Scheme. [Online]. Available at: <https://www.joburg.org.za/documents_/Documents/City%20of%20Johannesburg%20Land%20Use%20Scheme%20-%20FINAL%202018.pdf> [Accessed: 2 August 2023]. [ Links ]
COJ (CITY OF JOHANNESBURG). 2019. Inclusionary housing incentives, regulations and mechanisms. [Online]. Available at: <https://housingflnanceafrica.org/app/uploads/City-of-Johannesburg-Inclusionary-Housing-2019.pdf> [Accessed: 3 August 2023]. [ Links ]
COJ (CITY OF JOHANNESBURG). 2021. Draft Spatial Development Framework 2040 (2021/2022 Update). [Online]. Available at: <https://www.joburg.org.za/Documents/2021%20Notices/December/Joburg%20SDF%202021%20Draft%20for%20Public%20Comment.pdf> [Accessed: 3 August 2023]. [ Links ]
COJ (CITY OF JOHANNESBURG). 2022. Draft Integrated Development Plan 2022/2027. [Online]. Available at: <https://www.joburg.org.za/documents_/Documents/2022-27%20Draft%20IDP/2022-27%20Draft%20Integrated%20Development%20Plan.pdf> [Accessed: 2 August 2023]. [ Links ]
COLEMAN, Z. 2018. Zoning for transit-oriented development. The Resource. [Online]. Available at: <https://www.orangecountygov.com/DocumentCenter/View/16099/Zoning-for-Transit-Oriented-Development-Edition-I-2018> [Accessed: 4 August 2023]. [ Links ]
DE SWARDT, C., PUOANE, T., CHOPRA, M. & DU TOIT, A. 2005. Urban poverty in Cape Town. Environment and Urbanisation, 17(2), pp. 101-111. https://doi.org/10.1177/095624780501700208 [ Links ]
DE VOS, J., VAN ACKER, V. & WITLOX, F. 2014. The influence of attitudes on transit-oriented development: An explorative analysis. Transport Policy, 35, pp. 326-329. https://doi.org/10.1016/j.tranpol.2014.04.004 [ Links ]
DEWAR, D. 2017. Transportation planning in South Africa: A failure to adjust. WIT Transactions on The Built Environment, 176, pp. 27-33. https://doi.org/10.2495/UT170031 [ Links ]
DEWEERDT, S. 2016. Mobility: The urban downshift. Nature, 531, article 7594, pp. S52-S53. https://doi.org/10.1038/531S52a [ Links ]
DIELEMAN, F. & WEGENER, M. 2004. Compact city and urban sprawl. Built Environment, 30(4), pp. 308-323. https://doi.org/10.2148/benv.30.4.308.57151 [ Links ]
DU, J. & GELMAN, V.L. 2018. Johannesburg fights inequality with transit-oriented development. [Online]. Available at: <https://www.wri.org/insights/johannesburg-fights-inequality-transit-oriented-development> [Accessed: 16 June 2022]. [ Links ]
EVANS, J. & PRATT, R.H. 2007. Transit Oriented Development. In: Transit Cooperative Research Program (TCRP) Report 95: Traveler Response to Transportation System Changes Handbook. 3rd edition. Washington, D.C.: Transport Research Board of the National Academies, pp. 1-126. [ Links ]
EWING, R.H. 2008. Characteristics, causes, and effects of sprawl: A literature review. In: Marzluff, J.M., et al. (Eds). Urban ecology. Boston, MA: Springer, pp. 519-535. https://doi.org/10.1007/978-0-387-73412-5_34 [ Links ]
FASTRACKS. 2008. Strategic plan for transit-oriented development, Regional Transportation District. [Online]. Available at: <https://www3.drcog.org/documents/archive/TODStrategicPlan_FINAL.pdf> [Accessed: 7 July 2022]. [ Links ]
FELIPE, J., KUMAR, U., ABDON, A. & BACATE, M. 2012. Product complexity and economic development. Structural Change and Economic Dynamics, 23(1), pp. 36-68. https://doi.org/10.1016/j.strueco.2011.08.003 [ Links ]
FRENKEL, A. & ASHKENAZI, M. 2008. Measuring urban sprawl: How can we deal with it? Environment and Planning B: Planning and Design, 35(1), pp. 56-79. https://doi.org/10.1068/b32155 [ Links ]
FURLAN, R., PETRUCCIOLI, A., MAJOR, M., ZAINA, S., ZAINA, S., AL SAEED, M & SALEH, D. 2019. The urban regeneration of west-bay, business district of Doha (State of Qatar): A transit-oriented development enhancing livability. Journal of Urban Management, 8(1), pp. 126-144. https://doi.org/10.1016/j.jum.2018.10.001 [ Links ]
GARCÍA, I. & CROOKSTON, J. 2019. Connectivity and usership of two types of multi-modal transportation network: A regional trail and a transit-oriented commercial corridor. Urban Science, 3(1), pp. 1-34. https://doi.org/10.3390/urbansci3010034 [ Links ]
GEYER, H.S. 1988. The terminology, definition and classification of development axes. Potchefstroom: North-West University. [ Links ]
GEYER, H. & DU PLESSIS, D. 2013. The reshaping of urban structure in South Africa through municipal capital investment: Evidence from three municipalities. Town and Regional Planning, 63, pp. 37-48. [ Links ]
GILOTH, R. 2019. The opportunity challenge: Jobs and economic development. In: Krumholz, N. (Ed.). Advancing equity planning now. Ithaca, NY: Cornell University Press, pp. 149-168. http://dx.doi.org/10.7591/9781501730399-010 [ Links ]
GOODWILL, J. & HENDRICKS, S.J. 2002. Building transit-oriented development in established communities. Tampa, FL: National Center for Transit Research, Center for Urban Transportation Research, University of South Florida. [ Links ]
HARRISON, P. & TODES, A. 1996. The development corridor route: New highways of old by-ways? Indicator South Africa, 13(3), pp. 70-75. [ Links ]
HARRISON, P., RUBIN, M., APPELBAUM, A. & DITTGEN, R. 2019. Corridors of freedom: Analyzing Johannesburg's ambitious inclusionary transit-oriented development. Journal of Planning Education and Research, 39(4), pp. 456-468. https://doi.org/10.1177/0739456X19870312 [ Links ]
HOFER, E., MUSAKWA, W., VAN LANEN, S., GUMBO, T., NETSCH, S. & GUGERELL, K. 2021. Inclusivity insights: Two urban development projects in Johannesburg. Journal of Housing and the Built Environment, 37, pp. 1853-1858. https://doi.org/10.1007/s10901-021-09916-y [ Links ]
HOPE, A. & COX, J. 2015. Development corridors. [Online]. Available at: <https://theasiadialogue.com/wp-content/uploads/2017/04/Topic_Guide_Development_Corridors.pdf> [Accessed: 10 October 2023]. [ Links ]
HUANG, H. & TANG, Y. 2012. Residential land use regulation and the US housing price cycle between 2000 and 2009. Journal of Urban Economics, 71(1), pp. 93-99. https://doi.org/10.1016/j.jue.2011.08.001 [ Links ]
IBRAEVA, A., DE ALMEIDA CORREIA, G.H., SILVA, C. & ANTUNES, A.P. 2020. Transit-oriented development: A review of research achievements and challenges. Transport Research Part A: Policy and Practice, 132, pp. 110-130. https://doi.org/10.1016/j.tra.2019.10.018 [ Links ]
JACKSON, R. & KOCHITZKY, C. 2009. Creating a healthy environment: The impact of the built environment on public health. Washington, DC: Center for Disease Control and Prevention. [ Links ]
JUFFE-BIGNOLI, D., BURGESS, N.D., HOBBS, J., SMITH, R.J., TAM, C., THORN, J.P. & BULL, J.W. 2021. Mitigating the impacts of development corridors on biodiversity: A global review. Frontiers in Ecology and Evolution, 9, article 683949. https://doi.org/10.3389/fevo.2021.683949 [ Links ]
LANG, W., HUI, E.C., CHEN, T. & LI, X. 2020. Understanding livable dense urban form for social activities in transit-oriented development through human-scale measurements. Habitat International, 104, article 102238. https://doi.org/10.1016/j.habitatint.2020.102238 [ Links ]
LINDSEY, D. 2004. Transit-oriented development: Planning for choice, health, prosperity and democracy. Planning Quarterly, December, p. 20. [ Links ]
LIONJANGA, N. & VENTER, C.J. 2017. Does public transport accessibility enhance subjective well-being? A study of the City of Johannesburg. Research in Transportation Economics, 69, pp. 523-535. https://doi.org/10.1016/j.retrec.2018.07.011 [ Links ]
MAHENDRA, A.& SETO, K.C. 2019. Upward and outward growth: Managing urban expansion for more equitable cities in the global south. Towards a more equal city. World Resources Institute, Washington DC. [ Links ]
MASINGI, C. 2019. Righting the wrongs of the past: Corridors of freedom as a pathway to inclusive development. Unpublished Masters thesis. The University of Cape Town, South Africa. [ Links ]
MIRZAHOSSEIN, H., RASSAFI, A.A., SADEGHI, K. & SAFARI, F. 2020. Overview of the literature on the transit-oriented development policy to investigate a practical solution for traffic congestion in Iran cities. International Journal of Transportation Engineering, 7(4), pp. 355-372. https://doi.org/10.22119/ijte.2020.201024.1495 [ Links ]
MOUTER, N. & VAN WEE, B. 2021. Evaluating transport equity. Advances in Transport Policy and Planning, 7, pp. 103-126. https://doi.org/10.1016/bs.atpp.2020.08.002 [ Links ]
MUSAKWA, W. & VAN NIEKERK, A. 2014. Monitoring urban sprawl and sustainable urban development using the Moran Index: A case study of Stellenbosch. South Africa. International Journal of Applied Geospatial Research, 5(3), pp. 1-20. https://doi.org/10.4018/ijagr.2014070101 [ Links ]
NDEBELE, R. 2018. Leveraging transit-driented Development (TOD) through public-private partnerships (PPPs): South Africa. In: Proceedings of the 7th International Conference on Industrial Engineering and Operations Management, 11-14 April, Rabat, Morocco, pp. 2662-2668. [ Links ]
NOICHAN, R. & DEWANCKER, B. 2018. Identifying the property and functions of corridor space in Bangkok's transit-oriented development area. [Online]. Available at: <https://rsucon.rsu.ac.th/flles/proceedings/inter2018/G3-IN18-055.pdf> [Accessed: 15 October 2023]. [ Links ]
NOLAND, R., OZBAY, K., DIPETRILLO, S., IYER, S. & CENTER, A. 2014. Measuring benefits of transit-oriented development. [Online]. Available at: <https://rosap.ntl.bts.gov/view/dot/28116/dot_28116_DS1.pdf> [Accessed: 2 May 2022]. [ Links ]
NYUNT, K. & WONGCHAVALIDKUL, N. 2020. Evaluation of relationships between ridership demand and transit-oriented development (TOD) indicators focused on land use density, diversity, and accessibility: A case study of existing metro stations in Bangkok. Urban Rail Transit, 6(1), pp. 56-70. https://doi.org/10.1007/s40864-019-00122-2 [ Links ]
OECD. 2018. Rethinking urban sprawl: Moving towards sustainble cities. Policy highlights. Paris: OECD Publishing. [Online]. Available at: <https://www.oecd.org/environment/tools-evaluation/Policy-Highlights-Rethinking-Urban-Sprawl.pdf> [Accessed: 23 July 2023]. [ Links ]
OGRA, A. & NDEBELE, R. 2014. The role of 6Ds: Density, diversity, design, destination, distance, and demand management in transit-oriented development (TOD). [Online]. Available at: <https://hdl.handle.net/10210/13157> [Accessed: 29 April 2022]. [ Links ]
OYALOWO, B. 2022. Implications of urban expansion: Land, planning and housing in Lagos. Buildings and Cities, 3(1), pp. 692-708. https://doi.org/10.5334/bc.243 [ Links ]
PAPA, E. & BERTOLINI, L. 2015. Accessibility and transit-oriented development in European metropolitan areas. Journal of Transport Geography, 47, pp.70-83. https://doi.org/10.1016/j.jtrangeo.2015.07.003 [ Links ]
PAPAGIANNAKIS, A. & YIANNAKOU, A. 2022. Do citizens understand the benefits of transit-oriented development? Exploring and modeling community perceptions of a metro line under construction in Thessaloniki, Greece. Sustainability, 14(12), p. 7043. https://doi.org/10.3390/su14127043 [ Links ]
PARLIAMENTARY LIAISON OFFICE. 2017. RDP housing: Success or failure? [Online]. Available at: <http://www.cplo.org.za/wp-content/uploads/2017/02/BP-432-RDP-Housing-May-2017.pdf> [Accessed: 15 June 2022]. [ Links ]
PLANACT. 2018. Planact's social facilitation role in the research project: Governing the future city - A comparative analysis of governance innovations in large-scale urban developments in Shanghai, London, and Johannesburg. Unpublished report, available from Mike@Planact.org.za. [ Links ]
REYES, S. & PEON, G. 2022. Reshaping Mexico's approach to housing and urban sprawl. [Online]. Available at: <https://www.itdp.org/wp-content/uploads/2022/12/Mexico_ST-Magazine-34.pdf> [Accessed: 2 February 2023]. [ Links ]
RISIMATI, B., GUMBO, T. & CHAKWIZIRA, J. 2021. Innovative initiatives usage to improve efficiency in the City of Johannesburg public transportation. [Online]. Available at: <https://hdl.handle.net/10210/488158> [Accessed: 5 May 2022]. [ Links ]
SAPOA (South African Property Owners Association. 2016. Developing a collective approach to mixed-use development in transit-oriented development precincts. [Online]. Available at: <https://www.sacities.net/wp-content/uploads/2020/02/TOD-Report-2016-web-version_compressed-1.pdf> [Accessed: 2 August 2023]. [ Links ]
SIMOES, V. 2014. An evaluation of the inclusion of principles of corridor development, transit-oriented development and non-motorised transportation within Johannesburg's corridors of freedom: The case of Turffontein Corridor. Unpublished Honours project. The University of the Witwatersrand, South Africa. [ Links ]
SINGH, Y., LUKMAN, A., FLACKE, J., ZUIDGEEST, M. & VAN MAARSEVEEN, M. 2017. Measuring TOD around transit nodes: Towards TOD policy. Transport Policy, 56, pp. 96-111. https://doi.org/10.1016/j.tranpol.2017.03.013 [ Links ]
SIVAKUMARAN, K., LI, Y., CASSIDY, M. & MADANAT, S. 2014. Access and the choice of transit technology. Transportation Research Part A: Policy and Practice, 59, pp. 204-221. https://doi.org/10.1016/j.tra.2013.09.006 [ Links ]
TOMLINSON, R. 2019. Urbanization in post-apartheid South Africa. London: Routledge. [ Links ]
TORRENS, P. & ALBERTI, M. 2000. Measuring sprawl. London: Centre for Advanced Spatial Analysis. [Online]. Available at: <http://www.casa.ucl.ac.uk/working_papers.htm> [Accessed: 4 February 2023]. [ Links ]
VALE, D. 2015. Transit-oriented development, integration of land use and transport, and pedestrian accessibility: Combining node-place model with pedestrian shed ratio to evaluate and classify station areas in Lisbon. Journal of Transport Geography, 45, pp. 70-80. 10.1016/j.jtrangeo.2015.04.009 [ Links ]
VAN NIEKERK, B. 2018. Housing as urbanism: A policy to discourage urban sprawl and provide well-loacted and affordable housing in South Africa. Town and Regional Planning, 73, pp. 68-82. http://dx.doi.org/10.18820/2415-0495/trp73.5 [ Links ]
VENTER, C. & CROSS, C. 2014. Access envelopes: A new accessibility mapping technique for transport and settlement planning. Journal of Town and Regional Planning, 64, pp. 43-52. [ Links ]
WANG, X., SHI, R. & ZHOU, Y. 2020. Dynamics of urban sprawl and sustainable development in China. Socio-Economic Planning Sciences, 70. https://doi.org/10.1016/j.seps.2019.100736 [ Links ]
WOOD, A. 2021. Problematising concepts of transit-oriented development in South African cities. Urban Studies, 59(12), pp. 2451-2467. https://doi.org/10.1177/00420980211033725 [ Links ]
WSP. 2020. Transit-oriented development: Framework for success. WSP. [Online]. Available at: <https://www.wsp.com/en-gl/insights/transit-oriented-development-framework-for-success> [Accessed: 4 August 2023]. [ Links ]
YEATES, M. 1984. The Windsor-Quebec city axis: Basic characteristics. Journal of Geography, 83(5), pp.240-249. https://doi.org/10.1080/00221348408980518 [ Links ]
YIRAN, G. et al. 2020. Urban sprawl in sub-Saharan Africa: A review of the literature in selected countries. Ghana Journal of Geography, 12(1), pp. 1-28. https://doi.org/10.4314/gjg.v12iL1 [ Links ]
YULIASTUTI, N., SUKMAWATI, A. & PURWONINGSIH, P. 2018. Utilization of social facilities to reinforce social interaction in formal housing. International Journal of Architectural Research, 12(1), pp. 134-151. http://dx.doi.org/10.26687/archnet-ijar.v12i1.1295 [ Links ]
YUSUF, M. & ALLOPI, D. 2010. The impact of urban sprawl on the inhabitants of Ethekwini Municipality and the provision of infrastructure. [Online]. Available at: <https://repository.up.ac.za/bitstream/handle/2263/14880/Yusuf_Impact(2010).pdf?sequence=1> [Accessed: 23 June 2022]. [ Links ]
ZHU, P., TAN, X., ZHAO, S., SHI, S. & WANG, M. 2022. Land-use regulations, transit investment, and commuting preferences. Land Use Policy, 122, pp. 1-17. https://doi.org/10.1016/j.landusepol.2022.106343 [ Links ]
Received: July 2023
Peer reviewed and revised: October 2023
Published: December 2023
* The author(s) declared no potential conflicts of interest with respect to the research, authorship, and/or publication of this article

