


Servicios Personalizados
Articulo
 Inglés (pdf)
 Articulo en XML
 Referencias del artículo
Indicadores

Links relacionados
-
 Citado por Google
 -
 Similares en Google
Compartir

 Permalink
Town and Regional Planning
versión On-line ISSN 2415-0495
versión impresa ISSN 1012-280X
Town reg. plan. (Online) vol.82 Bloemfontein 2023
http://dx.doi.org/10.18820/trp.v82i.5831
RESEARCH ARTICLE
Analysing the spatial pattern of road networks in Kimberley, South Africa
Ontleding van die ruimtelike patroon van padnetwerke in Kimberley, Suid-Afrika
Hlahlobo ea sebopeho sa marang-rang a litsela Kimberley, Afrika Boroa
Tabaro Kabanda
Lecturer, Department of Environmental Engineering and Management, University of Dodoma, Kikuyu Avenue, Dodoma, Tanzania. Phone: +255262310000, email: kabandatabaro@gmail.com, ORCID: https://orcid.org/0000-0002-4954-0089
ABSTRACT
The increasing burden on South African road networks necessitates sustainable solutions that conclude their spatial configuration and arrangement. A deeper understanding of the existing road network's spatial organisation is, therefore, required. This study evaluates the structural design of road networks in Kimberley, South Africa, using spatial network science and open-source OpenStreetMap data. Nonplanar-directed multigraphs for Kimberley are constructed to analyse the structural and morphological characteristics of the network. The study area was evaluated with several network-analysis methods such as completeness, degree of centrality, betweenness, closeness, and PageRank. The study found that Kimberley has a low degree of centrality of 0.00111. This indicates that the road network should be less congested because there are fewer vulnerable spots. Because of the availability of two-way streets, the total edge length in the Kimberley network is nearly double the total street length. There are 2.97 streets radiating from Kimberley nodes on average. This suggests that three-way intersections are prevalent in Kimberley. Centrality measures and analysing the effects in terms of accessibility to the commerce and services of the city show how the legacy of racial segregation, poverty, and isolation from social and economic opportunities impedes the places within Kimberley. Results from the study also indicate that the informal sections of Galeshewe are fine-grained in terms of road network, while Kimberley CBD and nearby districts have coarse grain roads. This pattern contributes to the relative overall low average street segment length (a proxy for block size) of 107 metres in Kimberley.
Keywords: Street networks, network science, OpenStreetMap, urban planning, transportation
OPSOMMING
Die toenemende las op Suid-Afrikaanse padnetwerke noodsaak volhoubare oplossings wat hul ruimtelike konfigurasie en rangskikking afsluit. 'n Dieper begrip van die bestaande padnetwerk se ruimtelike organisasie is dus nodig. Hierdie studie evalueer die strukturele ontwerp van padnetwerke in Kimberley, Suid-Afrika, deur gebruik te maak van ruimtelike netwerkwetenskap en oopbron OpenStreetMap-data. Nie-vlakgerigte multigrafieke vir Kimberley word gekonstrueer om die strukturele en morfologiese kenmerke van die netwerk te ontleed. Die studie-area is geëvalueer met verskeie netwerk-analise metodes soos volledigheid, graad van sentraliteit, tussenheid, nabyheid en PageRank. Die studie het bevind dat Kimberley 'n lae graad van sentraliteit van 0,00111 het. Dit dui daarop dat die padnetwerk minder oorlaai behoort te wees omdat daar minder kwesbare plekke is. As gevolg van die beskikbaarheid van tweerigtingstrate, is die totale randlengte in die Kimberley-netwerk byna dubbel die totale straatlengte. Daar is gemiddeld 2,97 strate wat uit Kimberley-nodusse straal. Dit dui daarop dat drierigting-kruisings algemeen in Kimberley voorkom. Sentraliteitsmaatreëls en die ontleding van die uitwerking in terme van toeganklikheid tot die handel en dienste van die stad wys hoe die nalatenskap van rassesegregasie, armoede en isolasie van sosiale en ekonomiese geleenthede die plekke binne Kimberley belemmer. Resultate van die studie dui ook daarop dat die informele gedeeltes van Galeshewe fynkorrelig is in terme van padnetwerk, terwyl Kimberley SSK en nabygeleë distrikte growwe graanpaaie het. Hierdie patroon dra by tot die relatiewe algehele lae gemiddelde straatsegmentlengte ('n volmag vir blokgrootte) van 107 meter in Kimberley.
KAKARETSO
Moroalo o ntseng o eketseha oa marang-rang a litsela tsa Afrika Boroa o hloka litharollo tse tsoarellang 'me tse phethelang tlhophiso ea libaka. Ka hona, ho hlokahala kutloisiso e tebileng ea marang-rang a teng a litsela. Phuputso ena e lekola moralo oa marang-rang a litselaa Kimberley, Afrika Boroa, ka ts'ebeliso ea mahlale a marang-rang a OpenStreetMap. Li 'nonplanar-directed multigraphs' tsa Kimberley li ile tsa etsoa ho hlahloba litsobotsi le sebopeho tsa marang-rang a tsela e hlahlobiloeng. Sebaka sa thuto se ile sa hlahlojoa ka mekhoa e 'maloa ea ho hlahloba marang-rang e kang botlalo, tekanyo ea bohareng, lipakeng, ho ba haufi, le PageRank. Phuputso e fumane hore Kimberley e na le tekanyo e tlaase ea bohareng ba 0.00111. Sena se bontsa hore marang-rang a litsela a lokela ho ba le tsubuhlellano e fokolang hobane ho na le libaka tse fokolang tse tlokotsing. Ka lebaka la boteng ba literata tse entsoeng ka litsela tse peli, bolelele bohle ba marang-rang a Kimberley bo batla bo imenne habeli ho bolelele ba literata kaofela.Ho na le literata tse 2.97 tse tsoang libakeng tsa Kim berley ka karolelano. Sena se fana ka maikutlo a hore makopano a litsela a linthla li tharo a atile Kimberley. Mehato ea mantlha le ho sekaseka litlamorao mabapi le phihlello ea khoebo le lits'ebeletso tsa toropo li bonts'a kamoo lefa la khethollo ea morabe, bofuma, le ho arola menyetla ea sechaba le moruo li sitisang libaka tse ka hare ho Kimberley. Liphetho tsa liphuputso li boetse li bonts'a hore likarolo tse sa reroang tsa Galeshewe li hantle ho latela marang-rang a litsela, athe Kimberley CBD le litereke tse haufi li na le litsela tse mahoashe. Mokhoa ona o kenya letsoho boleleleng ba kakaretso bo tlase ba karolo ea seterata ba limithara tse 107 Kimberley.
1. INTRODUCTION
Africa has the world's fastest urbanisation rate of 3.2% per year, well exceeding the global average of 2%, with currently 472 million Africans residing in cities and 810 million predicted by 2035 (Costaras, 2020: online). Governments could leverage secondary city growth to manage rapid urbanisation in primate cities. A city positioned somewhere in the centre of the national urban hierarchy and performing an auxiliary function in terms of functions is widely referred to as a secondary city (Mahutga et al., 2010: 1929). Scholars have increasingly emphasised small towns in South Africa over the past decade (Visser, 2013; Visser & Rogerson, 2014; Donaldson, Marais & Nel, 2017). These studies conclude that secondary cities play a vital role in the economy, as evidenced by the fact that, in recent years, population transfer to secondary cities has corresponded with job trends. Infrastructure supply in secondary cities has also been able to keep up with the population growth. In addition, secondary cities have a dual linking function, with connections forming between them and bigger metropolitan municipalities (and, in certain cases, worldwide economies) and connections forming between these secondary cities and their respective rural hinterlands. The predicted rise in secondary cities would put even more strain on road networks.
To address this issue, a deeper understanding of the existing road network's spatial organisation is required. The increasing burden on South African road networks (Brits, 2010: 41) necessitates sustainable solutions that conclude their spatial configuration and arrangement. However, there is hardly any to grey scholarly literature on the geographical layout of road networks in South African secondary cities. On Bird Street in Stellenbosch, South Africa, Snyman (2020) evaluated traffic operations to note the difference between real and intended road classification and access management and the influence on traffic characteristics. A static traffic model was created using PTV (Planung Transport Verkehr) microscopic traffic modelling software. Overall, the results show that the obsolete functional classification and access management cause the current traffic situation along Bird Street. Keetse (2016) studied traffic congestion in Kimberley, South Africa, using surveys, research methods, and related empirical models. The findings showed that some roads in the Kimberley central business district (CBD) region have significant traffic congestion during peak hours, necessitating strategic action. Using a spatial network technique, this study analyses Kimberley's road networks geometrically and topologically, with a focus on identifying their characteristic spatial configuration.
In cities, spatial networks such as streets structure and organise human spatial dynamics. They influence commutes, leisure travel, as well as household and business placement decisions in South Africa and elsewhere. Recent research was done to understand better the topology and geometry of urban street networks (Dumedah & Garsonu, 2020; Boeing, 2019). Street network analysis has been popular in recent urban planning and transportation research. However, current literature has some flaws such as small sample sizes (5-50 networks) in cross-sectional studies, which commonly claim generalisability to entire cities (Barrington-Leigh & Millard-Ball, 2019; Rychlewski, 2016). Secondly, studies commonly describe the street network as a planar or undirected primitive graph. Thirdly, determining geographical extents, topological simplification, correction, node, edge definitions, and so on are typically ad hoc or only partially provided, making repeatability difficult. The current tools and method landscape do not provide an optimal strategy for gathering, creating, and evaluating network data.
This study downloads OpenStreetMap's political boundary geometries and street network data and then uses the OSMnx tool developed by Boeing (2017) to construct, project, analyse, map, and visualise the road network to produce transportation metrics as well as network structure and topological complexity measures. It is widely acknowledged that most of the traffic congestion is alleviated by increasing the road network without respect for its spatial organisation (Dumedah & Garsonu, 2020). As a result, a fundamental link between road network spatial structure, traffic flow, and adaptability must be established in the face of disturbances. This includes the ability to absorb increasing traffic levels and identify and protect key or central road network sites and segments (Barthelemy, 2018). One can use computational network science to investigate the structure and resilience of road networks and the effect of location on network construction (Dumedah & Garsonu, 2020; Marshall et al., 2018). An analysis of the street network in Kimberley is carried out using a wide range of cutting-edge methods, technologies, and public data. Geometric and topological descriptions help policymakers comprehend road performance measures and identify vulnerable structural configurations by examining how locations inside the city are connected via transportation networks. In this study, the urban network viewpoint also enables the observation of spatial inequality in transportation linkages. The accessibility of a population to services and facilities is determined in part by the mobility of its transportation network.
2. LITERATURE REVIEW
2.1 Street network models
Graph theory, a subfield of discrete mathematics, is the bedrock of network research. Graphs represent a collection's elements and the links that connect them (Trudeau, 1994). 'Links' and 'edges' are terms used to describe the connections between the nodes and the vertices. Roads, trains, electricity grids, as well as water and sewage networks are examples of spatial networks with nodes and edges embedded in space (Barthélemy, 2011).
In its most basic form, a road network consists of links (or edges) connecting a collection of points known as nodes (Dumedah & Garsonu, 2020). The nodes represent road intersections and dead ends, while the road lengths that connect them are represented by the edges (Boeing, 2018: 11; O'Sullivan, 2014). While using the node and edge configuration to construct a road network, it is necessary to consider the inherent geometric and geographic restrictions of the network's topological aspects such as the location of nodes and the length of edges to construct a functional road network (Barthelemy, 2011). Numerous studies, including Sehra et al. (2019), Mohajeri and Gudmundsson (2014), as well as Brelsford, Martin and Bettencourt (2019), have shown that it is possible to gain valuable insight into the structure of road networks, by studying their topological and geometric properties, distribution, and arrangement characteristics. Nations or areas where these attributes have been extensively investigated often have data on road networks. Few studies have examined road network geometry and topology in locations such as South Africa, where geographic data can be scarce. This study employed a morphological analysis and global network relevance (Dumedah & Garsonu, 2020) to analyse the road network and spatial pattern in Kimberley, a secondary city in South Africa.
2.2 Street network data
Data on the world's street networks comes from several places, resulting in inconsistencies in the data's digitisation and storage in multiple file formats and metadata. The vast majority of street network studies still use shapefiles, which offer geometry but not adequate topology. It is important to note that street networks have two components, namely spatial geometry and topology (Barthelemy, 2011). For graph-theoretic network research, this means that geographic shapefiles alone are not suitable.
There are also online geographic information systems (GIS), from which data can be obtained. Although Google Maps may be beneficial for travel planning and related applications, it cannot be used for 'most research and analytic purposes' due to licensing conditions, costs, limitations on access, and usage restraints (Arsanjani et al., 2015). Data on the street network can also be found on OpenStreetMap (OSM). As a collaborative mapping effort that is open-source, international, and open-ended, street and intersection attributes such as road type, name, speed, width, and lane count can be found in OpenStreetMap, which gives geospatial information about streets and intersections. Graph-theoretic objects cannot automatically extract their data for network analysis as a default (Karduni, Kermanshah & Terrible, 2016: 3). The network architecture must also be cleaned up to depict nodes as junctions and dead ends accurately. OSMnx, a technology developed by Boeing (2017), enables the automatic, at-scale, and adjustable acquisition of OSM datasets and the generation of graph-theoretic data objects for analysis.
3. STUDY AREA
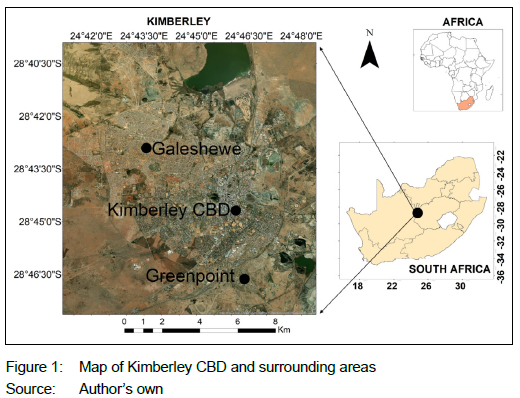
Located in a mining town, Kimberley's layout was built to maximize the productivity of the mining industry. As a result, the city and its people became increasingly split along racial lines. South Africa's apartheid-era spatial planning cemented the city's previously existing segregation by implementing the Group Areas Act. Galeshewe, in the city's northern and northern-western outskirts, was home to most of the city's Black population. Coloured residents were transferred to Greenpoint, while the White population remained in the city's CBD and surrounding suburbs (Sol Plaatje Municipality, 2017: 9).
Kimberley is the capital of South Africa's Northern Cape Province (Figure 1) and an important mining and commodity transportation centre connecting the northern and southern parts of the country. The city has a hierarchical arrangement of roadways. An artery (U3) and a small collector road (U4) are the two types of roadways (COTO, 2012; Keetse, 2016). Northbound N12 and Southbound N8 intersect in Kimberley City's core business centre; this intersection serves as a gateway to the city's eastern and western regions. Kimberley's southern suburbs, where car ownership is higher and the municipality's higher order road network is more accessible, have more private transportation usage. Many people utilize minibus taxis to go around town, mostly between the CBD and the neighbouring township (Galeshewe). However, many residents use private vehicles to travel between townships, not on these routes (Sol Plaatje Municipality, 2017: 50).
4. DATA AND METHODOLOGY
4.1 Data sources
OpenStreetMap (OSM) is a collaborative worldwide mapping effort that offers spatial data, usually in vector format and with high spatial resolution. It contains data such as buildings, land use, railroads, and roads (Boeing, 2018; OSM, 2015). OSM spatial dataset is particularly important in developing nations, where standardised geospatial data are scarce. However, extra processing of the road network data in OSM is required to guarantee proper extraction and ensuing data analysis.
4.2 Methodology
The data was downloaded and analysed using a python package OSMnx, created by Boeing (2017). Pre-processing processes include creating topology to identify road intersections and spatial linkages appropriately. These pre-processing steps were performed to prepare the data for spatial network analysis. After pre-processing, street network indicators are derived (detailed in section 4.2.1). Most of the network indicators are generated using the Python NetworkX module. The indicators' output is plotted using Matplotlib and described in the findings section.
4.2.1 Metrics for measuring the geographical connectivity of road data
The topology of spatial networks shows the spatial relationships between nodes in the network and the shape and structural arrangement of the node (Dumedah & Garsonu, 2020: 5). Topological measurements, as a result, evaluate the configuration, connectivity, and robustness of a network, as well as the distribution of these features in a network (Barthelemy, 2011: 8; Boeing, 2018: 9). A great deal of research by authors such as Dumedah & Garsonu (2020), Ingvardson & Nielsen (2018), Boeing (2018), and others studied topological measurements for road networks. Several basic topological measurements have been identified in the literature, including degrees, lengths, and densities of nodes and edges (Kang et al., 2019). Using the average node degree as an example the usual number of edges that pass through a node can be determined, indicating how connected a node is in the network (Boeing, 2017). Node with strong connectedness and more turn possibilities have higher average node degrees, whereas those with lower average node degrees have lower connectivity and fewer turn alternatives. Density metrics are frequently used to classify networks as fine or coarse, while intersection density is the number of junctions (nodes) per unit area (Dumedah & Garsonu, 2020: 5). Edge density is the ratio of total edge length to network area. High densities indicate a complex network, while low densities indicate a less complex network.
Circuity is calculated by dividing the shortest network distance by the Euclidean distance between one origin-destination pair (Barthelemy, 2011: 11; Huang & Levinson, 2015: 145). The average circuity ratio quantifies the relationship between the lengths of the edges and the great-circle distances between the nodes they connect, demonstrating the street pattern's efficiency (Boeing, 2018: 11).
Advanced topological measures include connectivity, centrality, and clustering. Network connection represents the minimal number of nodes or edges that will cause the network to disconnect if eliminated (Dumedah & Garsonu, 2020: 5). This indicator is more practical because it predicts the average number of nodes that must be removed, in order to disconnect a randomly selected pair of nonadjacent nodes from another (Marshall et al., 2018). High average node connectivity values indicate good connectivity, while low average node connectivity values indicate poor connectivity. Connection metrics include intersection density, the average distance between junctions, and characteristic path length. The typical path length is the average of the shortest paths between any two nodes in a network (Dumedah & Garsonu, 2020: 5; Sharifi, 2019: 13).
In a road network, centrality measures the importance of individual nodes or edges (Barthelemy, 2011: 8). The degree of centrality rises when connected to others (Sharifi, 2019). Centrality began as a way to describe the relationship between structural sociology and influence/power in small groups of individuals (Hacar, Kilic & Sahbaz, 2018: 4). For example, anyone in the community can play a significant part in his/ her social environment, making him/her more central compared to other members of the community (Hacar et al., 2018: 4). This is also true for road network. Because centrality directly affects road network operation, disruption to high centrality roads can cause considerable accessibility loss or network collapse. These are all markers of centrality or network efficiency. Closeness centrality measures how close one node is to all other reachable nodes (Crescenzi et al., 2016: 3). Node u closeness centrality is the reciprocal of the shortest path distances between n-1 (Freeman, 1979: 221). Because the total distances rely on the number of nodes in the graph, closeness is normalized by n-1.
d(v, u) is the shortest path between v and u, and n is the graph's number of nodes. Closeness centrality reduces the distance between nodes in a network. Degree centrality is impractical when a node's degree is confined by space (Boeng, 2018). Distance from a virtual straight path between two nodes is measured by straightness centrality (Dumedah & Garsonu, 2020: 6). Straightness centrality compares how efficient being direct is (Barthelemy, 2011: 11). Betweenness centrality is particularly crucial for calculating and visualizing network metrics (Derek, Ben & Marc, 2020), the visualizing of cybersecurity data in Leigh and William (2016), in marine connectivity studies using transfer probabilities (Costa et al., 2018). Betweenness centrality is the most widely used and practical measure of centrality for road networks, relating to network mobility and subregional connectivity (Huang et al., 2016: 163). Some nodes can strategically influence nonadjacent node motions. Betweenness centrality quantifies the number of shortest routes across a network node and emphasizes key locations that affect the road network's functionality (Boeing, 2018). Node betweenness centrality equation below is the fraction of all-pairs shortest routes passing through v:
where v is the set of nodes, σ(s, t) is the number of shortest (s, t) paths, and σ(s, t|v) is the number of those paths passing through some node v other than s, t. If s = t, o(s, t) = 1, and if v e s, t, σ(s, t|v) = 0 (Brandes, 2001: 3).
Clustering describes how closely a network is related to a given node (Dumedah & Garsonu, 2020: 6). A clustering coefficient measures the degree of local clustering in a road network. The clustering coefficient is calculated as the number of edges connecting it to its neighbours, divided by the maximum possible number of links (Boeing, 2018: 11). Clustering also measures a road network's connection by how well its neighbours are connected (Boeing, 2018: 12). Clustering equation is provided below:
where T(u) is the number of edges through node u and deg(u) is the degree of u (Saramaki et al., 2007:1).
A network with a clustering coefficient of 1.0 is perfectly clustered, whereas a network with a clustering coefficient of 0.0 is dispersed or poorly linked. Because nodes are more likely to be connected when close together, clustering may not be the best way to quantify a network's clustering coefficient in spatial networks (Barthelemy, 2018).
5. FINDINGS AND DISCUSSION
5.1 Urban road morphology
Figure 2 provides a basic overview of Kimberley's road network morphology. Street blocks in the lower half of Kimberley are shown to have a conventional grid pattern. The gridded structure of the road layout is made possible by Kimberley's relatively level geography. Gridded regions are generally associated with well-planned road layouts, but highly clustered gridded areas are associated with informal settlements. While the roads radiate out from the centre of Galishiwe, they are organized in a highly clustered grid layout. Due to this arrangement, Kimberley has an average street segment length of only 107 meters. Weighted average median street segment lengths in Eastern Asia (169 meters) and South-Central Asia (139 meters) are longer than in Northern Africa (50 meters) and Central America (63 meters) (Boeing, 2020: 12).
5.2 Geometric and topological network measures
OSMnx and NetworkX were used to evaluate data for Kimberley. The indicators discussed in the Methodology section were then derived. Table 1 presents the summary of those findings.
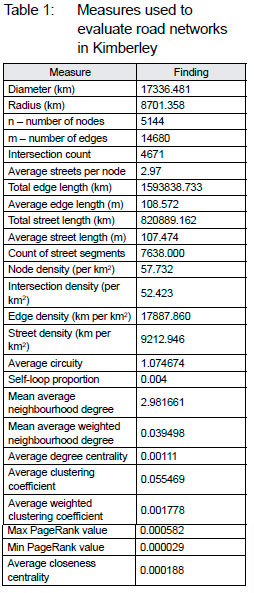
We can learn more about complexity, connectivity, and resiliency through the use of topological measurements. Because of the availability of two-way streets, the total edge length in the Kimberley network is nearly double the total street length. There are 2.97 streets radiating from Kimberley nodes on average. This suggests that three-way intersections are prevalent in Kimberley. Using the findings of the clustering coefficient, it is possible to determine how closely connected the node's immediate surroundings are. Kimberley's clustering coefficient is 0, indicating that it is a clustered road network. Clustering can indicate connectedness of a road network with the assumption that clustered nodes are more likely to be connected (Dumedah & Garsonu, 2020: 7). Accordingly, in Figure 2, on the north-western side of Galishiwe, there are several spots of node concentrations and a distinct agglomeration of streets. According to the average circuity, Kimberley has an efficient road network with an average circuity of 1.07. This indicates that the majority of the road routes are straight and more efficient or less circuitous. Kimberley is nearly topographically level; therefore, there are few physical obstacles to building straight roadways. In addition, the morphology of the road network in the study area has been determined to be grid-like, allowing for direct paths between locations. Transportation systems in cities with a low average circuity are typically more efficient (Giacomin & Levinson, 2015).
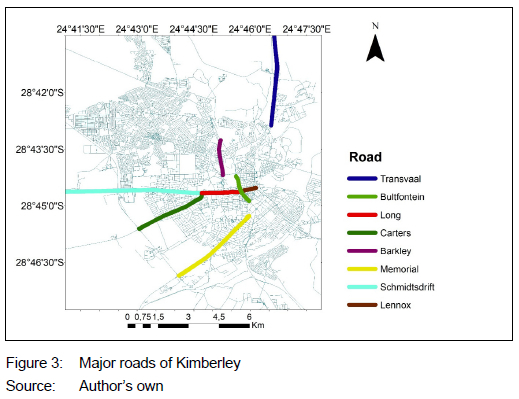
Based on page rank, additional information can be gained by analysing the road network's layout. Kimberley has a page rank of 0.000582. Road networks with low page ranks means that there are alternate nodes to employ in the event of congestion at one of the network's nodes. If a single node fails, it will not significantly impact the rest of the network; hence, page rank should be low and equally distributed. Long, Barkly, Bishop, Carters, and Schnidtsdrif are among the CBD's busiest thoroughfares, as illustrated in Figure 3. These streets in and around the CBD are clogged with traffic because of the combined flow of huge vehicles entering and exiting the city and regular inter- and intra-city traffic. Transvaal road (influenced by Pniel road) has a Level of Service (LOS) F (V/C=1.04) and is severely congested, while Long Street has LOS E (V/C=0.93), according to Keetse (2016: 113). A LOS F (Vp/C > 1.0) measures how congested a street or road is in relation to the average volume of traffic. According to the available statistics, all other routes have LOS A and are not extremely busy, even during peak traffic hours. From the passengers' perspective, the LOS evaluates how well a transportation system performs. LOS A represents optimal operating conditions, while LOS F represents the worst. An A to an F letter designation is used for each of the six service levels. Long Street (Vp/C =1.24) and Transvaal Road (Vp/C =1.39) both have a LOS F (Vp/C > 1.0) during peak hours and are extremely congested (Keetse, 2016: 113).
It was discovered that, by diverting at least 21% of traffic from Long Street and 27% of traffic from Transvaal Road to other roads, the LOS level for these two roads would change from F (peak) to E (normal) during peak hours and from E to C (normal) during normal hours, reducing severe traffic congestion (Keetse, 2016: 155). A 7 km/h improvement is expected on the Transvaal highway, and on Long Street, a 10 km/h improvement is possible. A 15% to 20% reduction in travel time is possible (Keetse, 2016: 155). Page rank values and clustering coefficient values indicate that alternative nodes in Kimberley can be used in case of congestion at other nodes. Traffic from busy roads might be redirected to less-travelled ones, improving service on most of the roadways in Kimberley's CBD.
5.3 Centrality of road networks
Because of the necessity of providing a practical understanding of how to characterize a road network, many studies (Zhang et al., 2011; Sohouenou, Neves & Christodoulou, 2021; Jayasinghe et al., 2019) have explored the centrality of road networks in greater depth. As a result, this study examined Kimberley's degree centrality results. According to the degree centrality finding, Kimberley has a low degree centrality of 0.00111. This shows that the road network should be less congested because there are fewer crucial spots.
Kimberley has an average closeness centrality of 0.000188. It is possible to have a closeness centrality between 0 (far) and 1 (close). The further apart from the rest of the network a node is, the less linked it is (i.e., there are many ways to get there.). Those nodes whose values are very close to one another are considered "close" (i.e., to travel from one node to other nodes in the network, only a few links must be travelled). Larger networks have lower centrality ratings since they have to traverse many links (Dumedah & Garsonu, 2020).
It is possible to visualize how 'important' a node or an edge is in the Kimberley network, as illustrated in Figure 4. The average shortest path between each node determines a network's centrality.
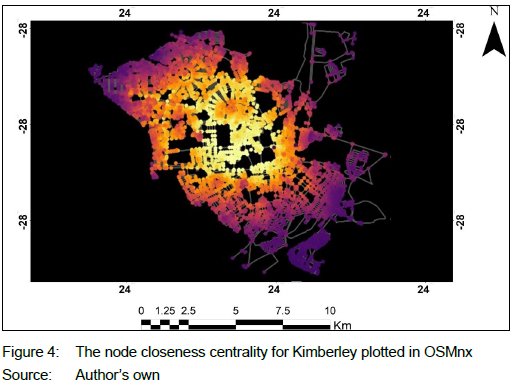
The nodes are coloured by their closeness centrality, from lowest in dark purple to highest in bright yellow. The bright yellow node situated at the centre has a high closeness centrality, which is defined as the inverse of the average path length of the shortest pathways (Ghanbari, Jalili & Yu, 2018: 2).
Streets are depicted as nodes in some street network research methodologies, while intersections are edges. This is called a line graph, or sometimes a dual graph, and it essentially inverts the topology of the street network noted above. The line graph can also be viewed in OSMnx. First, the Networkx is used to convert the street network into its line graph. Then the closeness centrality is calculated again, and then the edges of the street network are coloured, as shown in Figure 5.
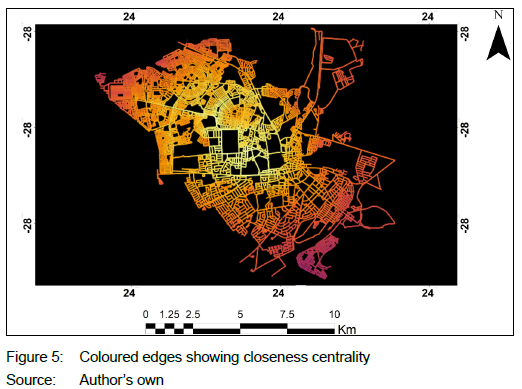
The edges are now coloured by their centrality, from lowest in dark purple to highest in bright yellow. The edges are now shaded from dark purple at the lowest to bright yellow at the highest, based on their importance to the overall design. Kimberley's closeness centrality map shows how the legacy of racial segregation, poverty, and isolation from social and economic opportunities impedes the places within it. Decades of apartheid settlement planning, including forced removals and the consolidation of homelands as well as the development of non-White dormitory-style residential areas on the outskirts of cities placed the non-White population further from economic activities than their White counterparts (Joscelyne, 2015). According to Figures 6 and 7, economically deprived areas are found closer to the bright yellow zone. However, the most highly important facilities are not located inside the bright yellow zone of spatial location. The current administration has continued this contentious planning trend by placing RDP homes on the edges of communities (informal settlements). Those who do not own a car or are unable to drive are trapped in a poverty trap because of the segregation of neighbourhoods (Savill et al., 2003: 150). This results in limited access to opportunities for those who lack transportation.
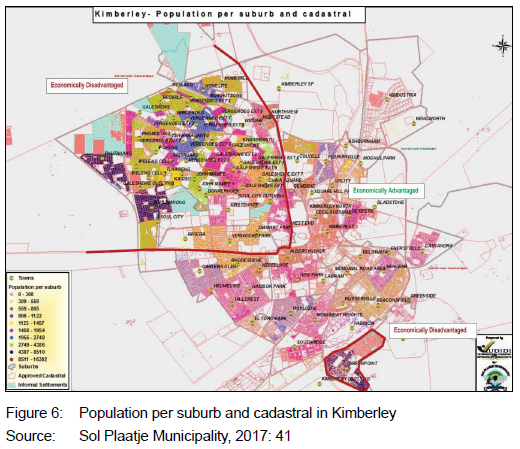
The red and blue dots in Figure 6 signify higher population concentrations, whereas the grey dots represent lower concentrations. Those areas with a higher concentration of people have more than 1,000 persons per square kilometre (Sol Plaatje Municipality, 2017: 41). Kimberley's west side has a higher concentration of working-class residents than the remainder of the city, while the southeast portion of the municipality has another heavily populated district, Greenpoint (Kabanda, 2022). Many highly inhabited areas are made up of informal settlements, which lack resources and are, consequently, cut off from the mainstream economy. Kimberley's enormous spatial differences provide significant city planning and social cohesion challenges. People's struggles with inequality are exacerbated by long commutes and a scarcity of easily available resources.
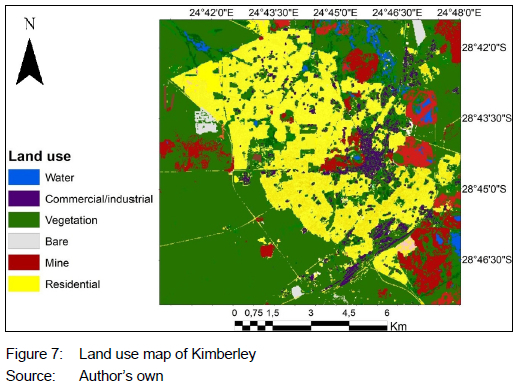
Kimberley's land use is depicted in Figure 7 which shows that a large portion of built space is classified as residential. Most of these are detached houses, demonstrating that the municipality's citizens are housed in properly zoned areas. Along with residential, there are commercial, industrial, recreational, and public use areas. Galeshewe is home to the majority of Sol Plaatje's population. Figure 5 shows that Galeshewe's economically poor region is separated from the commercial and industrial zones, preventing inhabitants from accessing economic opportunities. Due to its remote position and lack of transportation to the city centre, the township suffers from spatial exclusion. Poor land-use management has resulted in Galeshewe's disintegration from the city's economic heart. Galeshewe should be designated as an urban node for development to make up for the past and revitalize the township. Large-scale capital investment projects should be launched in the area to help and support local entrepreneurs.
5.4 Betweenness centrality
Betweenness centrality is an efficient way to organize network flows, that is, moving around or along the road network. By balancing space and topology, the pattern of betweenness centrality for spatial networks captures significant characteristics of the network's structure. Betweenness centrality for Kimberley is 0.21005 and the node with the highest betweenness centrality has 31% of all shortest paths running through it. Betweenness centrality incorporates the intermediary function of roads in a network, i.e., their capacity to govern interconnections.
Roughly 31% of all shortest paths run through the node highlighted in red (Figure 8). It is also possible to examine the relative betweenness centrality of every node in the graph.
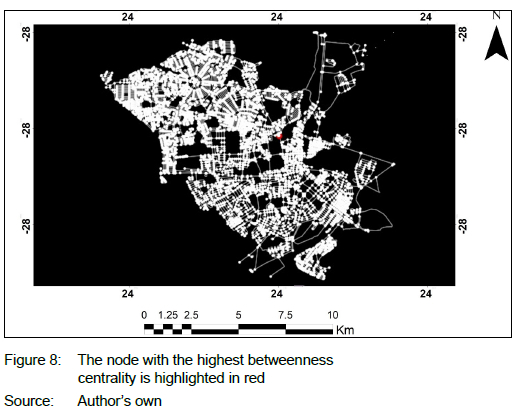
Figure 9 shows the nodes in Kimberley as visualized by betweenness centrality, from low (dark violet) to high (light yellow). The concept of betweenness centrality shows the essential road segments that are usually longer, centrally located, and connect distant areas of the road network. The Kimberley network has several low-betweenness centrality road segments, which are perfect for facilitating mobility in the event of its most vital node failing (e.g., due to a traffic jam or flood).
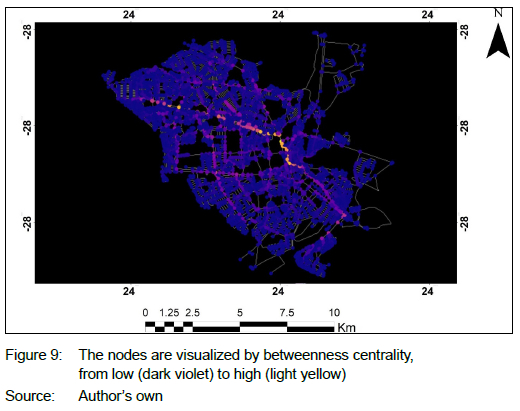
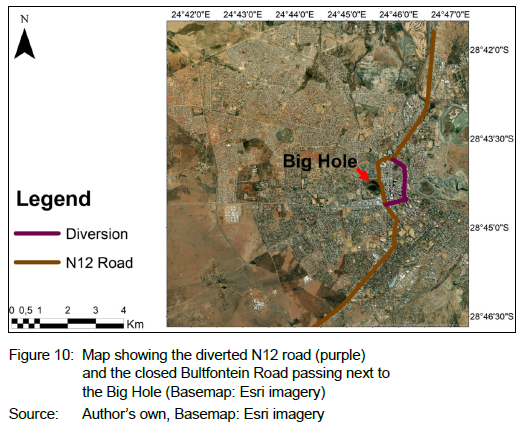
The results of the betweenness centrality measurements show a few intriguing facts about Kimberley's road network, as many economic activities are not found near the highest betweenness values. The reason for this is that the part of the road network with the highest betweenness centrality (Bultfontein road), as shown in Figure 8, should have been closed many years ago, but it has never materialized. A few weeks after the signs and curbs were installed, public members broke open the curbs and removed the road traffic signs, and many taxis and commuters used the road. Bultfontein Road near the Big Hole has been technically shut down as a precautionary measure because of the potential of collapse and instability as its sides slowly erode (News24, 2008). As a result, heavy vehicles bringing mined materials from within and around the city, freight vehicles en route to areas outside the city, and cars arriving from Johannesburg have been forced to use the CBD's arterial routes. An N12 road reroutes from the Bultfontein Road, as illustrated in Figure 10. Many cars also come from the north-western sector of Kimberley Township (Galeshewe) and vehicles come from Johannesburg through the N12. All of these must pass through the CBD. Traffic jams, slowed traffic, and longer travel times are repercussions of this (especially during peak hours) (Keetse, 2016). Table 1 shows that the road network in Kimberley is efficient and that there are numerous alternative nodes to employ in case of congestion at other nodes, allowing for efficient traffic flow in the CBD.
6. CONCLUSION
The road network was evaluated using a variety of geometric and topological measures, each of which provided unique descriptions of the network. The informal sections of Galeshewe are fine-grained, while the Kimberley CBD and nearby districts have coarse grain roads. Furthermore, the network's betweenness centrality was mapped out on individual road segments. Network elements are ranked according to their betweenness centrality, which measures how many origin-to-destination points are connected by a particular route segment. Technically, the major road in Kimberley that relies on high values of 'betweenness centrality' is closed. There has been a considerable increase in the municipality's need for road network maintenance, due to the N8 and N12 heavy vehicle traffic being diverted onto the municipality's lower order roads because of the closure of Bultfontein Road. It is clear from the deterioration of roads and intersections that the roads and intersections currently being used by these heavy vehicles were never designed for such heavyweights or type of vehicles. With an emphasis on urban roads in the secondary city of Kimberley, this research adds to the growing body of knowledge about the structure of road networks. Further critical studies are needed to better reflect these regions in the literature. Road network geometry and topology must be considered in transportation planning and policy to meet the demand of the rising number of people on road networks and greater demand for mobility. Geometric and topological descriptions set the groundwork for future road network layouts and planning strategies. Ultimately, this study's findings and conclusions are influenced by the method employed to describe road networks and the model of analysis. Models for the study included a basic morphological examination and an examination of the significance of network nodes. In other words, this study's outcomes and findings are only applicable if they fit inside this paradigm of representation and analysis. The OSMnx tool has a general limitation in that it relies on OpenStreetMap data. While the street network coverage in affluent countries is excellent, it is less complete in developing countries, but it is still adequate, particularly in cities.
Future research should investigate the difference in network complexity between driving networks, walking networks, and bikeable networks at different spatial scales. This may also assist in highlighting differences in network resilience and connection between walking and driving. This study contributes to the literature on street network organisation in regions with less developed geospatial technology. Transport planning and policy must encompass major geometric and topological characteristics of road networks, in order to accommodate the growing population pressure on road networks and the increased demand for mobility.
REFERENCES
ARSANJANI, J., ZIPF, A., MOONEY, P. & HELBICH, M. (Eds). 2015. OpenStreetMap in GIScience; Lecture notes in Geoinformation and Cartography. Cham, Switzerland: Springer. [ Links ]
BARRINGTON-LEIGH, C. & MILLARD-BALL, A. 2019. A global assessment of street-network sprawl. PLoS ONE. 14. e0223078. 10.1371/journal. pone.0223078. [ Links ]
BARTHELEMY, M. 2011. Spatial networks. Physics Reports-review. Section of Physics Letters, 499 (1-3), pp. 1-101. https://doi.org/10.1016/j.physrep.2010.11.002 [ Links ]
BARTHELEMY, M. 2018. Morphogenesis of spatial networks. Lecture notes in Morphogenesis. https://doi.org/10.1007/978-3-319-20565-6 [ Links ]
BOEING, G. 2017. OSMnx: New methods for acquiring, constructing, analyzing, and visualizing complex street networks. Computers, Environment and Urban Systems, 65, pp. 126-139. https://doi.org/10.1016/j.compenvurbsys.2017.05.004 [ Links ]
BOEING, G. 2018. Measuring the complexity of urban form and design. Urban Design International, 23, pp. 1-22. https://doi.org/10.1057/s41289-018-0072-1 [ Links ]
BOEING, G. 2019. The morphology and circuity of walkable and drivable street networks. In: D'Acci, L. (Ed.). The mathematics of urban morphology. Basel, Switzerland, pp. 271-287. https://doi.org/10.31235/osf.io/edj2s [ Links ]
BOEING, G. 2020. Street network models and indicators for every urban area in the world. Geographical Analysis, 54(3), pp. 519-235. https://doi.org/10.1111/gean.12281 [ Links ]
BRANDES, U. 2001. A faster algorithm for betweenness centrality. Journal of Mathematical Sociology, 25(2), pp. 163-177. https://doi.org/10.1080/0022250X.2001.9990249 [ Links ]
BRELSFORD, C., MARTIN, T. & BETTENCOURT, M. 2019. Optimal reblocking as a practical tool for neighbourhood development. Environment and Planning. Urban Analytics and City Science, 46(2), pp. 303-321. https://doi.org/10.1177/2399808317712715 [ Links ]
BRITS, A. 2010. The financial burden of National Road Infrastructure and the equity thereof: A South African perspective. Journal of Transport and Supply Chain Management, 4(1), pp. 39-56. https://doi.org/10.4102/jtscm.v4i1.10 [ Links ]
COTO. 2012. South African Road Classification and Access Management Manual. TRH, 26. Pretoria: The South African National Roads Agency. [ Links ]
COSTA, A., PETRENKO, A., GUIZIEN, K. & DOGLIOLI, A. 2018. On the calculation of betweenness centrality in marine connectivity studies using transfer probabilities. Public Library of Science ONE, 12(12), article number e0189021. doi: 10.1371/journal.pone.0189021 [ Links ]
COSTARAS, T. 2020. Urbanisation in Africa: Creating greater access to customers. [Online]. Available at: <https://www.frost.com/frost-perspectives/urbanization-in-africa-where-do-the-opportunities-lie/> [Accessed: 25 January 2022]. [ Links ]
CRESCENZI, P., D'ANGELO, G., SEVERINI, L. & VELAJ, Y. 2016. Greedily improving our own closeness centrality in a network. ACM Transactions on Knowledge Discovery from Data, 11(1), article number 9, pp. 1-32. DOI: 10.1145/2953882 [ Links ]
DEREK, L.H., BEN, S. & MARC, A. 2020. Chapter 6 - Calculating and visualizing network metrics. In: Derek, H., Ben, S., Marc, S. & Itai, H. (Eds). Analyzing social media networks with NodeXL, 2nd edition. London, UK: Elsevier, pp. 79-94. https://doi.org/10.1016/B978-0-12-817756-3.00006-6 [ Links ]
DONALDSON, R., MARAIS, L. & NEL, E. 2020. Secondary cities in South Africa. In: Massey, R. & Gunter, A. (Eds). Urban geography in South Africa: Perspectives and theory. Cham, Switzerland: Springer, pp. 118-134. https://doi.org/10.1007/978-3-030-25369-1_8 [ Links ]
DUMEDAH, G. & GARSONU, E. 2020. Characterising the structural pattern of urban road networks in Ghana using geometric and topological measures. Geography and Environment, 8(1), article number e00095. DOI: 10.1002/geo2.95 [ Links ]
FREEMAN, L. 1979. Centrality in networks: I. Conceptual clarification. Social Networks, 1, pp. 215-239. https://doi.org/10.1016/0378-8733(78)90021-7 [ Links ]
GHANBARI, R., JALILI, M. & YU, X. 2018. Correlation of cascade failures and centrality measures in complex networks. Future Generation Computer Systems, 83, pp. 390-400. https://doi.org/10.1016/j.future.2017.09.007 [ Links ]
GIACOMIN, D.J. & LEVINSON, D.M. 2015. Road network circuity in metropolitan areas. Environment and Planning B: Planning and Design, 42, pp. 1040-1053. https://doi.org/10.1068/b130131p [ Links ]
HACAR, M., KILIC, B. & SAHBAZ, K. 2018. Analyzing OpenStreetMap road data and characterizing the behaviour of contributors in Ankara, Turkey. International Journal of Geo-Information, 7(10), pp. 400. https://doi.org/10.3390/ijgi7100400 [ Links ]
HUANG, J. & LEVINSON, D.M. 2015. Circuity in urban transit networks. Journal of Transport Geography, 48, pp.145-153. https://doi.org/10.1016/j.jtrangeo.2015.09.004 [ Links ]
HUANG, X., ZHAO, Y., MA, C., YANG, J., YE, X. & ZHANG, C. 2016. TrajGraph: A graph-based visual analytics approach to studying urban network centralities using taxi trajectory data. Transactions on Visualization and Computer Graphics, 22(1), pp. 160-169. https://doi.org/10.1109/TVCG.2015.2467771 [ Links ]
INGVARDSON, J.B. & NIELSEN, O.A. 2018. How urban density, network topology and socio-economy influence public transport ridership: Empirical evidence from 48 European metropolitan areas. Journal of Transport Geography, 72, pp. 50-63. https://doi.org/10.1016/j.jtrangeo.2018.07.002 [ Links ]
JAYASINGHE, A., TENZIN, N., ABENAYAKE, C. & MAHANAMA, P. 2019. Simulation of population growth and distribution based on centrality of road network. International Journal of Innovative Technology and Exploring Engineering, 8(10S), pp. 389-393. 10.35940/ijitee.J1072.08810S19. [ Links ]
JOSCELYNE, K. 2015. The nature, scope and purpose of spatial planning in South Africa: Towards a more coherent legal framework under SPLUMA. Unpublished M-dissertation. University of Cape Town. http://hdl.handle.net/11427/19785 [ Links ]
KABANDA, T.H. 2022. Using land cover, population, and night light data to assess urban expansion in Kimberley, South Africa. South African Geographical Journal, pp. 1-14. 10.1080/03736245.2022.2028667 [ Links ]
KANG, W., OSHAN, T., WOLF, L.J., BOEING, G., FRIAS-MARTINEZ, V., GAO, S., POORTHUIS, A. & XU, W. 2019. A roundtable discussion: Defining urban data science. Environment and Planning B: Urban Analytics and City Science, 46(9), pp. 1756-1768. DOI:10.1177/2399808319882826 [ Links ]
KARDUNI, A., KERMANSHAH, A. & DERRIBLE, S. 2016. A protocol to convert spatial polyline data to network formats and applications to world urban road networks. Scientific Data, 3, Article number: 160046. https://doi.org/10.1038/sdata.2016.46 [ Links ]
KEETSE, M. 2016. Re-engineering of traffic systems in the central business district of a South African city: The case of Kimberley City. Unpublished M.Tech dissertation. Central University of Technology, Bloemfontein, Free State. [ Links ]
LEIGH, M. & WILLIAM, C. 2016. Chapter 7 - Visualizing cybersecurity data. In: Leigh Metcalf, L. & Casey, W. (Eds). Cybersecurity and applied mathematics. Oxford, U.K: Syngress, pp.113-134. https://doi.org/10.1016/B978-0-12-804452-0.00007-5 [ Links ]
MAHUTGA, M.C., XIULIAN, M., DAVID, A.S. & TIMBERLAKE, M. 2010. Economic globalisation and the structure of the world city system: The case of airline passenger data. Urban Studies, 47(9), pp. 1925-1947. https://doi.org/10.1177/0042098010372684 [ Links ]
MARSHALL, S., GIL, J., KROPF, K., TOMKO, M. & FIGUEIREDO, L. 2018. Street network studies: From networks to models and their representations. Networks and Spatial Economics, 18, pp. 735-749. https://doi.org/10.1007/s11067-018-9427-9 [ Links ]
MOHAJERI, N. & GUDMUNDSSON, A. 2014. The evolution and complexity of urban street networks. Geographical Analysis, 46, pp. 345-367. https://doi.org/10.1111/gean.12061 [ Links ]
NEWS24. 2008. Big Hole 'might swallow road'. [Online]. Available at: <https://www.news24.com/news24/big-hole-might-swallow-road-20080204> [Accessed: 25 January 2022]. [ Links ]
OSM (OpenStreetMap). 2015. Getting started on OpenStreetMap.org. [Online]. Available at: <https://learnosm.org/en/beginner/start-osm/> [Accessed: 19 May 2022]. [ Links ]
O'SULLIVAN, D. 2014. Spatial network analysis. In: Fischer, M.M. & Nijkamp, P. (Eds). Handbook of regional science. Berlin, Germany: Springer, pp. 1253-1273. https://doi.org/10.1007/978-3-642-23430-9_67 [ Links ]
RYCHLEWSKI, J. 2016. Street network design for a sustainable mobility system. Transportation Research Procedia, 14, pp. 528-537. 10.1016/j.trpro.2016.05.108. [ Links ]
SARAMAKI, J., KIVELÄ, J., ONNELA, J., KASKI, K. & KERTÉSZ, J. 2007. Generalizations of the clustering coefficient to weighted complex networks. Physical Review E, 75(2), pp. 1-4. 10.1103/PhysRevE.75.027105 [ Links ]
SAVILL, S., STONE, J., VENTER, C. & MAUNDER, D. 2003. Improving access to transport in developing countries. [Online]. Available at: <http://www.transport-links.org/transport_links/filearea/documentstore/307_ICE_Doc.pdf> [Accessed: 19 May 2022]. [ Links ]
SEHRA, S.S., SINGH, J., RAI, H.S. & ANAND, S.S. 2019. Extending processing toolbox for assessing the logical consistency of OpenStreetMap data. Transactions in GIS, 24(1), pp. 44-71. https://doi.org/10.1111/tgis.12587 [ Links ]
SHARIFI, A. 2019. Resilient urban forms: A review of literature on streets and street networks. Building and Environment, 147, pp.171-187. https://doi.org/10.1016/j.buildenv.2018.09.040 [ Links ]
SNYMAN, J. 2020. Establishing and applying road classification and access management techniques on Bird Street in Stellenbosch, South Africa. [Online]. Available at: <https://scholar.sun.ac.za/handle/10019.1/107831> [Accessed: 19 May 2022]. [ Links ]
SOHOUENOU, P., NEVES, L. & CHRISTODOULOU, A. 2021. The criticality of high betweenness links in road networks. In: Remenyte-Prescott, R. & Kopustinskas, V. Modelling the resilience of infrastructure networks. An ESReDA Project Group Report, Det Norske Veritas, Hovik, Norway, pp. 183-195. Chapter: Transport Networks. [ Links ]
SOL PLAATJE MUNICIPALITY 2017. Sol Plaatje Municipality: Integrated Development Plan - IDP (2017-2022). [Online]. Available at: <http://www.solplaatje.org.za/CityManagement/Reporting/IDP/IDP%202017-2022.pdf> [Accessed: 25 January 2022]. [ Links ]
TRUDEAU, R.J. 1994. Introduction to graph theory. 2nd edition. New York: Dover Publications. [ Links ]
VISSER, G. 2013. Looking beyond the urban poor in South Africa: The new terra incognita for urban geography? Canadian Journal of African Studies, 47(1), pp.75-93. https://doi.org/10.1080/00083968.2013.770593 [ Links ]
VISSER, G. & ROGERSON, C.M. 2014. Reflections on 25 years of Urban Forum. Urban Forum, 25, pp. 1-11. https://doi.org/10.1007/s12132-014-9227-3 [ Links ]
ZHANG, Y., WANG, X., ZENG, P. & CHEN, X. 2011. Centrality characteristics of road network patterns of traffic analysis zones. Transportation Research Record. Journal of the Transportation Research Board, 2256(1), pp.16-24. 10.3141/2256-03. [ Links ]
Received: December 2021
Peer reviewed and revised: January 2022
Published: June 2023
* The author(s) declared no potential conflicts of interest with respect to the research, authorship, and/or publication of this article

