


Servicios Personalizados
Articulo
 Inglés (pdf)
 Articulo en XML
 Referencias del artículo
Indicadores

Links relacionados
-
 Citado por Google
 -
 Similares en Google
Compartir

 Permalink
Town and Regional Planning
versión On-line ISSN 2415-0495
versión impresa ISSN 1012-280X
Town reg. plan. (Online) vol.82 Bloemfontein 2023
http://dx.doi.org/10.18820/trp.v82i.6610
RESEARCH ARTICLE
Conformity to zoned urban green spaces in physical development plans: A spatiotemporal analysis of Kisii Town, Kenya
Ooreenstemming met gesoneerde stedelike groen ruimtes in fisiese ontwikkelingsplanne: 'n tydruimtelike analise van Kisii Town, Kenia
Kananelo ea libaka tsa thloleho litoropong mererong ea ntlafatso: tlhahlobo ea sebaka Sa Toropo ea Kisii, Kenya
Wilfred Omollo
Department of Geography, Kisii University, Kenya. Phone: 254728104220, email: wochieng@kisiiuniversity.ac.ke, ORCID: https://orcid.org/0000-0001-8994-5120
ABSTRACT
Although evidence assessing the provision of urban green spaces (UGS) corroborates their decline, they have, however, not evaluated conformity to zoned UGS in physical development plans (PDPs). To fill the gap, this article examines conformity to zoned UGS in PDPs. It also investigates the drivers of the observed non-conformities. Anchored in the theory of regulatory compliance, the study was undertaken in Kisii Town, Kenya, as a case study of the zoned UGS in the Kisii Town Physical Development Plan (KTPDP). The population comprised a list of 367 developers occupying the zoned UGS, out of which a sample of 186 was randomly selected. Spatial and descriptive data were respectively collected using satellite images and questionnaires. The analysis relied on GIS, descriptive and inferential statistics. Results showed that 75 hectares (ha) of zoned UGS declined by 52% between 2005 and 2022, resulting in a low per capita UGS of 1.95 m2 against the recommended 9 m2. These changes were caused by developing without permits, the County Government of Kisii (CGOK) granting permits to non-applicants, as well as approving developments without the mandatory change or extension of use, insufficient monitoring of developments, laxity in enforcing zoning regulations, and uncertainty in the engagement of registered architects during the development control process. Recommendations are made for a revised physical development plan covering the entire town to provide adequate UGS, ensuring that building plans are submitted by authorised professionals and regular surveillance audits to deter unauthorised developments. The article concludes that, in the absence of effective development control, UGS in Kisii Town will further decline, resulting in the residents not enjoying their acknowledged benefits.
Keywords: Development control, Kisii Town, Kenya, regulation compliance, physical development plan, urban green space, zoning
OPSOMMING
Alhoewel 'n bewyse wat die voorsiening van stedelike groen ruimtes (SGR) beoordeel, hul agteruitgang staaf, het hulle egter nie ooreenstemming met gesoneer SGR in fisiese ontwikkelingsplanne (FOP's) geëvalueer nie. Om die gaping te vul, ondersoek hierdie artikel ooreenstemming met gesoneer SGR in FOP's. Dit ondersoek ook die drywers van die waargenome nie-konformiteite.
Geanker in die teorie van regulatoriese voldoening, is die studie in Kisii Town, Kenia, onderneem as 'n gevallestudie van die gesoneer SGR in die Kisii Town Physical Development Plan (KTPDP). Die populasie het bestaan uit 'n lys van 367 ontwikkelaars wat die gesoneer SGR beset, waaruit 'n steekproef van 186 lukraak gekies is. Ruimtelike en beskrywende data is onderskeidelik ingesamel met behulp van satellietbeelde en vraelyste. Die ontleding het op GIS, beskrywende en afleidingsstatistieke staatgemaak. Resultate het getoon dat 75 hektaar (ha) gesoneerde SGR tussen 2005 en 2022 met 52% afgeneem het, wat gelei het tot 'n lae per capita UGS van 1,95 m2 teenoor die aanbevole 9 m2. Hierdie veranderinge is veroorsaak deur ontwikkeling sonder permitte, die distriksregering van Kisii (CGOK) wat permitte aan nie-aansoekers toestaan, sowel as die goedkeuring van ontwikkelings sonder die verpligte verandering of uitbreiding van gebruik, onvoldoende monitering van ontwikkelings, laksheid in die toepassing van soneringsregulasies, en onsekerheid in die betrokkenheid van geregistreerde argitekte tydens die ontwikkelingsbeheerproses.
Aanbevelings word gemaak vir 'n hersiene fisiese ontwikkelingsplan wat die hele dorp dek om voldoende SGR te voorsien, om te verseker dat bouplanne deur gemagtigde professionele persone ingedien word en gereelde toesigoudits om ongemagtigde ontwikkelings af te weer. Die artikel kom tot die gevolgtrekking dat, in die afwesigheid van effektiewe ontwikkelingsbeheer, SGR in Kisii Town verder sal afneem, wat daartoe lei dat die inwoners nie hul erkende voordele geniet nie.
KAKARETSO
Le hoja bopaki bo lekanyang phano ea libaka tsa tlholeho tsa litoropo (UGS) bo tiisa ho theoha ha boleng ba tsona, ha ho so be le tekolo ea kananelo ea li-UGS tse kahar'a merero ea ntlafatso (PDPs). Ho tlatsa lekhalo lena, sengoloa sena se hlahloba kananelo ea UGS e kenyelelitsoeng ka hara PDPs. E boetse e batlisisa se bakang ho se ananele kenyeletso ena. Ka ho ikamahanya le khopolo-taba ea kananelo ea taolo, boithuto bo entsoe Kisii Town, Kenya, e le mohlala oa UGS ka tlasa Kisii Town Physical Development Plan (KTPDP). Thuto-patlisiso e entsoe ka sampole ea bahlahisi ba 186 ba khethiloeng ka hara kakaretso ea ba 367 ba fumanoeng ka hara UGS. Lintlha tse bonts'ang le ho hlalosa sebaka sa boithuto li ile tsa bokelloa ka ho latellana ho sebelisoa litsoantso tsa sathelaete le lethathamo la lipotso. Tlhahlobo e ne e itsetlehile ka GIS le lipalo-palo tse hlalosang liphetho. Liphetho li bonts'itse hore boleng ba lihekthere tse 75 (ha) tsa UGS bo theohile ka 52% lipakeng tsa 2005 le 2022, e leng se entseng hore motho ka mong a be le UGS e tlase ea 1.95 m2 khahlanong le 9 m2 e khothaletsoang. Liphetoho tsena li bakiloe ke ho etsa ntlafatso ntle le tumello ea semolao, 'Muso oa Setereke oa Kisii (CGOK) o fana ka litumello ho batho bao e seng bakopi, hammoho le ho amohela lintlafatso ntle le phetoho e tlamang kapa ho atolosoa ha ts'ebeliso, ho se be le tlhokomelo e lekaneng ea nts'etsopele, ho se phethahatse melaoana ea ntlafatso ea libaka, le ho hloka bonnete ba ho kenya letsoho ha litsebi tsa meralo tse ngolisitsoeng nakong ea ts'ebetso ea taolo ea nts'etsopele. Litlhahiso li etsoa bakeng sa moralo o fetotsoeng oa ntlafatso o akaretsang toropo eohle ho fana ka li-UGS tse lekaneng, ho netefatsa hore meralo ea meaho e romelloa ke litsebi tse lumelletsoeng le tlhahlobo ea khafetsa ea ho thibela nts'etsopele e sa lumelloeng. Sengoliloeng se phethela ka hore, ha ho se na taolo e sebetsang ea nts'etsopele, UGS Toropong ea Kisii e tla fokotseha le ho feta, e leng se tla etsa hore baahi ba se ke ba thabela melemo ea bona e ananeloang.
1. INTRODUCTION
Globally, urban planners have been eager to incorporate urban green spaces (UGS) as a solution towards dealing with the pressure of a growing population, due to rapid urbanisation (Okech & Nyadera, 2022). The challenges facing UGS sustainability could, however, prevent them from providing essential ecosystem services to urban dwellers (Mwangi, 2019: 1). A closer examination of Kenya reveals that Eldoret municipality had a 26% UGS coverage rate, resulting in a per-person area of 2.5 m2, which was less than the 9 m2 recommended by the World Health Organization (WHO) (Goro & Mwasi, 2017: 12). In Kisumu city, Owino, Hayombe & Agong' (2017: 10) showed that the areas covered by UGS declined by 19.9% between 2005 and 2014, leading to a decrease in carbon sink and an increase in carbon footprint, thus affecting ecotourism owing to low environmental quality. In Nairobi, the capital city, Makworo and Mireri (2011: 1108) found that public UGS were prone to congestion and deterioration because of the city's rapid urbanisation, poor management, and illegal alienation of public land. These problems continue, even though the 1948 master plan recommended adequate UGS in residential neighbourhoods.
The situation is not different in Kisii Town, where the zoned UGS in the approved 1972 Kisii Town Physical Development Plan (KTPDP) has progressively witnessed a decline, due to insufficient development control by the County Government of Kisii (CGOK). However, numerous initiatives to review the plan have been made, including recommendations to give adequate UGS. The first attempt was made in 2009, when the defunct Kisii Municipal Council (KMC) and UN-Habitat drafted the Kisii Strategic Urban Development Plan (KSUDP), which covered the twenty years from 2009 to 2029 (UN-Habitat, 2019: 4). Despite the effort, the plan failed in providing a solution that could address the problem of UGS and development control. It was also not implemented. The second attempt was made in 2013, as part of the first Kisii County Integrated Development Plan (KCIDP) (2013-2017), when an Integrated Strategic Urban Development Plan (ISUDP), with zoning districts that included UGS, was prepared (CGOK, 2013: 2010). However, hardly any attention was paid to the ISUDP, as it was relegated as an annexure to the KCIDP. For this reason, it was not implemented.
With this background, despite its flaws, the 1972 KTPDP has continued to be the only legal document used by the CGOK to carry out development control. The plan is, therefore, used in ensuring that zoned UGS are conserved. Using a conformance-based method, this article determines whether the resulting land-use development patterns were aligned to the zoned UGS provided in the KTPDP. From a broader physical planning perspective, it is projected that an upsurge in the town's population is bound to hasten land-use change. If this occurs with no comprehensive physical planning and development control, nonconformity to the zoned UGS is bound to escalate at the expense of sustainable development. In the context of this article, the concept 'PDP' is operationalised to mean a policy document prepared by a planning authority to provide the legal basis for promoting an orderly spatial location of different competing land uses (The Republic of Kenya, 2007: 43).
Although the CGOK has a PDP with zoned UGS, no prior attempts have been made to empirically evaluate whether they are sustainably conserved. The problem continues notwithstanding section 53(f) of the Physical and Land Use Planning Act (PLUPA), 2019, which grants the CGOK the powers to maintain the land planned for UGS as per the approved PDP. In addition, there is a dearth of empirical evidence regarding the causes of their loss. Furthermore, the vast majority of studies only focus on the general and naturally occurring UGS that are not given legal status in the approved PDP through zoning. The current study fills this gap, by evaluating the extent to which the use of legally zoned UGS in PDPs is being regulated and adhered to through the use of zoning as a physical planning and development control instrument. This is necessary because UGS are important for sustainable urbanism. It was undertaken in Kisii Town, Kenya, between January 2022 and May 2022, as a case study with an in-depth spatiotemporal conformity analysis of the zoned UGS in the 1972 KTPDP. It also investigated the drivers of nonconformity to the zoned UGS in this PDP. The espoused research strategy that involved spatiotemporal analysis may benefit professional physical planners, policymakers, and the broader international academic community on how conformity to zoned UGS in PDPs may be appraised.
2. LITERATURE REVIEW
To understand conformity to zoned UGS in physical development plans, it is important to introduce the concepts and theoretical framework used in this article. These include physical planning, zoning, and the concept of UGS. The article further explores the previous attempts toward determining the extent of conformity to zoned UGS in PDPs through the application of geospatial approaches.
2.1 Physical planning and zoning
In its broadest definition, physical planning refers to a collection of policies intended to enhance the spatial, social, and economic welfare of a location and its inhabitants (Owei, Obina & Precious, 2010: 1-2). It entails planning that makes certain that people can profit from the highest level of resource efficiency, the functionality of places, and visual quality (Olujimi, 1993: 115-116). Therefore, achieving social and economic development in a way that is systematic, coordinated, efficient, and environmentally sound is the overall objective of physical planning (The Republic of Uganda, 2011: 2). The primary concerns are the orderliness and aesthetics of space, the effectiveness of operations in the social, economic, and other spheres, and most importantly, the well-being of urban residents (Aribigbola, 2008: 1-2). Therefore, physical planning administration is viewed as a branch of public policy encompassing various disciplines that aim to regulate land use ethically and effectively, thereby preventing land-use conflict (Owolabi, 2019: 1). It consists of a series of procedures for deciding which options to consider and choosing future courses of action that are in the interests of the public (Ekong, 2021: 1). As a result, physical planning is primarily a state function. Its goal is to influence how human activities are organised spatially and, in doing so, protect the environment from demands that may come from various competing groups. In addition, it coordinates sectors whose land-use policies may have an impact on the environment (Yoshida et al., 2020: 200; Omollo, 2022: 187). Accordingly, physical planning is, therefore, an essential service that all responsible governments ought to provide to their citizens (Olujimi, 1993: 115). The insight makes it clear that the main goal of physical planning is to achieve sustainable land-use development.
To ensure that PDPs are implemented, the vast majority of countries have legislated zoning, that is, the division of an urban area into distinct districts and subsequent prescription and enforcement in each district of a set of regulations (Omollo, 2018: 332; Fischel, 2000: 403). This guarantees adherence to the suggested standards for planning, a tactic for encouraging certainty and predictability in physical planning (Otubu, 2012: 36). Zoning also outlines the objectives of physical development planning, which focuses on promoting an orderly spatial development, therefore, eliminating possible conflicts between incompatible land uses (Rothwell & Massey, 2009: 780), as well as preserving and providing for UGS amenities (The Republic of Kenya, 2007: 76). The idea behind this argument is that specific areas should be designated for urban functions, in order to increase efficiency and reduce externalities brought on by incompatible land uses. For this reason, it is also applied to deter new developments from intruding into the present land use, thus preserving the character of the existing neighbourhoods (Serkin, 2020: 749). The output of zoning is a zoning plan that indicates how the land-use categories in the proposed PDP are relating to the districts on the zoning map. A typical zoning plan has two parts: a map and a text. While the map shows how an urban area has been partitioned into different districts, a text describes the zoning rules that apply to each district (Brown, Sanders & Reed, 2018: 64). Zoning districts may include administrative, residential, commercial, industrial, transportation, educational, public green spaces, and agricultural uses (Omollo, 2018: 335). The current study, however, only focuses on UGS that were purposefully zoned out in the approved PDP.
2.2 The concept of UGS
The term 'UGS' lacks a common conceptual definition (WHO, 2016: 3). Scholars and practitioners are, therefore, restricted to definitions that address their research interests. For instance, natural and semi-natural areas that provide ecosystem services in urban areas (Odindi & Mhangara, 2012: 653); green spaces such as farmland, forest and grassland in built-up areas (Xu et al., 2011: 13); areas identified as golf courses, roof gardens, urban agriculture, vegetated wasteland, or where trees are growing (WHO, 2016: 2), as well as vegetation, parks, sporting fields, playgrounds, riparian areas, nature trails, and trees planted along the streets (Yiyi et al., 2021: 391; Hernandez, Karina & Patricia, 2018: 24; Lil & Pussella, 2017: 11; Jim & Chen, 2003: 1; Sudipto, Jason & Catherine, 2012: 352; Qureshi, Syed & Breuste, 2010: 32). Arabi, Hatami and Jadidoleslami (2014: 56) thus proposed four classes of UGS: public green spaces/ parks; semi-public green spaces such as those in hospitals; private green spaces found in residential areas, and street green spaces along roads. In this article, 'UGS' is operationalised to mean a green space zoned in a PDP for the development and maintenance of parks, riparian reserves, stadiums, and golf courses as public spaces. The scope also covers urban agriculture, which the KTPDP considered compatible with UGS.
Some of the benefits they offer to urban residents include reducing the effects of urban heat islands; mitigating global warming and soil erosion (Yulin et al., 2022: 1; Xiao et al., 2018: 428; Kaplan, 2018: 105), and regulating urban microclimate through the cooling effect (Yan, Jia & Zhao 2021: 2; Grilo et al., 2020: 1). Further, given that present-day urbanism is linked to trauma, deficient physical exercise, and exposure to human-caused environmental calamities, UGS can promote physical health (Callaghan et al., 2020: 179; Southon et al., 2018: 2), and are therefore considered to be the "lungs of the city" (Julfikar, Mohidur & Iqbal, 2022: 1). They can also reduce morbidity and mortality, by limiting exposure to extreme heat, noise, and air pollutants (Kiplagat et al., 2022: 9; Krzyzaniak et al., 2015: 65; Schipperijn et al., 2013: 110). For example, parks and forests are known to reduce stress (Hedblom, Gunnarsson & Iravani, 2019: 1), thus allowing emotional restoration and healing (Putra et al., 2021: 1; Astell-Burt & Feng, 2019: 1), because they inspire physical activities, quality of life, and good health among the urban populace (Camarä, 2021: 282; Petersen et al., 2018: 158; Akpinar & Cankurt, 2016: 1091). UGS also encourage social interactions (Wan, Shen & Choi, 2021: 1; Sugiyama et al., 2018: 12); this may reduce seclusion, by generating and maintaining social capital that is hypothesised to improve personal well-being, mainly for the elderly (Julfikar et al., 2022: 1; Jennings & Bamkole, 2019: 2; Lee, Jordan & Horsley, 2015: 131).
2.3 The conservation status of UGS
Literature provides insight into the status of UGS from an international and regional perspective. Yiyi et al. (2021: 391), who recently quantified the spatial patterns of UGS as well as the degree to which they were used in 366 cities on the Chinese mainland, can be used as a starting point. According to their findings, 94% of the UGS, mainly in the north-west, were either underutilised or neglected. In south-western and north-western China, as opposed to eastern China, there was a significant difference in the use of UGS between peri-urban green spaces and intra-urban green spaces. In a related study, Lin, Meyers & Barnett (2015: 952) observed the use of UGS in residential areas in Sydney, Australia. Research findings found an association between UGS and dwelling density, that is, increased densities resulting in a comparable decrease in UGS. In addition, while economically prosperous suburbs had more private UGS, their public UGS was insufficient.
In Poland, Krzyaniak et al. (2015) used linear regression to statistically model the use of UGS in Szczecin, Wroclaw, and Poznan, from 1996 to 2013. Results showed that, in Poznan, more trees had been removed than planted. In Wroclaw, although a few trees were planted, the ones removed were constant. Much of the decline was occurring in recreational parks and streets. They suggested that more public UGS be provided to enhance the environmental sustainability of cities that are currently dominated by built-up land. Wüstemann, Kalisch & Kolbe (2017: 124) also explored the potential of statistical techniques (the Gini coefficient) in examining the status of UGS within the selected cities in Germany. Initial research findings indicated that socio-economic factors such as income, education, age, and number of children in the households, had an impact on access to UGS. A buffer of 500 m around the residential neighbourhoods further confirmed inequality in the provision of UGS, as evidenced by 2.5 m2 per capita in the city of Schwerin and 36.3 m2 per capita in the city of Bergisch Gladbach.
Empirical evidence from previous research in Africa also shows that the provision of UGS remains a challenge in urban areas. For instance, Abebe and Megento (2017: 247) found that Addis Ababa, Ethiopia, had more than 75% of its PDP covered by built-up land, resulting in insufficient UGS. These results are supported by those of Girma et al. (2018: 138), who discovered that between 2003 and 2016, the built-up area in Sebeta Town increased by 562.1%, while UGS decreased by 51.8%. This was mainly caused by insufficient development control, lack of coordination among institutions, and limited awareness of the community of the accrued benefits of UGS. In Lagos, Nigeria, a similar issue recently surfaced where Twumasi et al. (2020: 34) observed a decrease in UGS as a result of uncontrolled agricultural activities and built-up land. For example, between 1986 and 2002, forests and grasslands declined by 42% and 44%, respectively, as opposed to 6% and 64% between 2002 and 2019. The built-up land was 42% between 1986 to 2002, increasing by 33% between 2002 and 2019.
Still in the West Africa region, a triangulation of GIS analysis and the Gini index by Nero (2017: 6993) showed that Kumasi City experienced a 40% loss in UGS between 1986 and 2014. The trend was predicted to further compromise 33% of the city's UGS. A similar challenge was observed in eThekwini Municipality in South Africa, where Otunga, Odindi and Mutanga (2014: 145) depicted a negative correlation between the loss of UGS and an increase in the built-up areas between 2000 and 2006, due to a rapidly growing population and the government's development projects that encroached on the UGS. A recent study by Munyati and Drummond (2020: 4) in Mafikeng also showed that 95.7% of public UGS were lost between 1992 and 2016. The problem was caused by the political changes of 1994 that came with an agenda of providing infrastructure for the people who had been marginalised by the colonial regime.
2.4 A geospatial approach to monitoring UGS
Literature has examined the status of UGS, using geospatial approaches, a departure from the previously reviewed studies. For instance, in an attempt to justify the importance of UGS in the promotion of public health, physical activities and mental welfare of urban residents, Atasoy (2018: 4) modelled the spatial distribution of UGS in Osmaniye City, Turkey. The spatiotemporal analysis confirmed that an increase in population and built-up areas decreased UGS, a problem predicted to further escalate, given that 45% of the city was projected to become urbanised by 2030. Similar results are reported by Vïlcea and Sosea (2020: 2) from Craiova City in Bucharest, where there were disparities in the accessibility of the public parks. Most of the new residential neighbourhoods had also limited access to small green spaces that could be reachable within walking distance. The study proposed establishing small UGS in abandoned public places. A related study by Mehmet (2015: 420) also appraised the distribution and adequacy of UGS in Kutahya City and established that rapid population growth rate, industrialisation, and construction contributed to their loss. The distance between the UGS and residential areas was also observed to be too far. Olad and Monavari (2013: 167) also demonstrated the utility of geospatial application in examining the status of UGS in Tabriz, Iran, for the years 1989 and 2006. Analysis showed that only 4% of the city was covered by UGS, resulting in low UGS per capita. These findings are consistent with that of Badiu et al. (2016: 53), who established that Romania's average UGS per capita of 16.82 m2 was below the country's standard of 26 m2. Unlike in previous studies, where UGS have been reported to be inadequate, the per capita UGS in Bathinda City, India, was within the acceptable standards, although unevenly distributed (Singh, 2018: 2).
2.5 Theory of regulatory compliance
Regulation is one of the statutory functions undertaken by the state. It delineates the boundary between the state, society, and market, thus demonstrating the state's effort toward setting the limits of private activities. This article is, therefore, framed around the theory of regulatory compliance (TRC). According to Fiene (2016: 1), this theory deals with the significance of conforming to regulations, standards, or rules. TRC justifies why economic regulation by the state aims to protect and benefit the public at large rather than a few individuals (Hantke-Dumas, 2003: 165). Thus, because the land is a factor of production, its use should be regulated by the state. One of the ways of achieving this is through physical planning and zoning which aims to resolve conflicts of interest over its use and development and, in so doing, promote sustainable spatial development (Adams, 1994: 110).
When applied to the current study, TRC justifies the existence of a PDP in Kisii Town, Kenya, whose zoning districts serve as a framework for enforcing development control. The theory thus offers a practical understanding of why it is important to preserve the zoned UGS, by using zoning as a tool to enforce the relevant planning regulations. At this point, the question arises as to whether the zoned UGS in this PDP conform to the original plan of 1972.
3. CASE STUDY AREA
3.1 Background to Kisii Town
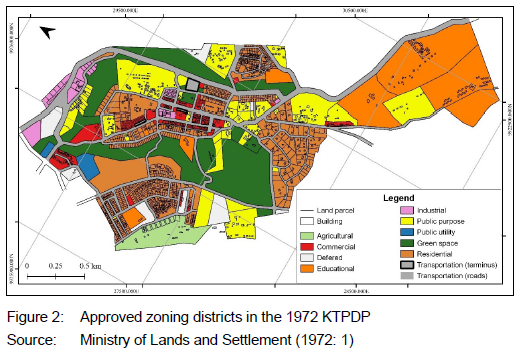
Kisii Town is located in the southwestern region of Kenya, within the UTM Zone 36, 699265.37 mE and 9925518.26 mS, rising 1600-1700 m above sea level. Serving as the headquarters for Kisii county, the town is roughly 120 km from the shorelines of Lake Victoria, the world's second-largest freshwater lake, 313 km west of Nairobi, the capital city of Kenya (Figure 1), and 165 km from the famous Masai Mara Game Reserve (Omollo, 2022: 187). The town has a picturesque hilly landscape that comprises several gorges, ridges, and permanent rivers. It had a population of 112 417 in 2019 which is projected to be 250 000 by 2022.
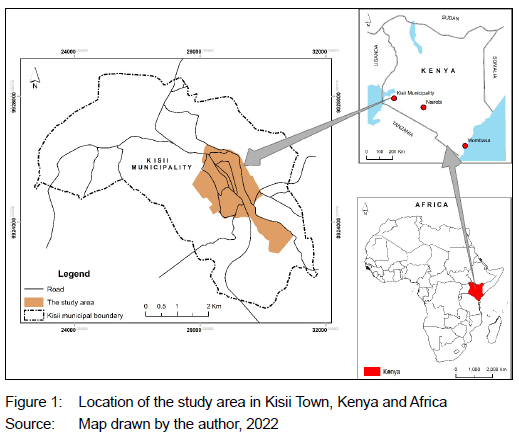
With a population density of 5 058 persons per km2, the town rates as the third most densely populated urban centre in Kenya (Omollo, 2022: 188). Kisii Town experiences a highland equatorial climate, with a bimodal rainfall pattern which gives an annual average of 1 500 mm. While long rains occur between March and June, short rains are mostly experienced from September to November. July and January are, however, ordinarily dry. The maximum and minimum temperatures are correspondingly 21°C to 30°C and 15°C to 20°C (Nyang'au et al., 2021: 3). Such favourable climatic conditions present an opportunity for establishing and maintaining adequate UGS in the town. Although Kisii Town spatially covers 34 km2, only 4.35 km2 (12.79%) is planned (see Figure 1). This is the area covered by the 1972 KTPDP.
3.2 Rationale for selecting the case study
Kisii Town makes an ideal case study for two reasons. First, since it has an approved PDP with zoned UGS, the current study was motivated to investigate whether the CGOK was effectively using development control instruments in ensuring that the zones are conserved. This is due to the fact that the CGOK has a Municipal Board and a well-established Directorate of Physical Planning and Development. The main issue is whether having these institutions and the accompanying laws has made it easier to preserve zoned UGS.
Secondly, it is worth noting that, although Kisii Town is rated as Kenya's 24th largest urban area in terms of population, its intercensal growth rate of 87% (1999-2019) surpasses that of the top three largest cities in Kenya, including Nairobi (41%), Mombasa (33%), and Kisumu (57%). The growth rate is bound to escalate with the proposed expansion of the town's boundary in conformity with the recently acquired municipal status. In the absence of adequate physical planning interventions, a high population increase will likely create more demand for additional land in support of development. However, given that the zoned UGS are not protected, they will prospectively attract the attention of developers who might be perceiving them as idle public land. From this perspective, the town was selected as a case study to explore the balance between the observed population growth rate and the conservation of zoned UGS.
4. METHODOLOGY
4.1 Research strategy
This article sought to determine conformity to the zoned UGS in the approved KTPDP. It thereafter investigated the drivers of such non-conformity. To achieve these two objectives, a case study research approach (Heale and Alison, 2018: 7) with a mixed research design (Dawadi, Shrestha and Giri, 2021), where both quantitative and qualitative data were collected, was adopted. Quantitative/numerical data (in hectares) on land use and land cover (LULC) were measured and computed from satellite images to describe and explain the extent of conformity to the zoned UGS in the KTPDP. Qualitative data was collected through inspecting the Building Plans Register that was retained by the Department of Physical Planning and questionnaires designed with nominal/categorical variables that were used to explore why the developers did not conform to the zoned UGS. A concurrent triangulation of qualitative and quantitative data provided a prospect for corroborating if there was a link between conformity to the zoned UGS and the drivers of LULC in the study area.
4.2 Population and sampling
The population comprised 367 developers whose buildings were located within the zoned UGS of the KTPDP. Using Google Earth (GE) satellite image dated February 2022, these buildings were first spatially identified, then georeferenced and digitised. A sample size of 186 developments was then determined, using the table provided by Krejcie and Morgan (1970: 1). This table indicates that a sample size of 186 should be used when the population size is between 360 and 380. The samples were then randomly picked, using a random number table that was generated, using Microsoft Excel software, to ensure that each developer had the same likelihood of being selected (Thompson, 2012: 11).
4.3 Data collection
GE satellite images give free high spatial resolution satellite images capable of being used in the mapping of LULC change in urban areas (Bao & Duong, 2018: 75; Malarvizhi et al., 2016: 1836). To explore their utility in the current study, GE images for 2005, 2011, and 2022 were used, between January 2022 and May 2022, to examine if the zoned UGS in the approved KTPDP were being conformed to by the resulting LULC patterns. Regarding the drivers of nonconformity to the zoned UGS, a closed-ended questionnaire was used in gathering qualitative data in April and May 2022. The scale of measurement was categorical/nominal, with the questionnaire having five key variable questions framed in the form of a 'yes' or 'no' response, including:
a. Do you own the land where your building is located?
b. Did you apply for a development permit?
c. Did you obtain a development permit?
d. Did you engage a registered professional (architect) in your building design?
e. Was your building inspected during construction?
Content analysis was used to determine whether the sampled buildings had the CGOK's approval and whether registered architects had prepared them. This query was validated by inspecting the Building Plans Register that was available at the Department of Physical Planning. To achieve this, land/ plot numbers that were recorded as one of the background information in the developers' questionnaires were searched from the register. The register was further inspected to find out whether the CGOK had approved a change of use or extension of use from the zones reserved for UGS.
4.4 Data analysis
To determine the extent of conformity to the zoned UGS, there was a need to first develop LULC classification criteria that would provide a basis for a systematic spatiotemporal analysis. Since the literature search revealed a lack of unanimity on a standard criterion, the current study, with modifications, adopted the proposed classification system recommended by Anderson et al. (1976: 10-22). This led to four categories of LULC (see Table 1).
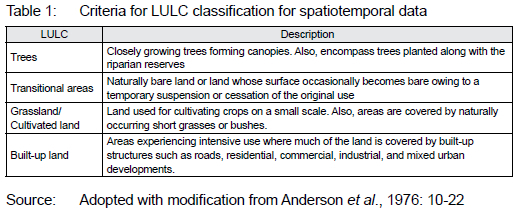
Grassland/cultivated land was grouped under a common LULC, owing to their spectral similarity, an approach corroborated by Contesse, van Vliet and Lenhart, (2017: 1) who confirmed a complementarity between urban agriculture and UGS in Santiago, Chile. Further to this, the KTPDP permitted urban agriculture within the UGS, due to their compatibility. Areas covered by built-up land and transitional areas were considered not compatible with the zoned UGS that included riparian reserves, parks, stadiums, and golf courses. This provided the basis for quantifying conformity for 2005, 2011, and 2022. In this case, their areas (ha) were added, and the total was deducted from the original area (75 ha) that was covered by the zoned UGS in the KTPDP. The result showed the amount of UGS that had been lost, consequently depicting the extent of nonconformity. The computed results were further validated through spatiotemporal analyses covering 2005, 2011, and 2022. Having determined the LULC classification criteria, each of the three GE images was separately copied and assigned 20 common ground control points for georeferencing. The placemarks contained data on the UTM coordinates. To ensure that the original high-quality resolution of the images was preserved, the files were saved in Tag Image File (TIF) format. Data mining and spatial analysis were then undertaken as follows:
a. Scanning and georeferencing the KTPDP, by assigning 150 control points that were related to the GE images, followed by transformation and vectorisation of the transformed raster data into 10 zoning districts of the plan.
b. Adding the three images (for 2005, 2011, and 2022) to ArcMap and thereafter georeferencing them, using ground control points (x, y coordinates/eastings and northings) that were earlier extracted from GEE as placemarks. The polynomial transformation was then done to have a georeferenced image.
c. Clipping from the vectorised KTPDP the polygons that were zoned as UGS.
d. Using the above clipped UGS polygon as a mask layer to further extract the raster data for 2005, 2014, and 2022.
e. Running the ISO cluster unsupervised classification for each extracted image.
f. Determining and executing the appropriate land-use classification model.
g. Making LULC maps/layouts for the years 2005, 2011, and 2022.
h. Undertaking an accuracy assessment of 2005, 2011, and 2022 LULC classifications, using corresponding GE images.
i. Calculating LULC change for 2005-2011, 2011-2014, and 2014-2022. This also involved converting into hectares (ha) the area covered by each land-use class, using cell size 2.7 m by 2.7 m. The step also involved computing the amount of UGS that remained after intrusion by the incompatible LULC, namely, the built-up land and transitional land.
Through SPSS software, data collected from developers were analysed, using descriptive statistics that also included the chi-square test of independence (χ2) and Spearman correlation (ρ), because all variable questions were categorical (yes/no). As endorsed by Ugoni and Walker (2005: 1), the chi-square test and Spearman correlation are suitable when there is a need to test the association between two categorical variables.
4.5 Tests for reliability, validity, and normality
The reliability of the questionnaire was assured through a pilot study undertaken along River Riana, which traverses Kisii Town but does not fall within the KTPDP. To attain this, the GE satellite image of 2022 was used to delineate a 30-m wide, and one km-long riparian reserve of the river (one of the UGS), followed by the digitisation of 126 buildings falling within the zone. The width of the buffer was guided by the Environmental Management and Coordination (Water Quality) Regulations, 2006 (The Republic of Kenya, 2006: 5), which prescribe a 30 m riparian reserve. As suggested by Connelly (2008: 411), 10% (19) of the main sample size (186) was then used for the pilot survey. The reliability of the questionnaire was then determined through the test-retest process. This method measures the consistency of results when the same test is repeated on the same sample at a different point in time (Vilagut, 2014: 3). To conform to this criterion, a test-retest with a two-week lapse was used in determining the reliability of the developers' questionnaire. Analysis was afterwards undertaken, using Pearson's bivariate correlation to explore the strength of the association between the two tests. The desirable p-value was less than 0.05. According to Cicchetti (1994: 2), while a correlation of 0.4-0.59 is fairer, 0.60-0.74 is better, and more than 0.75 is rated excellent. External validity was guaranteed, by safeguarding that only the developments that were within the zoned UGS be included in the study. This gave confidence that the study findings could be generalised to other urban areas with similar problems in the conservation of UGS within approved PDPs. Lastly, the Shapiro-Wilk Test was used to determine whether the sample data came from a normally distributed population.
5. RESULTS AND DISCUSSION
5.1 Response rate, test for reliability and normality
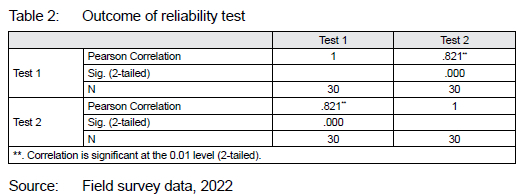
From the sampled population of 186 developers, 175 administered questionnaires were successfully collected, thus a response rate of 94%, exceeding the 60% threshold recommended by Fincham (2008: 1). This confirmed that the research findings could be generalised to the study population, thus reducing the risk of biased response. As presented in Table 2, a Pearson Correlation of .821 similarly gives credibility that the questionnaire was reliable and, therefore, capable of yielding consistent results over time.
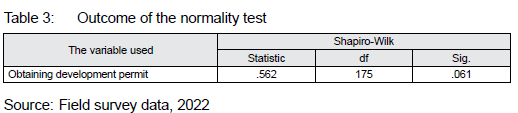
The Shapiro-Wilk Test for Normality (Table 3) shows a p-value greater than 0.05. This indicates that the data was suitable for further analysis, in addition to assuring that it could be used later in drawing a logical conclusion from the study that the zoned UGS in the KTPD has been declining since 2005, despite the legal framework allowing the CGOK to carry out development control.
5.2 Zoning districts in the KTPDP - An overview
The approved 1972 KTPDP is based on Euclidean Zoning (named after a Euclid city in Ohio, USA), also known as 'building block zoning', that segregates land uses into distinct spatial districts that indicate the permitted developments in each district. The emphasis of Euclidean Zoning is mainly on promoting spatial orderly development, preventing overcrowding, and segregating land uses that are deemed incompatible (Komarov et al., 2019; Brown et al., 2018: 64). The 10 zoning districts in the PDP (see Figure 2) are, therefore, used as a tool for administering development control in Kisii Town with an objective to:
a. Clearly outline the permitted land-use activities.
b. Describe the criteria considered in the case of a change of use, an extension of use or land subdivision, or a general classification of land use in the PDP.
c. Provide a basis for determining the institutional structure and the process that should be followed in receiving and approving development permits.
d. Provide a guide for developers and professionals in the built environment, for example, physical planners, land surveyors, engineers, quantity surveyors, environmental assessors/ auditors and architects, on the complementary roles they ought to play in promoting sustainable spatial development. This also includes advising their clients on the requirements of the zoning regulations.
The PDP covered 4.35 km2. An exceptional trait of the plan was zoned UGS modelled to form an enclosure around the town centre (Figure 2). As noted from the literature search, UGS benefits the urban environment through its ability to control urban heat islands, providing carbon sinks, and lessening the effects of stormwater. They also afford health benefits to urban dwellers through the provision of spaces that can be used for physical activities, thus allowing mental rejuvenation to occur. Figure 3 presents the proportional coverage of UGS in the KTPDP as likened to other zones.
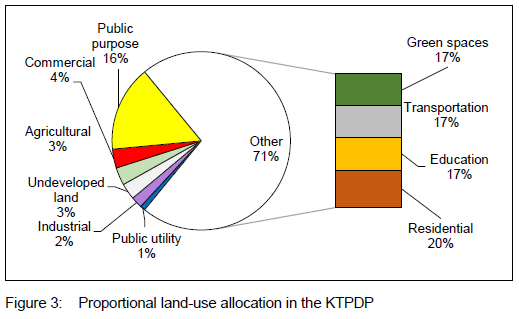
The PDP reserved 17% (75 ha) of land for UGS. These included riparian reserves, public parks, the Gusii Stadium, and the Kisii Golf Course. Other allocations were transportation (17%, 75 ha), residential (20%, 88 ha), public purpose (16%, 68 ha), commercial (4%, 15 ha), agricultural (3%, 14 ha), undeveloped land (3%, 13 ha), industry (2%, 9 ha), and public utility (1%, 4 ha). As noted earlier, the plan supported urban agriculture within the zoned UGS, owing to their compatibility. After introducing the zoning districts, the following subsections assess how much the resulting LULC has been gradually conforming to the 75 ha of land (17%) zoned as UGS in the KTPDP
5.2.1 Zoned UGS conformity assessment, 2005
The extent of conformity began by examining the status of LULC in 2005, the preliminary year for spatiotemporal analysis. The outcome showed that, during this time, 14 299, 32 196,
41 757, and 16 802 pixels were classified as trees, transitional areas, grassland/cultivated land, and built-up land, respectively. These were further translated into percentages and hectares for ease of interpretation (see Table 4).
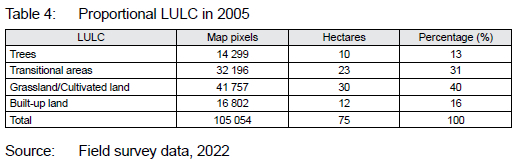
Grassland/Cultivated land reported the highest coverage of 40%, followed by transitional land (31%), built-up land (16%), and trees (10%). The only LULC deemed compatible with the zoned UGS
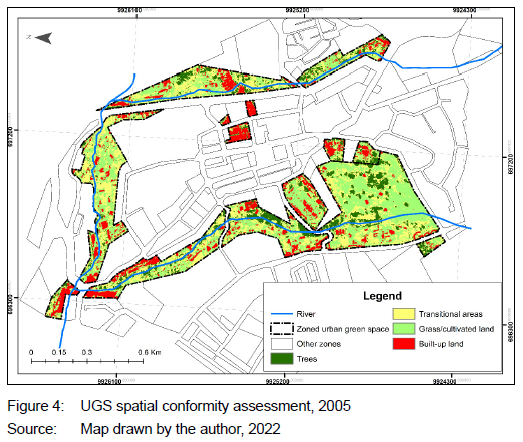
were trees and grassland/cultivated land. Table 2 further confirms that, by 2005, the built-up land and transitional areas had encroached on 35 ha (or 47% ofthe total area) of the zoned UGS in the KTPDO, reducing its spatial coverage to 40 ha. The status of LULC is further depicted spatially in Figure 4.
Accuracy assessment is essential in remote sensing because spatial analysis with data ofhardly any accuracy may result in information having low reliability (Huang et al., 2017: 3). Table 5 presents the results of the accuracy assessment for the 2005 LULC classification.
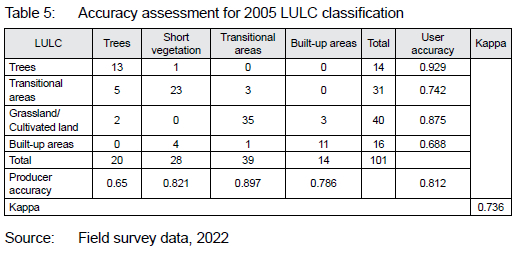
Useraccuracy shows the likelihood that a value, projected to belong to a given class, is part ofthat class. It is based on the number of values that have been correctly predicted to the sum of values that were projected to belong to a class. In this way, it calculates the error of commission, by indicating the level to which the
image classified truthfully embodies the reality on the ground. Results in Table 5 show that tree coverage reported the highest user accuracy of 93°% (with a commission error of 7%). Built-up areas, on the other hand, had the lowest user accuracy of 69%, thus a commission error of 31%. This was mainly occasioned by four pixels of grass/cultivated land and one pixel of transitional areas that were erroneously classified as built-up areas owing to a similarity in spectral reflectance. The overall accuracy for the 2005 classification was 81%. A Kappa coefficient of 0.736 further validated the classification accuracy. As Figure 3 shows,in 2005, much of the built-up land on the UGS was located at the lower part ofthe KTPDP (Daraja Mbili), Nyakongo Junction and the town centre, where roughly 1.5 ha of land had been set aside.
5.2.2 Zoned UGS conformity assessm ent, 2011
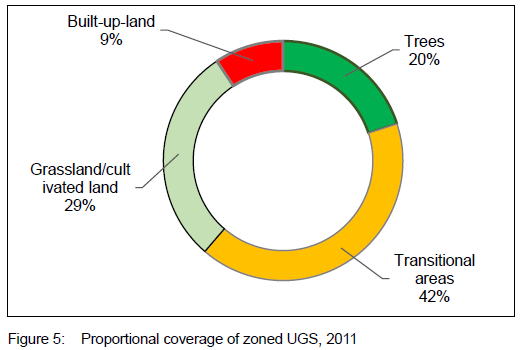
A further spatial analysis was undertaken in 2011 to progressively determine the extent to which the ensuing land-use development patterns were conforming to the zoned UGS in the plan. Results demonstrated that transitional areas recorded the highest proportionate coverage of 41% (15 ha), followed by grassland/ cultivated areas at 29%% (22 ha), and built-up-land, at 9% (7 ha) (see Figure 5). These results prompted a further comparative analysis to account for LULC between 2005 and 2011 (see Table 6).
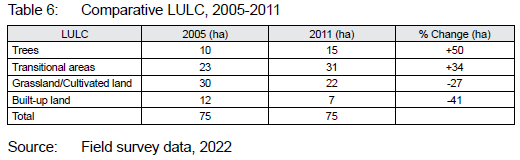
Results in Table 6 confirm that the highest gainers of the 2011 LULC were transitional areas and trees, whose spatial coverage within the UGS increased by 34% and 50%, respectively. On the other hand, the grass land/cultivated land and built-up land declined by 8% and 5%, respectively. Similar to 2005, a further assessment was undertaken to quantify the extent to which transitional areas and built-up land had affected the zoned UGS. Results presented in Table 6 show that 38 ha (51%) were converted, thus reducing the coverage of UGS to 37 ha. The implication of this interaction is spatially depicted in Figure 6.
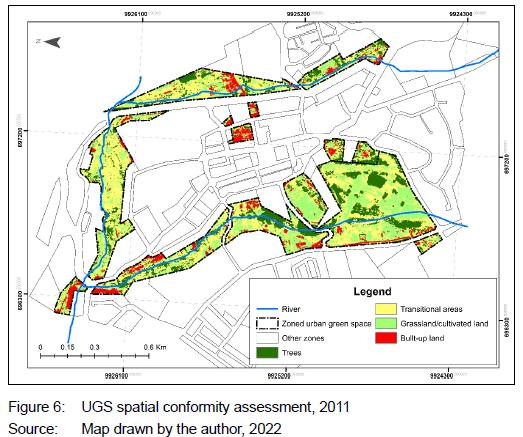
A decline in the built-up land was mainly prompted by the demolition of buildings that encroached on the riparian reserves near Daraja Mbili Market by a joint task force that comprised the National Land Commission, CGOK, Kenya Police Service, National Construction Authority, Water Resources Management Authority, National Disaster Management Unit, National Youth Service, and National Environment Management Authority. Conversely, while an increase in tree coverage during the same period could have been caused by the CGOK's campaign of planting at least 30 000 trees in Kisii Town, a corresponding increase (6%) in the transitional area may have arisen on account of the fact that land that was previously under cultivation agriculture/grassland declined either because the crops (mainly maize) that were under cultivation had been harvested or because lack of adequate precipitation could have hindered the growth of adequate grass. To ensure the validity of the 2011 LULC classification, an accuracy assessment was undertaken in the form of a confusion/error matrix (see Table 7).
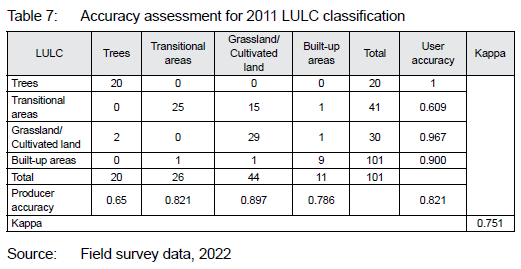
Table 7 shows that the overall accuracy for the classification was 82%, exceeding the threshold of 80%, as recommended by Anderson (1976: 20-25). Apart from this, the Kappa value of 0.75 further corroborates the credibility of the classification. Generally, while the commission error for transitional areas was 39%, that of grassland/ cultivated land was 0.03%. The commission error for the transitional areas was due to grass/cultivated land and built-up areas, which were erroneously classified as transitional land, owing to spectral similarities. Comparatively, areas under trees reported the highest omission error of 35%, due to grassland/cultivated land, which was erroneously excluded as trees, again, owing to spectral similarities. Concerning the built-up areas, the resulting commission and omission errors were caused by spectral similarities with grassland/cultivated land and transitional areas, respectively.
5.2.3 Zoned UGS conformity assessment, 2022
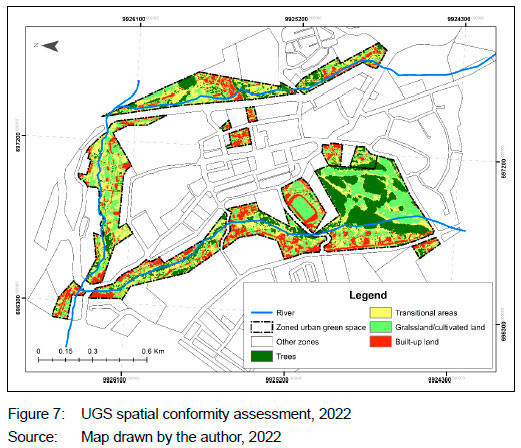
A final spatial analysis was undertaken to progressively determine whether the resultant LULC patterns in the study area were conforming with the zoned UGS in the KTPDP. Research findings showed that, by 2022, trees covered 17 ha (23.7% of the zoned UGS), transitional areas, 22 ha (28.9% of the zoned UGS), grassland/cultivated land (28.9% of the zoned UGS), and built-up land, 14 ha (18.4% of the zoned UGS). By 2022, 36 ha of the built-up land and transitional areas had encroached on the zoned UGS, thus leaving a balance of 39 ha (52%). This information is spatially corroborated in Figure 7, where a visible intrusion by the built-up land is now more pronounced than in 2005 and 2011.
As in the case of the 2005 and 2012 LULC classifications, an accuracy assessment for the 2022 LULC classification was also undertaken to assure that the resulting classes of LULC were valid as per the acceptable standards for the classification of remotely sensed images. The results are presented in Table 8 and thereafter discussed.
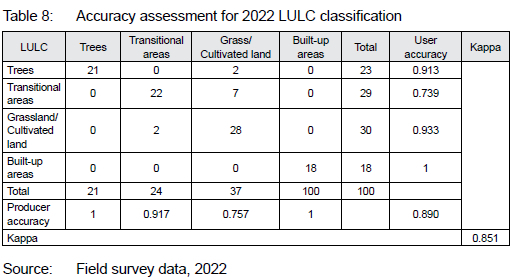
In comparison to previous classifications, the 2022 LULC yielded the highest overall accuracy, as evidenced by 89%. The corresponding Kappa value of 0.851 (interpreted as strong agreement) also gave credence to the classification, thus confirming that the results may be used in undertaking spatial analysis, in addition to drawing a logical conclusion on the research findings. The built-up areas had respective user and producer accuracies of 100%.
Grassland/Cultivated land had the lowest producer accuracy of 76% (omission error of 0.243), due to spectral similarity with transitional areas. To further put into context the dynamics of LULC in 2022, a comparative descriptive spatial analysis was undertaken to examine two central issues (see Table 9). First, a progressive comparison of LULC between 2011 and 2022, and secondly, an additional comparison of LULC between the base year of spatiotemporal analysis (2005) and 2022.
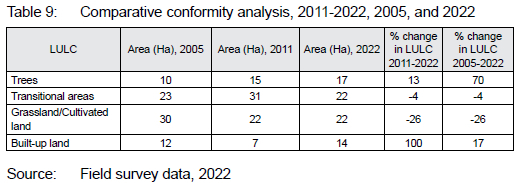
Regarding LULC from 2011 and 2022, tree cover increased by 13%. This change is considered favourable since trees are compatible with UGS. Transitional areas, however, declined by 4%. Although significant, the outcome is still not favourable for the conservation of UGS. As indicated in Table 1, transitional land is construed as land that is naturally bare or whose surface occasionally becomes bare, owing to a temporary suspension or cessation of the original use. Owing to this trait, parts of areas zoned as UGS not covered by compatible land cover are predisposed to environmental problems, particularly those associated with urban heat islands. Attention is, however, drawn to the 100% increase in the areas covered by built-up land, a change that is also not favourable, because it negates one of the already acknowledged benefits of UGS, that is, mitigation of the impacts of urban heat islands. As noted earlier, this fact is corroborated in Figure 6, where built-up land now clearly dominates the zoned UGS, compared to 2005 and 2011.
Concerning 2005 and 2022, land under tree cover still dominates the zoned UGS as shown by an increase of 70%, a trend compatible with UGS. Many of the trees were planted within the Kisii Golf Course. This increase may be explained by two complementary policy issues. First, the Government of Kenya's countrywide policy for realising and preserving more than 30% of tree cover by 2030. Secondly, the concerted efforts by the CGOK to annually plant over 100 000 trees to promote environmental conservation, and to mitigate the impacts of climate change. Turning to transitional areas, as observed earlier, a decline of 4% is still not favourable, because they expose UGS to environmental impacts such as urban heat islands and soil erosion. A similar argument arises from the 17% increase in built-up land. To this end, a summary of the relationship between zoned UGS and LULC is presented in Figure 8.
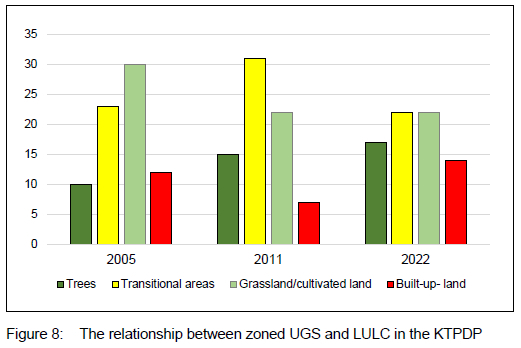
Figure 8 shows that, between 2005 and 2022, built-up land and transitional areas have been the main contributors to nonconformity to the zoned UGS in the 1972 KTPDP. In light of these findings, the current study sought to evaluate Kisii Town's current per capita UGS. This was guided by the UN's Sustainable Development Goal 11.7 (SDG 11.7), which states that nations should provide public UGS that are easily accessible, safe, and non-discriminatory to people with disabilities, the elderly, children, and women in particular, by the year 2030 (UN, 2022: 1). WHO (2016:1) consequently recommends that cities ought to provide at least 9 m2 of UGS for every person/per capita, provided that it is accessible, safe, and functional. With an estimated 200 000 residents, Kisii Town's per-person UGS is calculated to be 1.95 m2 (390 000 m2/39 ha divided by 200 000). This is less than the WHO (2016: 1) recommendation, leaving a deficit of 7.05 m2.
5.3 Drivers of nonconformity to zoned UGS in Kisii Town
After confirming that the resulting LULC patterns do not adhere to the zoned UGS in the approved KTPDP, this subsection investigates the factors supporting the status quo and causing the town to deviate from the ideal minimum per capita UGS. The variables examined were the application and approval of a development permit, the engagement of registered professionals (the architects), and the inspection of buildings during construction.
5.3.1 Application and approval of development permission
Developers from the entire sample (100%) stated that they were the owners of the land on which the buildings were located. The repealed Physical Planning Act (The Republic of Kenya, 1996: 18) obligated anyone in need of a development permit to apply to the planning authority concerned for approval. This requirement has been retained under section 57(1) of the Physical and Land Use Planning Act (The Republic of Kenya, 2019: 640) (which repealed the 1996 Physical Planning Act), indicating that a person shall not carry out development without approval from the respective county executive committee member. In the event of non-compliance, section 57(2) imposes a fine of up to 500 000 Kenyan shillings (equivalent to USD400, July 2022) or incarceration for a period of not less than two months or both. With this insight, the current study interrogated two variables, namely whether developers applied for development permission and whether they obtained development permission. Relating to the former, research findings revealed that 72% (126) of developers within the zoned UGS made an application for development permission compared to 28% (49) who did not. The two variables were cross-tabulated to determine their envisaged descriptive relationship (see Table 10).
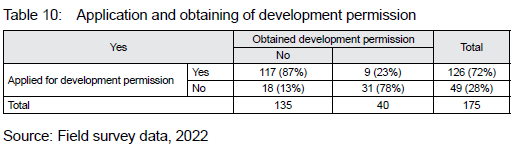
Table 10 shows that, among those who applied for development permission, 87% were successful compared to 23% who were not.
Regarding those who failed to apply, 13% still obtained permission, thus raising a high possibility of unethical practices within the development control process. The reason for this is that development permission should only be granted to developers who conform to the set criteria. These findings have two implications. First, although the KTPDP has zoned UGS, the CGOK still permitted developments within them without imposing the mandatory change of use or extension of use to developers, thus a case of the planning authority flouting its zoning guidelines. Secondly, some developers (23%) who did not obtain permission still developed within the zoned UGS. This reveals inadequate monitoring and development control by the CGOK, thus affecting conformity to the zoned UGS. In light of this, the study explored whether the two variables, namely applying and obtaining development permission, were statistically significant. The results of the Pearson chi-square (χ2) analysis are presented in Table 11.
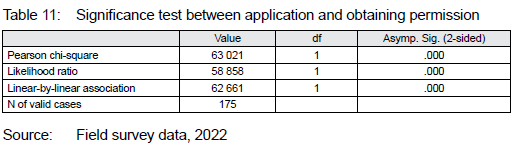
It is clear from Table 11 that, given that the Pearson chi-square (χ2) = 63.021 and p = .000, there was a statistically significant association between the application and obtaining a development permit. The implication is that, if developers were to rightfully make applications for development permits that are supported by a stringent vetting and monitoring regime by the CGOK, this may potentially deter encroachment on zoned UGS. The observed statistical significance was also interrogated to determine its strength of association (see Table 12).

As shown in Table 12, since Phi and Cramer's V (Φ>c) are respectively .600, the association between applying and obtaining development permission was strong. Further, a significant Spearman correlation (ρ) value of .600 was equally rated as strong, thus corroborating the outcome of the significance test in Table 8. This suggests that, if developers were to procedurally apply for development permission, they are likely to seek guidance from the CGOK on obtaining such development permissions.
5.3.2 Advisory roles of registered professionals
Professionals within the building construction industry (planners, architects, surveyors, and environmentalists) play a critical role in ensuring that their clients (developers) comply with the applicable zoning regulations, a fact anchored in their professional code of ethics and conduct. Since the first point of contact in the design of a proposed building is a registered architect, the current study determined whether the developers in the study area engaged them. This line of inquiry was informed by section 3(1) of the Architects and Quantity Surveyors Act (The Republic of Kenya, 2012: 17), which prohibits persons, who are not registered by the Board for the Registration of Architects and Quantity Surveyors (BORAQS), from practising as architects. Research findings, however, show that 25% did not engage architects in the initial design, an indication that they lacked professional opinions that could have guided them on the site suitability for their construction projects.
An inquiry into the 75%, who alluded to having engaged architects, established that they did not verify whether they were registered by the BORAQS. The contracted 'architects' could likely have acted as brokers who undertook assignments and thereafter sought the services of registered architects to endorse their work at a negotiated fee. The finding was supported by the results of content analysis, which showed that 71% of the buildings sampled could not be traced in the Building Plans Register maintained by the Department of Physical Planning; yet there was evidence of new buildings that were recently developed in the study area. Further, the register lacked the vital records of architects who submitted building plans. In addition, most of the plans sampled and stamped by 'architects' did not indicate their registration details; yet they were approved by the CGOK. There was also no evidence that the CGOK approved a change or extension of use from the zones reserved for UGS.
With this background, additional analysis was undertaken to explore the link between having permission to develop and engaging architects (see Table 13).
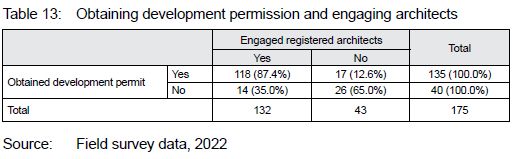
Table 13 shows that, among those who obtained development permission, 88% engaged architects, compared to 13% who did not. Conversely, regarding developers who lacked permits, 65% did not engage registered architects, compared to 35% who did. These statements have also a significant bearing on the conservation of UGS. In this case, some architects rarely advise their clients on the recommended UGS zoning regulations. Further, developers have not been enlightened on the importance of validating the qualifications of the architects they engage. However, as previously observed from the content analysis, it is cause for concern that the CGOK has been granted development permits without ensuring that the applications are lodged by registered architects. This fact was previously corroborated when the sampled building plans and the Building Plans Register in the Department of Physical Planning were found not to have the registration details of architects. These limitations in combination are a major driver of nonconformity to the zoned UGS in the KTPDP.
The observed relationship was further tested to determine statistical significance (see Table 14).
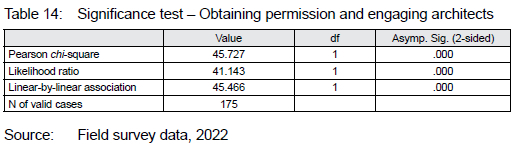
With χ2 = 45.727 and p = .000, Table 14 confirms a significant link between obtaining a development permit and engaging registered architects. This may suggest that, even though developers may be engaging registered architects, there is no guarantee that the architects are likely to advise them against developing in the zoned UGS. The problem is heightened by the CGOK, since it has been flouting its zoning regulations by approving developments within the zoned UGS. This fact was corroborated by the Building Plans Register at the Department of Physical Planning, which indicated that some buildings from the study area had been approved without the mandatory requirement for the change/extension of land use. This was also verified in Table 7, where 87% of the developers reported that they obtained development permits from the CGOK.
5.3.3 Monitoring of building development
The Building Code, Local Government (Adoptive By-Laws) (Building) Order (The Republic of Kenya, 1968: 17), requires all buildings under construction to be regularly inspected. It, therefore, forbids the occupation or use of any building before the issuance of a certificate of completion. This statutory provision certainly presents a clear framework for monitoring building development to ensure that they are not developed within the zoned UGS as provided under the approved KTPDP. The preliminary research findings established that 37% of the sampled buildings sited within the zoned UGS were not inspected during their entire construction process, compared to 63% that were successfully inspected. Table 15 provides a descriptive comparative analysis of obtaining permits and building inspection during construction.
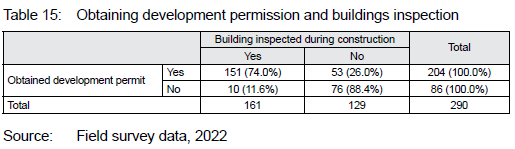
As presented in Table 15, of the developers who reported having obtained development permission, 74% indicated having been subjected to inspection. Regarding developers who had no permission, 11% were still inspected. These findings further cast doubt on the effectiveness of development control by the CGOK. In this case, the 63% who reported that their buildings were inspected may suggest that the CGOK inspected buildings that were contravening the zoned UGS. Such buildings should not have been approved since they are located within zoned UGS. Likewise, the fact that developers who had not obtained development permission still had their development inspected during the construction process confirms the central argument in this article that noncompliance with the zoned UGS in the KTPDP is largely caused by the CGOK's non-committal in enforcing the approved zoning regulations.
The findings of the current study so far compare to that of Dzifa and Yaw (2021: 10), who established that, within 27 years (1991-2018), the urban built environment expanded by 29%, thus affecting the UGS, which declined by 26% in Accra, Ghana. The findings of the current study similarly corroborate that of Haaland and Van den Bosch (2015: 760), who established that densification in urban areas can have implications for the conservation of UGS. The findings of the current study further relate to that of Beiranvand, Bonyad & Sousani (2013: 321), who confirmed that per capita green space in Khorramabad, Iran, was not proportional to the universal standards. However, while the scope of these studies was limited to the general UGS, this article examined conformity to zoned UGS in approved PDPs, thus filling a knowledge gap that existed in the town-planning literature. It further examined what drives the observed non-conformities.
6. CONCLUSION
Zoned UGS in the KTPD have increasingly lessened since 2005. The trend persists, regardless of the legislative framework that empowers the CGOK to undertake development control. The state of affairs has undermined compliance with the minimum recommended per capita UGS of 9 m2, hence contributing to unsustainable urban development. This has, in turn, made the residents of Kisii Town not enjoy the benefits that accrue from UGS. The problem is intensified by developers who deliberately construct in the zoned UGS without permission, inadequate quality assurance audits by the CGOK, and architects who do not adequately advise their clients on the applicable zoning regulations. These challenges in combination are aggravated by the revelation that the CGOK disregards its zoning regulations. If these problems continue unabated, encroachment into the UGS will rapidly accelerate at the disadvantage of sustainable urbanism, thus negating the CGOK's vision of making Kisii Town a world-class town that ensures a clean and healthy environment for all.
This article makes three policy recommendations. First, it is a fact that much of the UGS have been lost to development. Reclaiming them might, therefore, not be feasible, given the prevailing political environment. To overcome this, the CGOK should instead prepare a physical and land-use development plan that covers the entire Kisii Town, as construed under the Physical and Land Use Planning Act of 2019. While this is done, new UGS should be zoned and protected as a strategy for meeting or exceeding the recommended per capita UGS of 9 m2. The focus should be on establishing new UGS away from the central business district where the existing ones have been reduced to unsustainable sizes. While doing so, their proximity to neighbourhoods and safety should not be overlooked. In the meantime, the existing UGS should be immediately secured to prevent further encroachment. Secondly, the CGOK, in liaison with regulatory bodies such as BORAQS, should vet, document, and ensure that only duly registered architects participate in the development control process in Kisii Town. Thirdly, the CGOK should undertake regular surveillance to detect any unauthorised development. Similarly, the CGOK should ensure that each approved development is monitored at all phases of construction to promote compliance. This study has, therefore, filled a gap that previously existed in the town-planning literature on how conformity to zoned UGS in PDPs may be analysed through spatial and temporal approaches. Its scope was limited to conformity to zoned UGS. However, to further enrich the existing body of knowledge, future research discourse on UGS may be undertaken to determine the nexus between the depletion of zoned UGS and climate change.
REFERENCES
ABEBE, M.T. & MEGENTO, T.L. 2017. Urban green space development using GIS-based multi-criteria analysis in the Addis Ababa metropolis. Applied Geomatics, 9(4), pp. 247-261. https://doi.org/10.1007/s12518-017-0198-7 [ Links ]
ARIBIGBOLA, F. 2008. Improving urban land use planning and management in Nigeria: The case of Akure. Theoretical and Empirical Researches in Urban Management, 3(9), pp. 1-14. [ Links ]
ADAMS, D. 1994. Urban planning and the development process. London: Routledge. [ Links ]
AKPINAR, A. & CANKURT, M. 2016. How are characteristics of urban green space related to levels of physical activity: Examining the links. Indoor and Built Environment, 26(8), pp. 1091-1101. Doi/pdf/10.1177/1420326X16663289 [ Links ]
ANDERSON, J.R., HARDY, E.E., ROACH, J.T. & WITMER, R.E. 1976. A land use and land cover classification system for use with remote sensor data. Geological Survey Professional Paper 964. [Online]. Available at: <https://pubs.usgs.gov/pp/0964/report.pdf> [Accessed: 14 February 2022]. https://doi.org/10.3133/pp964 [ Links ]
ARABI, Z., HATAMI, D. & JADIDOLESLAMI, M. 2014. Analysis of the pattern of spatial-local distribution of green space (case study of Mehr city in Iran). Indian Journal of Scientific Research, 8(1), pp. 197-202. [ Links ]
ASTELL-BURT, T. & FENG, X. 2019. Association of urban green space with mental health and general health among adults in Australia. JAMA Network Open, 2(7), article number 198209, pp. 1-22. https://doi.org/10.1001/jamanetworkopen.2019.8209 [ Links ]
ATASOY, M. 2018. Monitoring the urban green spaces and landscape fragmentation using remote sensing: A case study in Osmaniye, Turkey. Environmental Monitoring and Assessment, 190(12), article number 713, pp. 1-4. https://doi.org/10.1007/s10661-018-7109-1 [ Links ]
BADIU, D., IOJÄ, L., CRISTIAN, I., PÄTROESCU, M., BREUSTE, J. & ARTMANN, M. et al. 2016. Is urban green space per capita a valuable target to achieve cities' sustainability goals? Romania as a case study. Ecological Indicators, 70, pp. 53-66. https://doi.org/10.1016/j.ecolind.2016.05.044 [ Links ]
BAO, T.Q. & DUONG, P.Q. 2018. Use of high-resolution Google Earth Images of land use/land cover mapping in Thuy Trieu Commune, Thuy Nguyen District, Hai Phong City. Management of Forest Resources and Environment, 2(18), pp. 75-84. [ Links ]
BEIRANVAND, A., BONYAD, A.E. & SOUSANI, J. 2013. Evaluation of changes in per capita green space through remote sensing data. International Journal of Advanced Biological and Biomedical Research, 1(4), pp. 321-330. [ Links ]
BROWN, G., SANDERS, S. & REED, P. 2018. Using public participatory mapping to inform general land use planning and zoning. Landscape and Urban Planning, 177, pp. 64-74. https://doi.org/10.1016/j.landurbplan.2018.04.011 [ Links ]
CALLAGHAN, A., MCCOMBE, G., HARROLD, A., MCMEEL, C., MILLS, G., MOORE-CHERRY, N. & CULLEN, W. 2020. The impact of green spaces on mental health in urban settings: A scoping review. Journal of Mental Health, 30(2), pp. 179-193. https://doi.org/10.1080/09638237.2020.1755027 [ Links ]
CAMARÄ, G. 2021. Urban green spaces: Public health and sustainability in the United States. Journal of the American Planning Association, 88(2), pp. 281-282. https://doi.org/10.1080/01944363.2021.1987803 [ Links ]
CGOK. 2013. Kisii County Integrated Development Plan 2013-2017. [Online]. Available at: <https://repository.kippra.or.ke/handle/123456789/1314.> [Accessed: 29 July 2021]. [ Links ]
CICCHETTI, D.V. 1994. Guidelines, criteria, and rules of thumb for evaluating normed and standardized assessment instruments in psychology. Psychological Assessment, 6(4), pp. 284-290. https://doi.org/10.1037/1040-3590.6.4.284 [ Links ]
CONNELLY, L.M. 2008. Pilot studies. Medsurg Nursing, 17(6), pp. 411-412. [ Links ]
CONTESSE, M., VAN VLIET, B. & LENHART, J. 2017. Is urban agriculture urban green space? A comparison of policy arrangements for urban green space and urban agriculture in Santiago de Chile. Land Use Policy, 71, pp. 566-577. doi.org/10.1016/j.landusepol.2017.11.006 [ Links ]
DAWADI, S., SHRESTHA, S. & GIRI, R. 2021. Mixed-methods research: A discussion on its types, challenges, and criticisms. Journal of Practical Studies in Education, 2(2), pp. 25-36. https://doi.org/10.46809/jpse.v2i2.20 [ Links ]
DZIFA, A.P. & YAW, A.B. 2021. Exploring the impacts of urban expansion on green space availability and delivery of ecosystem services in the Accra metropolis. Environmental Challenges, 5, article 100283, pp. 1-16. doi.org/10.1016/j.envc.2021.100283 [ Links ]
EKONG, D.E. 2021. Physical planning administration and opportunities for private planning practice in Nigeria. AKSU Journal of Administration and Corporate Governance, 1(3), pp. 47-54. [ Links ]
FIENE, R. 2016. Theory of regulatory compliance (October 1, 2016). [Online]. Available at: <https://ssrn.com/abstract=3239691> [Accessed: 12 October 2021]. [ Links ]
FINCHAM, J.E. 2008. Response rates and responsiveness for surveys, standards, and the Journal. American Journal of Pharmaceutical Education, 72(2), pp. 43-83. https://doi.org/10.5688/aj720243 [ Links ]
FISCHEL, W.A. 2000. Zoning and land use regulation. Encyclopedia of Law and Economics, 2, pp. 403-423. [ Links ]
GIRMA, Y., TEREFE., H., PAULEIT, S. & KINDU, M. 2018. Urban green space supply in rapidly urbanizing countries: The case of Sebeta Town, Ethiopia. Remote Sensing Applications: Society and Environment, 13, pp. 138-149. https://doi.org/10.1016/j.rsase.2018.10.019 [ Links ]
GORO, B. & MWASI, B. 2017. Determining per capita value of urban green space provision: A case of Eldoret Town, Kenya. African Environmental Review Journal, 2(2), pp. 12-21. [ Links ]
GRILO, F., PINHO, P., ALEIXO, C., CATITA, C., SILVA, P. & LOPES, N. 2020. Using green to cool the grey: Modelling the cooling effect of green spaces with a high spatial resolution. Science of the Total Environment, 724, article number 138182, pp. 1-10. https://doi.org/10.1016/j.scitotenv.2020.138182 [ Links ]
HAALAND, C. & VAN DEN BOSCH, C.K. 2015. Challenges and strategies for urban green-space planning in cities undergoing densification: A review. Urban Forestry & Urban Greening, 14(4), pp. 760-771. https://doi.org/10.1016/j.ufug.2015.07.009 [ Links ]
HANTKE-DOMAS, M. 2003. The public interest theory of regulation: Non-existence or misinterpretation? European Journal of Law and Economics, 15(2), pp. 165-194. https://doi.org/10.1023/A:1021814416688 [ Links ]
HEALE, R. & ALISON, T. 2018. What is a case study? Evidence Based Nursing, 21(1), pp. 7-8. https://doi.org/10.1136/eb-2017-102845 [ Links ]
HEDBLOM, M., GUNNARSSON, B. & IRAVANI, B. 2019. Reduction of physiological stress of urban green space in a multisensory virtual experiment. Scientific Reports, 9, article number 10113. https://doi.org/10.1038/s41598-019-46099-7 [ Links ]
HERNANDEZ, J.G.V., KARINA, P. & PATRICIA, H. 2018. Urban green spaces as a component of an ecosystem functions, services, users, community involvement, initiatives, and actions. International Journal of Environmental Sciences & Natural Resources, 8(1), pp. 24-39. [ Links ]
HUANG, D., SHOUJUE, X., JINGQI, S., SULING, L., WEI, S. & ZHENHUA, W. 2017. An accuracy assessment model for classification result of remote sensing image based on spatial sampling. Journal of Applied Remote Sensing, 11(4), article number 046023. doi.org/10.1117/1.JRS.11.046023 [ Links ]
JENNINGS, V. & BAMKOLE, O. 2019. The relationship between social cohesion and urban green space: An avenue for health promotion. International Journal of Environmental Research and Public Health, 16, article number 452. doi.org/10.3390/ijerph16030452 [ Links ]
JIM, C.Y. & CHEN, S.S. 2003. Comprehensive green space planning based on landscape ecological principles in the compact Nanjing City, China. Landscape and Urban Planning 65(3), pp. 95-116. https://doi.org/10.1016/S0169-2046(02)00244-X [ Links ]
JULFIKAR, A., MOHIDUR, R. & IQBAL, H. 2022. Urban green spaces for elderly human health: A planning model for healthy city living. Land Use Policy, 114, article 105970. doi.org/10.1016/j.landusepol.2021.105970 [ Links ]
KAPLAN, G. 2018. Evaluating the roles of green and built-up areas in reducing a surface urban heat island using remote sensing data. Urbane Izziv, 30(2), pp. 105-112. https://doi.org/10.5379/urbani-izziv-en-2019-30-02-004 [ Links ]
KIPLAGAT, A.K., KOECH, J.K., MERCY, J., LAGAT, J., KHAZENZI, A. & ODHIAMBO, K.O. 2022. Urban green space characteristics, visitation patterns and influence of visitors' socio-economic attributes on visitation in Kisumu City and Eldoret Municipality, Kenya. Trees, Forests and People, 7, article 100175, pp. 1-9. https://doi.org/10.1016/j.tfp.2021.100175 [ Links ]
KOMAROV, S.I., ANTROPOV, D.V., VARLAMOV, A.A., GALCHENKO, S.A. & ZHDANOVA, R.V. 2019. Zoning as a tool of land management. IOP Conference Series: Earth and Environmental Science, vol. 350. International Symposium on Earth Sciences: History, Contemporary Issues and Prospects, 28 March, Moscow, Russian Federation, article number 012060. DOI: 10.1088/1755-1315/350/1/012060 [ Links ]
KREJCIE, R.V. & MORGAN, D.W. 1970. Determining sample size for research activities. Educational and Psychological Measurement, 30(3), pp. 607-610. doi.org/10.1177/001316447003000308 [ Links ]
KRZYZANIAK, M., DARIUSZ, S., MAGDALENA, S. & URBANSKI, P. 2015 Changes in the area of urban green space in cities of western Poland. Bulletin of Geography. Socioeconomic Series, 39(39), pp. 65-77. DOI: 10.2478/bog-2018-0005 [ Links ]
LEE, A., JORDAN, H. & HORSLEY, J. 2015. The value of urban green spaces in promoting healthy living and wellbeing: Prospects for planning. Risk Management Health Policy, 8, pp. 131-137. doi.org/10.2147/RMHP.S61654 [ Links ]
LIL, L. & PUSSELLA, P. 2017. Is Colombo City, Sri Lanka, secured for urban green space standards? Applied Ecology and Environmental Research, 15(3), pp. 1798-1799. https://doi.org/10.15666/aeer/1503_17891799 [ Links ]
LIN, B., MEYERS, J. & BARNETT, G. 2015. Understanding the potential loss and inequities of green space distribution with urban densification. Urban Forestry & Urban Greening, 14(4), pp. 952-958. https://doi.org/10.1016/j.ufug.2015.09.003 [ Links ]
MAKWORO, M. & MIRERI, C. 2011. Public open spaces in Nairobi City, Kenya, under threat. Journal of Environmental Planning and Management, 54(8), pp. 1107-1123. https://doi.org/10.1080/09640568.2010.549631 [ Links ]
MALARVIZHI, K., KUMAR, S., VASANTHA, P. & ORCHELVAN, P. 2016. Use of high-resolution Google Earth satellite imagery in land use map preparation for urban related applications. Procedia Technology, 24, pp. 1835-1842. https://doi.org/10.1016/j.protcy.2016.05.231 [ Links ]
MEHMET, C. 2015. Using GIS analysis to assess urban green space in terms of accessibility: Case study in Kutahya. International Journal of Sustainable Development & World Ecology, 22(5), pp. 420-424. [ Links ]
MINISTRY OF LANDS & SETTLEMENT. 1972. Kisii town physical development plan. Nairobi: Ministry of Lands and Settlement. [ Links ]
MUNYATI, C. & DRUMMOND, J.H. 2020. Loss of urban green spaces in Mafikeng, South Africa. World Development Perspectives, 19(20). DOI: 10.1016/j.wdp.2020.100226 [ Links ]
MWANGI, W.M. 2019. An assessment to the challenges facing urban green spaces: A case of City Park in Nairobi. International Journal of Scientific and Research Publications, 9(7), pp. 159-165. https://doi.org/10.29322/JJSRP.9.07.2019.p9121 [ Links ]
NERO, B.F. 2017. Urban green space dynamics and socio-environmental inequity: Multi-resolution and spatiotemporal data analysis of Kumasi, Ghana. International Journal of Remote Sensing, 38(23), pp. 6993-7020. https://doi.org/10.1080/01431161.2017.1370152 [ Links ]
NYANG'AU, J.O., MOHAMED, J.H., MANGO, N., MAKATE, C. & WANGECI, A.N. 2021. Smallholder farmers' perception of climate change and adoption of climate smart agricultural practices in Masaba South Sub-county, Kisii, Kenya. Hellion, 7(4), e06789. doi.org/10.1016/j.heliyon.2021.e06789 [ Links ]
ODINDI, J.O. & MHANGARA, P. 2012. Green spaces trends in the city of Port Elizabeth from 1990 to 2000 using remote sensing. International Journal of Environmental Research, 6(3), pp. 653-662. [ Links ]
OKECH, E.A. & NYADERA, I.N. 2022. Urban green spaces in the wake of COVID-19 pandemic: Reflections from Nairobi, Kenya. GeoJournal, 87, pp. 4931-4945. doi.org/10.1007/s10708-021-10540-0 [ Links ]
OLAD, G.P. & MONAVARI, S.M. 2013. Physical development trend and green space destruction in developing cities: A GIS approach. Environment, Development and Sustainability, 15(1), pp. 167-175. https://doi.org/10.1007/s10668-012-9381-5 [ Links ]
OLUJIMI, J.A.B. 1993. The administration of physical planning in Nigeria: The Ondo State experience. Landscape and Urban Planning, 25(1-2), pp.115-126. https://doi.org/10.1016/0169-2046(93)90127-Y [ Links ]
OMOLLO, W.O. 2018. Conformity assessment to development plan implementation as a tool for development control in Kisii Town, Kenya. South African Journal of Geomatics, 7(3), pp. 331-344. DOI: http://dx.doi.org/10.4314/sajg.v7i3.10 [ Links ]
OMOLLO, W.O. 2022. Planning implication of universities growth on land use: Confirmatory evidence from GIS spatial analysis. International Journal of Human Capital in Urban Management, 7(2), pp. 183-204. DOI: 10.22034/IJHCUM.2022.02.04 [ Links ]
OTUBU, A.K. 2012. Conceptualizing zoning within the Lagos mega city project: A prognosis. Journal of Environment and Earth Science, 2(2), pp. 36-44. http://dx.doi.org/10.2139/ssrn.1439742. [ Links ]
OTUNGA, C., ODINDI, J. & MUTANGA, O. 2014. Land use land cover change in the fringe of eThekwini Municipality: Implications for urban green spaces using remote sensing. South African Journal of Geomatics, 3(2), pp. 145-162. DOI: 10.4314/sajg.v3i2.3 [ Links ]
OWEI, O.B., OBINA, V.C. & PRECIOUS, N.E. 2010. The challenges of sustainable land use planning in Nigerian cities. In: Proceedings of the 46th ISOCARP Congress, Nairobi, Kenya, 19-23 September, pp. 1-10. https://www.isocarp.net/data/case_studies/1740.pdf [ Links ]
OWINO, F.O., HAYOMBE, P.O. & AGONG', S.G. 2017. The effect of diminishing urban green spaces on environmental quality in Kisumu City. International Journal of Geography and Regional Planning Research, 2(1), pp. 10-23. [ Links ]
OWOLABI, B.O. 2019. Assessment of physical planning administration in Nigeria. Environmental Analysis and Ecology Studies, 5(1), pp. 451-470. https://doi.org/10.31031/EAES.2019.05.000602 [ Links ]
PETERSEN, E., SCHOEN, G., LIEDTKE, G. & ZECH, A. 2018. Relevance of urban green space for physical activity and health-related quality of life in older adults. Quality in Ageing and Older Adults, 19(3), pp. 158-166. https://doi.org/10.1108/QAOA-01-2018-0002 [ Links ]
PUTRA, I.G.N.E., ASTELL-BURT, T., CLIFF, D.P., VELLA, S.A. & FENG, X. 2021. Do physical activity, social interaction, and mental health mediate the association between green space quality and child prosocial behavior? Urban Forestry & Urban Greening, 64, article number 127264. https://doi.org/10.1016/j.ufug.2021.127264 [ Links ]
QURESHI, S., SYED, J.H.K. & BREUSTE, J.H. 2010. Ecological disturbances due to high cutback in the green infrastructure of Karachi: Analyses of public perception about associated health problems. Urban Forestry & Urban Greening, 93, pp. 187-198. https://doi.org/10.1016/j.ufug.2009.08.003 [ Links ]
ROTHWELL, J. & MASSEY, D.S. 2009. The effect of density zoning on racial segregation in U.S. urban areas. Urban Affairs Review, 44(6), pp. 779-806. https://doi.org/10.1177/1078087409334163 [ Links ]
SCHIPPERIJN, J., BENTSEN, P., TROELSEN, J., TOFTAGER, M. & STIGSDOTTER, U.K. 2013. Associations between physical activity and characteristics of urban green space. Urban Forestry & Urban Greening, 12(1), pp. 109-116. https://doi.org/10.1016/j.ufug.2012.12.002 [ Links ]
SERKIN, C.A. 2020. Case for zoning. Notre Dame Law Review, 96(2), pp. 749-798. [ Links ]
SINGH, K.K. 2018. Urban green space availability in Bathinda City, India. Environmental Monitoring and Assessment, 190, article number 671. https://doi.org/10.1007/s10661-018-7053-0 [ Links ]
SOUTHON, G.E., JORGENSEN, A., DUNNETT, N., HOYLE, H. & EVANS, K.L. 2018. Perceived species-richness in urban green spaces: Cues, accuracy, and well-being impacts. Landscape and Urban Planning, 172, pp. 1-10. https://doi.org/10.1016/j.landurbplan.2017.12.002 [ Links ]
SUDIPTO, R., JASON, B. & CATHERINE, P. 2012. A systematic quantitative review of urban tree benefits, costs, and assessment methods across cities in different climatic zones. Urban Forestry & Urban Greening, 11(4), pp. 351-363. https://doi.org/10.1016/j.ufug.2012.06.006 [ Links ]
SUGIYAMA, T., CARVER, A., KOOHSARI, M.J. & VEITCH, J. 2018. Advantages of public green spaces in enhancing population health. Landscape and Urban Planning, 178, pp. 12-17. https://doi.org/10.1016/j.landurbplan.2018.05.019 [ Links ]
THE REPUBLIC OF KENYA. 1968. The Local Government (Adoptive By-Laws) (Building) Order 1968 and The Local Government (Adopting By-Laws) (Grade II Building) Order 1968. [Online]. Available at: <https://eregulations.invest.go.ke/media/BUILDING%20CODE.pdf.> [Accessed: 25 July 2022]. [ Links ]
THE REPUBLIC OF KENYA.1996. Physical Planning Act. [Online]. Available at: <http://kenyalaw.org/kl/fileadmin/pdfdownloads/Acts/PhysicalPlanningAct_Cap286.pdf.> [Accessed: 25 July 2022]. [ Links ]
THE REPUBLIC OF KENYA. 2006. Environmental Management and Co-Ordination (Water Quality) Regulations. [Online]. Available at: <https://www.nema.go.ke/images/Docs/water/water_quality_regulations.pdf.> [Accessed: 25 July 2022]. [ Links ]
THE REPUBLIC OF KENYA. 2007. Physical planning handbook. [Online]. Available at: https://aak.or.ke/download/physical-planning-handbook-draft-2002/ [Accessed: 14 July 2022]. [ Links ]
THE REPUBLIC OF KENYA. 2012. Architects and Quantity Surveyors Act. [Online]. Available at: bit.ly/3p22bZt [Accessed: 8 October 2022]. [ Links ]
THE REPUBLIC OF KENYA. 2019. Physical and Land Use Planning Act. [Online]. Available at: https://lands.go.ke/wp-content/uploads/2021/09/16-physical-and-land-use-planning-building-regulation-2021.pdf [Accessed: 8 October 2022]. https://doi.org/10.17148/JJARCCE.2019.8903 [ Links ]
THE REPUBLIC OF UGANDA. 2011. National Physical Planning Standards and Guidelines. [Online]. Available at: <bit.ly/3J7yUn2> [Accessed: 11 September 2022]. [ Links ]
THOMPSON, S.K. 2012. Sampling. 3rd edition. Hoboken, New Jersey: Wiley. https://doi.org/10.1002/9781118162934 [ Links ]
TWUMASI, Y., MEREM, E., NAMWAMBA, J., MWAKIMI, O., AYALA-SILVA, T. & ABDOLLAHI, K. 2020. Degradation of urban green spaces in Lagos, Nigeria: Evidence from satellite and demographic data. Advances in Remote Sensing, 9, pp. 33-52. DOI: 10.4236/Ars. 2020.91003 [ Links ]
UGONI, A. & WALKER, B.F. 2005. The chi-square test: An introduction. COMSIG Review, 4(3), pp. 61-64. [ Links ]
UN-HABITAT. 2019. Kisii strategic urban development Plan (Kisii -SUDP), Nairobi: UNHABITAT. [ Links ]
UNITED NATIONS. 2022. The SDG in action. [Online]. Available at: <https://www.undp.org/sustainable-development-goals.> [Accessed: 27 July 2022]. [ Links ]
VILAGUT, G. 2014. Test-retest reliability. In: Michalos, A.C. (Eds). Encyclopedia of quality of life and well-being research. Springer, Dordrecht, pp. 6622-6625. https://doi.org/10.1007/978-94-007-0753-5_3001 [ Links ]
VÏLCEA, C. & SOSEA, C. 2020. A GIS-based analysis of the urban green space accessibility in Craiova city, Romania. Geografisk Tidsskrift-Danish, Journal of Geography, 120(1), pp. 19-34. https://doi.org/10.1080/00167223.2020.1766365 [ Links ]
WAN, C., SHEN, G.Q. & CHOI, S. 2021. Underlying relationships between public urban green spaces and social cohesion: A systematic literature review. City, Culture and Society, 24 article number 100383. https://doi.org/10.1016/j.ccs.2021.100383 [ Links ]
WHO (WORLD HEALTH ORGANIZATION). 2016. Urban green spaces and health: A review of evidence. [Online]. Available at: <bit.ly/3CoFMIX> [Accessed: 11 June 2022]. [ Links ]
WÜSTEMANN, H., KALISCH, D. & KOLBE, J. 2017. Access to urban green space and environmental inequalities in Germany. Landscape and Urban Planning, 164, pp. 124-131. https://doi.org/10.1016/j.landurbplan.2017.04.002 [ Links ]
XIAO, X.D., DONG, L., YAN, H., YANG, N. & XIONG, Y. 2018. The influence of the spatial characteristics of urban green space on the urban heat island effect in Suzhou Industrial Park. Sustainable Cities and Society, 40, pp. 428-439 https://doi.org/10.1016/j.scs.2018.04.002 [ Links ]
XU, X., DUAN, X., SUN, H. & SUN, Q. 2011. Green space changes and planning in the capital region of China. Environmental Management, 47(3), pp. 456-467. https://doi.org/10.1007/s00267-011-9626-3 [ Links ]
YAN, L., JIA, W. & ZHAO, S. 2021. The cooling effect of urban green spaces in megacities: A case study of Beijing, China's capital. Remote Sensing, 13(22), article number, 4601, pp. 2-16. https://doi.org/10.3390/rs13224601 [ Links ]
YIYI, H., TAO, l., GUOQIN, H., YONGGUAN, Z., ZHIWEI, Z. & HONG, Y. 2021. Spatial patterns of urban green space and its actual utilization status in China based on big data analysis. Big Earth Data, 5(3), pp. 391-409. https://doi.org/10.1080/20964471.2021.1939990 [ Links ]
YOSHIDA, T., YOSHIKI, Y., SOOWON, C., DE GOOYERT, V., HAJIME, S. & DAISUKE, M. et al. 2020. Spatial modeling and design of smart communities. In: Yamagata, Y. & Yang, P. (Eds). Urban systems design. Creating sustainable smart cities in the internet of things era. Amsterdam: Elsevier, pp. 199-255. https://doi.org/10.1016/B978-0-12-816055-8.00007-5 [ Links ]
YULIN, D., ZHIBIN, R., YAO, F., NANLIN, H., YUJIE, G. & GUANGLIANG, J. et al. 2022. Decrease in the residents' access to summer cooling services due to green space loss in Chinese cities. Environment International, 158, article number 107002. https://doi.org/10.1016/j.envint.2021.107002 [ Links ]
Received: December 2022
Peer reviewed and revised: January 2023
Published: June 2023
* The author(s) declared no potential conflicts of interest with respect to the research, authorship, and/or publication of this article

