


Serviços Personalizados
Artigo
 Inglês (pdf)
 Artigo em XML
 Referências do artigo
Indicadores

Links relacionados
-
 Citado por Google
 -
 Similares em Google
Compartilhar

 Permalink
Town and Regional Planning
versão On-line ISSN 2415-0495
versão impressa ISSN 1012-280X
Town reg. plan. (Online) vol.81 Bloemfontein 2022
http://dx.doi.org/10.18820/2415-0495/trp81i1.8
RESEARCH ARTICLE
Modelling resilience to extreme climate events: A household-based study of flood disaster in Nigeria
Modellering van veerkragtigheid teen uiterste klimaatgebeure: 'n huishoudinggebaseerde studie van vloedramp in Nigerië
Mohlala oa ho tiisetsa kapa ho mamella ketsahalo e feteletseng ea phetoho ea boemo ba leholimo: thuto e thehiloeng malapeng ka koluoa ea likhohola Nigeria
Oluwafemi OdunsiI; Margaret OnanugaII
IDepartment of Urban and Regional Planning, Olabisi Onabanjo University, Ago-Iwoye, Nigeria. Phone: +234(0)8068806305, email: odunsioluwafemi@gmail.com, ORCID: https://orcid.org/0000-0002-6127-0835. Corresponding author
IIDepartment of Geography and Environmental Management, Tai Solarin University of Education, Ijagun, Ijebu-Ode, Nigeria. Phone: +234(0)7031222375, email: nugamaggie@gmail.com, ORCID: https://orcid.org/0000-0002-6041-3435
ABSTRACT
This article examines the relationship between households' flood resilience and predictors of their resilience in Nigeria, with a view to improving their flood risk management capacities. This study utilises a quantitative research design whereby a cross-sectional survey method is used to randomly select 512 households for questionnaire administration through a multistage sampling procedure. Data was analysed using Structural Equation Modelling (SEM). The study shows that environmental (β1 = 0.197, p < 0.05), institutional (β2 = 0.180, p < 0.05), and socio-economic (β3 = 0.529, p < 0.05) factors have statistically significant positive effects on household flood resilience, while the behavioural (β4 = -0.035, p < 0.05) factor has a negative effect. The highest predictor of households' resilience to flood disaster is the socio-economic factor. The implication is that low socio-economic status indicates a high level of poverty that worsens households' flood resilience. This suggests that the poor do not have the needed economic resources and social nets to prevent, adapt to, and/or transform from the impact of flood disaster.
Keywords: Climate adaptation, flood adaptation, flood resilience, socio-economic resilience, natural disaster
OPSOMMING
Hierdie artikel ondersoek die verband tussen huishoudings se vloedveerkragtigheid en voorspellers van hul veerkragtigheid in Nigerië met die oog daarop om hul vloedrisikobestuurvermoëns te verbeter. Hierdie studie gebruik 'n kwantitatiewe navorsingsontwerp waardeur 'n deursnee-opnamemetode gebruik word om 512 huishoudings ewekansig te selekteer vir vraelysadministrasie deur 'n multistadium-steekproefprosedure. Data is ontleed deur gebruik te maak van Structural Equation Modelling (SEM). Die studie toon dat omgewings- (β1 = 0.197, p < 0.05), institusionele (β2 = 0.180, p < 0.05) en sosio-ekonomiese (β3 = 0.529, p < 0.05) faktore statisties beduidende positiewe uitwerking op huishoudelike vloedveerkragtigheid het (β4 = -0.035, p < 0.05), terwyl die gedrag-faktor 'n negatiewe effek het. Die sterkste voorspeller van huishoudings se veerkragtigheid teen vloedrampe is die sosio-ekonomiese faktor. Die implikasie is dat lae sosio-ekonomiese status 'n hoë vlak van armoede aandui wat huishoudings se vloedbestandheid vererger. Dit dui daarop dat die armes nie die nodige ekonomiese hulpbronne en sosiale nette het om die impak van vloedrampe te voorkom, aan te pas by en/of te transformeer nie.
Liphuputso tse fapa-fapaneng li rarollotse mathata a ho mamella likhohola ha hona le khaello ea tlhahisoleseling pele ho likhohola, le tlatsetso maemong a lelapa. Ka hona boithuto bona bo fana ka mohlala oa ho bolela esale pele hore malapa a tla khona ho mamella likoluoa tsa likhohola. Phuputso ena e sebelisitse moralo oa lipatlisiso tsa bongata. Ho ile ha sebelisoa mokhoa oa tlhahlobo ea likarolo tse fapaneng ho khetha malapa a 512 ka mokhoa o sa reroang bakeng sa tsamaiso ea lipotso ka ho etsa mehlala e mengata. Lintlha li ile tsa hlahlojoa ho sebelisoa Structural Equation Modeling (SEM). Phuputso e bontsitse hore maemo a tikoloho (β1 = 0.197, p < 0.05), setsi (β2 = 0.180, p < 0.05) le a moruo (β3 = 0.529, p < 0.05) li bile le tshusumetso e ntle ka lipalo-palo ha li bapisoa le tiisetso ea likhohola tsa malapa (β4 = -0.035, p < 0.05) e bileng le tshusumetso e mpe. Ntho e ka sehloohong e bontsang hore malapa a tla khona ho mamella likoluoa tsa likhohola ke ntlha ea moruo oa sechaba. Se boleloang ke hore maemo a tlase a moruo oa kahisano a bontsa boemo bo phahameng ba bofuma bo mpefatsang matla a ho mamella likhohola. Sena se fana ka maikutlo a hore mafutsana ha a na lisebelisoa tse hlokahalang tsa moruo le marang-rang a sechaba ho thibela, ho ikamahanya kapa ho fetola tshusumetso ea koluoa ea likhohola.
1. INTRODUCTION
Extreme climate events are subsequent effects of global warming and climate change resulting from natural processes, which are exacerbated by urbanisation and anthropogenic activities (Diaz & Murnane, 2008; IPCC, 2012; Olajuyigbe, Rotowa & Durojaye, 2012: 367; Hofmann & Schuttrunpf, 2019: 1; Andersen & Sherperd, 2013: 95). High temperature and heat often cause droughts and heatwaves, while too much rainfall, accompanied sometimes by storms, causes severe floods and landslides. Considering the meteorological and hydrological events, there are issues related to flood disaster. Evident in the developed world were the 'Autumn 2000 Europe floods' that affected many countries such as the United Kingdom (UK), Norway, Spain, Italy, Ireland, and France, causing thousands of human deaths and property loss (EA, 2000; Kundzewicz, 2005; Kundzewicz, Pinskwar & Brakenridge, 2012; Hannaford, 2015; Miller & Hutchins, 2017; Hofmann & Schuttrunpf, 2019: 1-3). Similarly, the 2018 flood caused the death of 31 persons across Europe (one person in Italy, three in the UK, 12 in Spain, and 15 in France) (Hofmann & Schuttrunpf, 2019: 2).
Flood events are also evident in developing countries, with varying magnitude of impact (Msengana-Ndlela, 2008; UN, 2009; Portfolio Committee on Cooperative Governance and Traditional Affairs, 2011; Zuma et al., 2012: 127-128; Aich et al., 2014; EC, 2019). Drawing specifically on Nigeria, a number of cities have been affected by flood at different times (Adelekan, 2010; Nkwunonwo, 2016: 29-33; Adewara et al., 2018). The disastrous impact of flood in most of these cities is also aggravated by the initial problems of poor residential environments, that are characterised by ruined buildings and failed infrastructure, primarily due to government neglect of, or poor interest in urban planning (Adelekan, 2010; Ibem, 2011). Meanwhile, the interventions in these cities, when faced with flood disaster, have likewise been limited to the disaster response phase (reactive), where the function of government disaster management agencies primarily focused on rescuing victims and distributing relief materials (Fagbemi, 2011; Adeoti & Akintunde, 2014; Okunola, 2018). Most of the communities have, therefore, been unable to fully recover from the disruption of past occurrences, let alone facing imminent ones.
Based on the foregoing, it is a challenge for the Nigerian government to achieve the 11th and 13th Sustainable Development Goals (SDGs), which are sustainable cities and communities, and climate action, respectively (United Nations, 2018), that are directed at making cities a better place for people to live in. There is, therefore, the need for research efforts to provide information for the realisation of these goals, specifically the challenges of cities in Lagos State, by investigating the areas that have experienced flood disaster. Literature on flood disaster in Lagos State (Olaniran, 1983; Gelleh, Ibidun & Okeke, 2016; Nkwunonwo, 2016: 30-33; Adewara et al., 2018; Atufu & Holt, 2018; Olanrewaju et al., 2019) shows that increased flood disaster and impact do affect the resilience of cities, their people, and their environment. Achieving flood-resilient places thus requires strategies of which building flood-resilient people is vital. Although existing studies have addressed flood disaster and resilience issues, there is a dearth of information on the relationship between households' flood resilience and its predictors. This study, therefore, provides a model for predicting households' resilience to flood disaster in Nigeria and other developing countries with similar attributes.
2. LITERATURE REVIEW
To understand how to model resilience to extreme climate events for households, it is important to introduce the concepts 'household', 'resilience' and 'flood disaster' used in this article. The essence is to resolve the ambiguity and sometimes the misinterpretation of these concepts as used in this study.
2.1 Household
A household is a person or group of individuals related by blood, marriage, or adoption, usually dwelling together and feeding from a common kitchen or pot, except that they were unable to do so because of the exigencies of work (Government of India, 2001: 18). According to Wooden, Freidin and Watson (2002: 341-342), a household is an individual or groups of individuals who live and feed together under the same dwelling unit. Household, as described in the Rapid Household Survey (RHS) conducted in 2006, comprises members of a group who are usually living and eating their meals together in the same house, and who do acknowledge the authority of one of them as the head of the group (Republic of Mali, 2007). A household could be made up of one family, many families (such as an extended family), or a combination of families and unrelated people who could be lodgers (Willekens, 2010: 2). A household that comprises a group of people who share in providing food, shelter, and other necessities for living is also considered to be part of a home (United Nations, 2017: 1).
A household is classified into two sets, consisting of either an individual or a group (Nord, 2007; Dommaraju, 2015; OECD, 2016). An individual household has a single person living and feeding under a dwelling unit. On the other hand, a group household has a collection of persons living and feeding together under the same dwelling unit. This can be a group of people related by blood, headed by a man or woman and is thus referred to as a family household. According to Willekens (2010: 2), a family household is made up of spouses, parents, and children who are linked through marriage, blood, or adoption. As for the linking by marriage, it is often but not always about legally sanctioned marriage and common-law marriage (consensual union). Another is a group of people who are connected by social ties such as friendship, education, and workplace. In that scenario, a household refers to a group of individuals (social unit) who are linked through marriage, blood, or adoption, regardless of where they now reside (Willekens, 2010: 2). It should be noted that different socioeconomic variables apply to a household as an individual or group. For instance, if a household is merely an individual, the characteristics that apply to such an individual comprise gender, age, educational status, income, and occupation. On the other hand, if the household is viewed as a group, the characteristics that apply to such a group consist of income, occupation, and household size.
2.2 Resilience
The term 'resilience', from a psychological perspective, is defined as the process of, capacity for, or outcome of successful adaptation, despite challenging or threatening conditions (Masten, Best & Garmezy, 1990: 465-426). In business management, resilience means the ability of an organisation to endure environmental changes without having to adapt permanently or its ability to be compelled to adapt to new ways of doing business that better suit the new environmental conditions (McCarthy, Collard & Johnson, 2017: 33). From a scientific perspective, resilience is the property that a material exhibits when it has the ability to revert to its original position which is the initial state after experiencing external pressure (Rossi et al., 2012: 1-2). From an engineering perspective, resilience is the ability of an engineered system to autonomously detect, respond to, withstand, and recover from the adverse impacts of sudden failure events (Yodo & Wang, 2016:1-2). From a socio-ecological and environmental perspective, resilience was first presented by Holling (1973: 14) and is operationalised as a "measure of the persistence of systems and of their ability to absorb change and disruption and still maintain the same relationships between populations or state variables".
Adger (2000: 349-352) described resilience as the capacity or ability of individuals or groups (communities, states, nations, or regions) to cope with external shocks and stresses resulting from social, political, and environmental change. Recent definitions align with this definition, but with some modifications. From the perspective of Folke et al. (2002: 437), resilience is simply the "capacity to buffer change, learn, and develop". Walker & Salt (2006: 1) described resilience as "the ability of a system to absorb disturbances and still retain its basic function and structure". Resilience also means "the capacity to change in order to maintain the same identity" (Folke et al., 2010: 10). By conceptualisation, resilience has similar meanings across all the fields of study. It describes the ability of any system to face catastrophic adversities, endure the challenges, and recover from the negative experiences (Masten et al., 1990). In disaster management, resilience, therefore, denotes recovery and transformation capacities for any system, implying that it bounces back and bounces forward after being impacted negatively by disasters (Folke et al., 2002; Folke, 2006: 257-259; Walker et al., 2009).
The fundamental components of disasters, as described in many socio-environmental and disaster management studies comprise absorbability, adaptability, and transformability (Bene et al., 2012; Restemeyer, Woltjer & Van den Brink, 2015: 45-62; Fernandez, Mourato & Moreira, 2016). Absorbability implies that systems should have the capacity to buffer the impact of disturbance caused by disasters (Bene et al., 2012). Adaptability depicts the capacity for flexibility and incremental adjustment by systems to changing conditions, due to reoccurrence of disaster (Bower et al., 2016; Oxfam International, 2017). Transformability describes the capacity for a total system shift that makes it withstand the impact of disasters (Walker et al., 2006). Absorbability, adaptability, and transformability are based on short-, medium- and long-term recovery outcomes, respectively (Bene et al., 2012). On a general note, absorbability and adaptability components of resilience are viewed as coping strategies. They involve developing coping capacity with the available resources, skills, and opportunities that are used to combat adverse consequences that could cause disasters. Coping capacity, therefore, has to do with the conscious ability developed by individuals or communities in responding to expected or actual disasters, using available physical, social, economic, and financial resources. The coping capacity is characterised by social character, economic capital, infrastructure and planning, emergency services, community capital, as well as information and engagement.
2.3 Flood disaster
For the concept 'flood disaster', one needs to understand how flood becomes a disaster. Flood is "a general and temporary condition of partial or complete inundation of normally dry land areas from overflow of inland or tidal waters, or from the unusual and rapid accumulation or runoff of surface water from any source" (Mandych, 2010: 64). There are several classifications of flood in literature (Douben, 2006; Mandych, 2010; Bariweni, Tawari & Abowei, 2012; Maddox, 2014; Nath, 2014; US NOAA, 2016; Hundecha, Parajka & Viglione, 2017).
Bariweni et al. (2012) provided six general classes of flood, namely tidal, fluvial, flash, groundwater, pluvial, flooding from sewers, and flooding from man-made infrastructure. The US NOAA (2016) provided five classes, namely: flash, river, coastal, urban, and areal. Based on factors and conditions of flood generation, the classification by Maddox (2014) evolved three types, namely pluvial (surface), fluvial (river), and coastal (surge) floods.
Flood in itself is a hazard, because it deals with the possible or potential occurrence of harm, injury, damage, or destruction. It becomes a disaster when an actual occurrence of the flood causes deaths and damage to property such as land, buildings, vehicles, farmlands, investments, as well as critical infrastructure including electricity, water supply, and bridges, with local and national coverage (Sidi, 2012; Ikhuoria et al., 2012). In other words, a flood hazard becomes a flood disaster when damages have occurred, that is, flood in its dormant stage has become active. By international standards, flood as a disaster must answer to any of the four criteria provided by the Center for Research on the Epidemiology of Disasters (CRED, 2011: 8-10), namely ten or more human deaths; 100 affected persons; declaration of a state of emergency, or a call for international assistance. It is, therefore, established that, beyond the potential of causing harm, when the harm is evident, then a flood hazard becomes a flood disaster. This kind of situation is attended by death or displacement of people, socio-economic losses, property losses, and infrastructure damage (Ibem, 2011). Flood disaster is, therefore, an occurrence that results from disruption of the normal course of life by flood in affected areas, thereby causing harm or danger to individual and public lives in the form of death, infections, diseases, or severe injuries (Tapsell, 2001; Ikhuoria et al., 2012).
2.4 Disaster resilience
The global climate action advocates eliminating or reducing the impact of extreme climate events, by seeking solutions beyond mitigations and/or controls of associated impact. This suggests a paradigm shift from disaster prevention, preparedness, and response strategies to a more inclusive recovery strategy of which building and/or strengthening resilience is very germane. To achieve this requires the understanding of what constitutes and determines resilience. Focusing on flood issues, this study draws on existing literature to conceive resilience as a multi-dimensional construct based on absorptive, adaptive, and transformative capacities. This translates to considering how people absorb, adapt to, and transform from scenarios of vulnerability to flood that is common in developing countries such as Nigeria. This study was conducted at a local level, by involving households, being the smallest unit of the society, to then understand what is obtainable as flood resilience at this lowest level.
This study also constructed factors (attributes that could not be directly observed) through observable drivers of flood resilience from literature to determine the challenges facing households regarding their resilience to flood disaster. A number of studies (g, 2010; 2016; Zuma et al., 2012: 127-128; Enwemeka, 2014; Viverita et al., 2014; Batica & Gourbesville, 2012; Birkmann et al., 2016; Damingo, 2017; Ojolowo & Wahab, 2017; Platt, 2017: 26-27; Zurich Insurance Group, 2017; Serre et al., 2018; Olanrewaju et al., 2019) have identified the drivers of resilience to disasters. The socio-economic drivers include gender, age, income, occupation, educational level, religion, and ethnicity. The behavioural drivers include responses to early warning signs, building on waterfronts, and blockage of water channels, among others. The environmental drivers include lack of, or inadequate environmental amenities and green infrastructure such as green areas. The institutional drivers include poor practices of private and government disaster management institutions.
In summary, resilience is discussed as a multidimensional construct that is based on absorptive, adaptive, and transformative capacities that are applied in determining flood resilience. The drivers of households' resilience were discussed to indicate the identifiable observed variables. Although these drivers of resilience were derived from literature on different types of disasters, it is proposed that combining all in a study reveals what determines the resilience of households, while considering a single disaster as flood. Flood resilience, therefore, formed the dependent variable. The independent variables are latent variables (factors) structured around identifiable observed socio-economic, behavioural, environmental, and institutional variables.
3. STUDY AREA
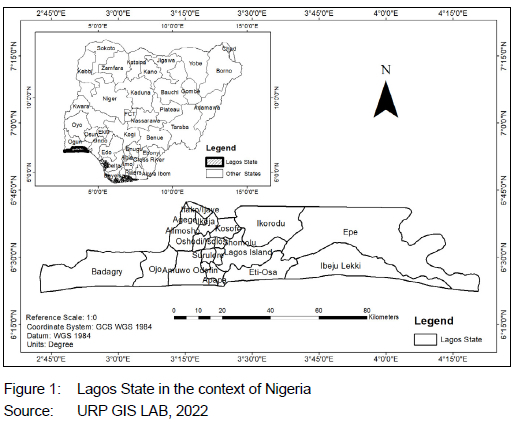
The study area was Lagos State, which lies between latitude 60 22' N and 60 52' N, longitude 20 42' E and 30 42' E. The State is located in the south-western geopolitical zone of Nigeria and is at present one of the thirty-six States in the country (Figure 1). It is bounded by Ogun State in the North and East; the Republic of Benin in the West (international boundary), and roughly 180 km of Atlantic coastline in the South. The State has an approximate land area of 3,577 square kilometres which is 0.4% of the entire land area of Nigeria, making it the smallest State in the country (Lagos State Government, 2014). Lagos State lies 4.5 m above sea level, with 22% of its land area covered by water (Lagos State Government, 2014). The study was conducted in the State because it has experienced floods over the years, due to natural and man-made causes (Olajuyigbe, Rotowa, & Durojaye, 2012). The natural cause is due to the geographical nature of Lagos State, which is located on low-lying land comprising of ocean, seas, lagoons, creeks, and rivers, as the low-lying areas and wetlands occupy 78% of the entire land mass of the State. The manmade cause pertains to increasing urbanisation in the State. The high population and resulting human activities have caused significant impacts such as land use/land cover change, pollution and climate change with dysfunctional effects on the ecosystem. The combined effects of natural forces due to the presence of water bodies and urbanisation processes make the State susceptible to pluvial (surface), fluvial (river) and coastal (surge) floods (Nkwunonwo, 2016: 29-33).
4. METHODS
4.1 Research design
This study used the quantitative research design to statistically model the relationship between households' resilience to flood and factors influencing their resilience. This kind of design deals with dimensionality and quantity evaluations, while requiring quantitative variables to produce numerical data for statistical analysis (Almalki, 2016: 290-291; Apuke, 2017: 41-43). Quantitative research also allows for descriptive and inferential analysis of the data. In this study, a structured questionnaire survey was done that allowed the researchers to generalise their findings from the sample population (Creswell, 2014). Measured results from the questionnaire were set as the variables of factors influencing household flood resilience in Nigeria. Exploratory factor analysis (EFA) was used to reduce these measured variables to a smaller set of factors influencing household flood resilience (Rossoni, Engelbert & Bellegard, 2016: 201). Correlation on the variables from the EFA was done to test for any significant impact that might show between the variables in predicting the households' resilience to flood disaster.
4.2 Population, sample and response rate
The study population comprised the households living in flood-risk areas of Lagos State, Nigeria. An alternative to population census data is to estimate the study population based on the number of housing units as described in several urban planning studies in the Nigerian literature (Daramola, Odunsi & Olowoporoku, 2017: 17; Salisu et al., 2019: 185; Olowoporoku, Daramola & Odunsi, 2021: 2-3; Dada, 2021: 1648-1649). Hence, a multistage sampling procedure comprising the purposive, simple random and systematic sampling techniques was utilised in this study. In the first phase, in determining the flood-risk areas in Lagos State, the local government areas (LGAs) were purposively selected, based on their different flood exposure and magnitude based on historical evidence (Nkwunonwo, 2016: 30-33). These LGAs were Alimosho, Agege, Ikeja, Kosofe, Apapa and Lagos Island (Table 1). In the second phase, 74 streets were selected from the 1,403 flood-risk streets in all the selected LGAs, using a table of random numbers as utilised in Wahab et al. (2014) and Wahab and Ojolowo (2018) for flood impact study.
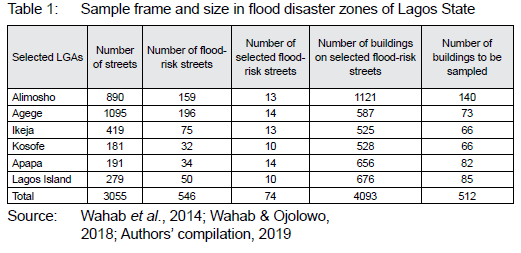
Subsequently, in the third phase, 512 buildings were selected out of 4,093 buildings that were located on the 74 flood-risk streets by choosing one out of every eight buildings (12.5%) on each street. The sample size for this study, therefore, comprised 512 household heads as one household was chosen from each building from which the household head constituted the respondents for the questionnaire administration with a response rate of 100% during data collection. Krejcie and Morgan's (1970: 608) sample size table recommends that a sample size for a population of 4,000 is 274. This recommendation validates the sample size of 512 as excellent for the building population of 4,093 (see Table 1).
4.3 Data collection
The survey questionnaire was administered between April and September 2019 to 512 household heads in the selected LGAs. Based on the literature review, the questionnaire was designed to capture data using variables that were structured as scaled items. To reduce the respondents' bias, closed-ended questions (scale items) were preferred for the survey (Harlacher, 2016: 9-10). An agreement scale was developed in the questionnaire which is the Factors Influencing Households' Resilience to Flood Disaster Scale (FIRFDS). All items on the scales are on an ordinal level of measurement and followed a five-point Likert scale of strongly disagree, disagree, just agree, agree, and strongly agree, with designated values of 1, 2, 3, 4, and 5, respectively. To validate the instrument, a reliability test was conducted using the Cronbach's Alpha and the validity tests were based on expert judgements and test and retest methods. After the administration of the questionnaire to households, a total of 512 questionnaires were retrieved for data analysis.
4.4 Data analysis and interpretation
The structural equation modelling (SEM) technique of the SPSS Version 20 software was used to analyse the data. The SEM is a combination of statistical techniques, namely correlation analysis, factor analysis, regression analysis, and analysis of variance (ANOVA) (Hoyle, 1995; Klem, 2000). This is similar to path analysis (PA) in design but different in that it deals with latent variables (factors) as against the PA that uses observed variables. For this study, the ordinal data collected were converted into ratio data. To achieve this, the designated values for the Likert points were used in allotting weights for standardisation into ratio scale where 1 = Strongly disagree (>1.00 to <1.49); 2 = Disagree (>1.50 to <2.49); 3 = Just Agree (>2.50 to <3.49); 4 = Agree (>3.50 to <4.49), and 5 = Strongly agree (>4.50 to <5.00). Further into the analysis, the data were first explored using descriptive statistics which are frequency distribution and absolute mean. Thereafter, the EFA was utilised. The EFA used in SPSS employs principal component analysis (PCA) as its extraction method and correlation (Pearson) as the analytical method. A fixed number of factors were ensured, based on the Varimax rotation method and twenty-five (25) were specified as the maximum iterations for convergence. This study adopted the assertion made by Hair et al. (2014) in selecting initial eigenvalues criterion of greater than 1.3 and factor loading of 0.5 to determine the maximum number of factors to retain in the model.
Furthermore, a stepwise multiple regression analysis was used to model households' flood resilience and its predictors based on two different regression equations for the unstandardised coefficients (i) and standardised coefficients (ii).
For the unstandardised coefficients (B) as
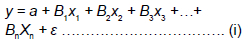
For the standardised coefficients (p), the regression equation is

Where:
a = Constant
y = Dependent variable
x1 xn = Independent variables
B1- Bn = Unstandardised regression coefficients
β1-βn = Standardised regression coefficients
£ = Error term.
The following null (Ho) and alternate (H1) hypotheses are considered and established, using the t-test and analysis of variance (ANOVA).
Ho: There is no statistically significant relationship exit between households' flood resilience and its predictors.
H1: There is a statistically significant relationship exit between households' flood resilience and its predictors.
To understand the results, it is important to note that the correlation analysis is an inferential statistic used in examining an association between variables and is denoted by coefficient of correlation (r). In interpreting the coefficient of correlation, it suffices to know that it measures a positive or negative linear association, alongside the strength (weak, moderate, and strong) of association and the statistical significance of the association (Field, 2005: 166-196). Factor analysis is a data-reduction statistics used for collapsing observable variables into their latent variables; it examines the linear relationship between a large set of observed variables and a smaller set of unobserved factors. Its results are interpreted using communalities, Eigenvalues and percentages of variance (Field, 2005: 627-685).
The regression analysis is an inferential statistic used to examine a causal relationship between variables. Its results are interpreted using the correlation coefficient (r), coefficient of determination (r2), and statistical significance (t-Test or F-Test) (Field, 2005: 197-263).
4.5 Limitations of the study
The data used for this study were collected prior to the emergence of the COVID-19 pandemic and the new normal might have a serious impact on households' flood resilience which might affect the outcomes of this study if replicated in the study area. In addition, the study was solely conducted in the flood-risk areas of Lagos State, Nigeria, and not the entire country. The findings, therefore, cannot be generalised for the entire country. Lastly, the unit of analysis for this study is household, hence the results cannot be generalised for other units such as neighbourhood and community.
5. RESULTS AND DISCUSSION OF FINDINGS
5.1 Ranking factors influencing household flood resilience
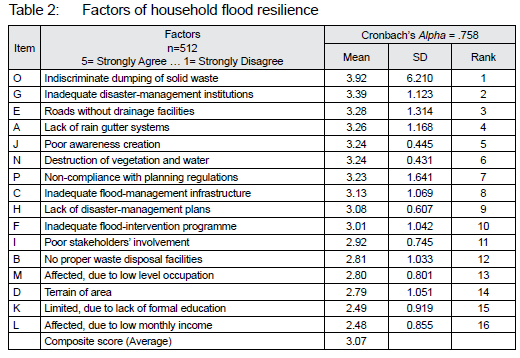
Descriptive analysis was done for the observed variables used for examining the factors that influence flood resilience in Lagos State. In Table 2, a composite score average of 3.07 shows that households are in agreement that all the 16 factors influence flood resilience in Lagos State. The Cronbach's alpha which is an indicator of internal consistency (reliability statistics) was 0.758 and is greater than the acceptable reliability of 0.750 (Taber, 2018: 1277; Oladimeji, 2019: 152-163; Ajayi, 2022: 71). With a mean score of 3.92 'indiscriminate dumping of solid waste' was ranked the top factor while 'low monthly income' (M=2.48) was ranked the lowest factor that influence households' flood resilience (Table 2).
5.2 Principal component analysis of factors influencing household flood resilience
As indicated in Table 3, statistically significant casual relationships existed between 63 pairs of the returned 16 observed variables, from which none had high correlation coefficients (r > 0.70). However, medium size (0.50 < r < 0.69) and low size (r < 0.50) correlation effects were found in 67.1% and 32.9% of the pair variables, respectively (Table 3).
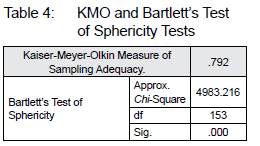
Table 4 shows the results of the Kaiser-Meyer-Olkin Measure of Sampling Adequacy (KMO) and Bartlett's tests. The KMO index of 0.792 (KMO > 0.5) confirmed the adequacy of the sample size. The Bartlett's test provided a significant Chi-square coefficient p<0.001, which assured that no redundancy existed in the observed variables that were summarised into factors.
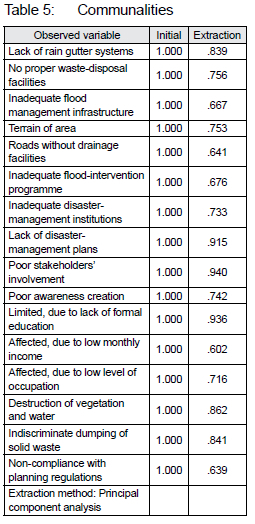
662) established that, when the communality values are greater than 0.5, the observed variables should be subjected to further analysis; otherwise they should be excluded. From the results (Table 5), over 83% of the variance is explained by 'lack of rain gutter systems' and over 75% of the variance is explained by 'no proper waste disposal facilities'.
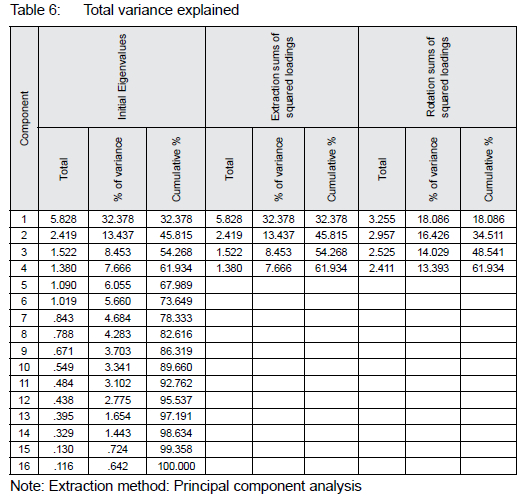
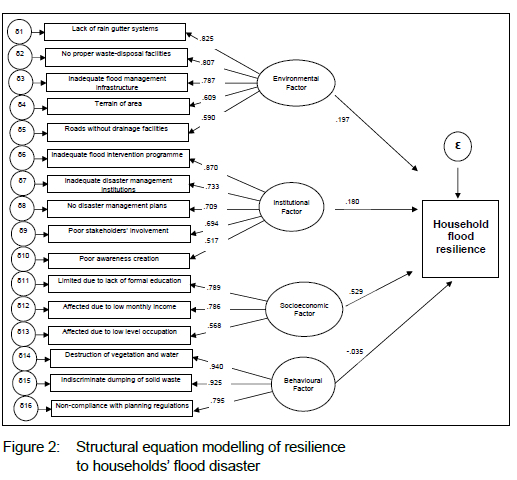
Tables 6 and 7 present the extraction and rotation outputs showing the component matrix and total variance obtained. Table 6 shows that four extracted components with initial Eigenvalues of 1.3 cumulatively explained that approximately 61.934% of the total variations should be retained. Factor one explains approximately 32.378%; factor two accounts for 13.437%, while the third and fourth factors explain 8.453% and 7.666%, respectively, of the variance in the model. Variables with component loadings higher than 0.50 (Table 7) were retained in the final output rotated matrix and those having the highest loadings on each component considered.
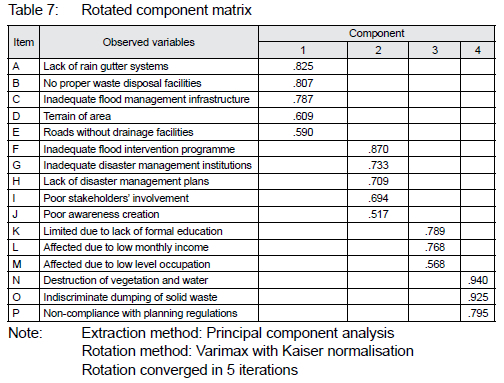
Component 1: Environmental factor The first component, environmental factor, has five correlated variable loadings. This component loaded highly on variables such as lack of rain gutter systems (0.825), no proper waste-disposal facilities (0.807), inadequate flood-management infrastructure (0.787), terrain of area (0.609) and roads without drainage facilities (0.590). This component has an Eigenvalue of 3.255, which accounted for the highest proportion (18.09%) of variance of the dataset.
Component 2: Institutional factor
The second component, institutional factor, has five correlated variable loadings. The component loaded highly on variables such as inadequate flood-intervention programme (0.870), inadequate disaster-management institutions (0.733), lack of disaster-management plans (0.709), poor stakeholders' involvement (0.694), and poor awareness creation (0.517). This component has an Eigenvalue of 2.957, which accounted for a high proportion (16.43%) of variance in the dataset.
Component 3: Socio-economic factor
The third component, socio-economic factor, has three correlated variable loadings. The component loaded highly on variables which are limited, due to lack of formal education (0.789), affected, due to low monthly income (0.768), and affected, due to low-level occupation (0.568). This component has an Eigenvalue of 2.525, which accounted for the third high proportion (14.03%) of variance in the dataset.
Component 4: Behavioural factor
The fourth component, behavioural factor, has three correlated variable loadings. The component loaded highly on variables such as destruction of vegetation and water (0.940), indiscriminate dumping of solid waste (0.925), and non-compliance with planning regulations (0.795). This component has an Eigenvalue of 2.411, which accounted for the lowest proportion (13.39%) of variance in the dataset.
5.3 Regression analysis of factors influencing flood resilience
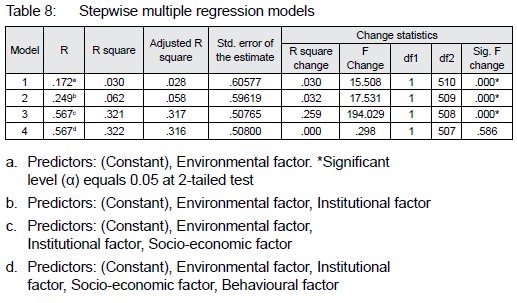
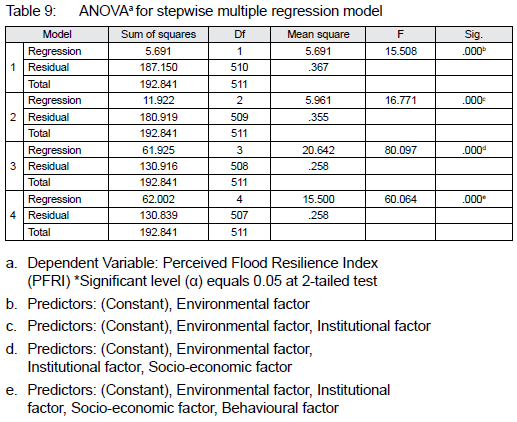
The four factors were further used as independent variables in a stepwise multiple regression analysis (sequential order). The study considered the hypothesis that no statistically significant relationship exists between households' flood resilience and its predictors. The dependent or outcome variable comprised the mean score indices built from the three measures of household resilience to flood disaster. These are absorptive, adaptive, and transformative capacities as conceived from the literature. A linear combination of the mean scores of these capacities was used in computing the Perceived Household Flood Resilience Index (PHFRI). This index served as the dependent variable which is the Households' Resilience to Flood Disaster (HRFD). The stepwise multiple regression process yielded four models (Tables 8, 9 and 10).
For the unstandardised coefficients (B), the regression equation is:
For the standardised coefficients (β), the regression equation is:

Where:
a = Constant
y1 = Households' Resilience to Flood Disaster (HRFD)
x1 = Environmental factor
e = Error term
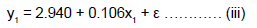
The first model had the entry level variable as environmental factor. Evident in this regard, the effect of environmental factor on households' resilience to flood disaster was determined. Environmental factor had a coefficient of multiple determination (R2 = 0.030), which made it a less predictor of households' resilience to flood disaster. This implies that 3.0% of households' resilience to flood disaster was predicted by environmental issues based on residential characteristics such as housing condition and infrastructure.
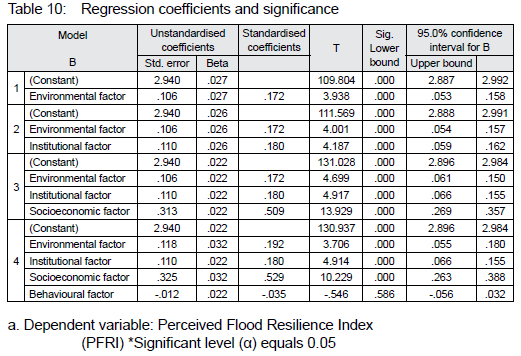
From the results (ΔR2 = 0.030, F(1, 510) =15 508, p = 0.000, a = 0.05), the change in coefficient of multiple determination remained the same and was also statistically significant. Based on this singular environmental factor, linear regression models were built as in equations (iii) and (iv), using the unstandardised and standardised coefficients, respectively. This first model was a linear regression one with the equations built on both regression coefficients, indicating that environmental factor (B= 0.106, β = 0.172, Fa 510) =15.508, p = 0.000, a = 0.05) was a positive predictor of households' resilience to flood disaster. This was due to the fact that its effect is positive and statistically significant.
For the unstandardised coefficients (B), the regression equation is:
For the standardised coefficients (β), the regression equation is:

Where:
a = Constant
y2 = Households' Resilience to Flood Disaster (HRFD)
x1 = Environmental factor
x2 = Institutional factor
e = Error term
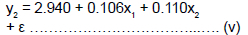
The second model showed the effect of environmental and institutional factors in predicting the households' resilience to flood disaster. Both factors were found to have a coefficient of multiple determination (R2 = 0.062). This implies that 6.2% of households' resilience to flood disaster was predicted by environmental and institutional issues. Meanwhile, the inclusion of institutional factor in the model, as determined by a statistically significant change in the coefficient of multiple determination (ΔR2= 0.032, F(1, 509) =17.531, p = 0.000, a = 0.05), showed that it contributed 3.2% to households' resilience to flood disaster in the study area. Based on both environmental and institutional factors, multiple regression models were built as provided in equations (v) and (vi). This second model was a multiple regression one with the first equation built on the unstandardised regression coefficient of the predictor existing on different units of measurement. To better explain the predictor with the highest regression coefficient, equation 8.4 was computed using the standardised coefficients with the error term eliminated. The predictors could, therefore, be compared directly. With both environmental and institutional factors (B1 = 0.106, B2 = 0.110, β1 = 0.172, β2 = 0.180, F(2509) =16.771, p = 0.000, a = 0.05) having statistically significant positive effects, the institutional factor was the highest predictor of households' resilience to flood disaster.
For the unstandardised coefficients (B), the regression equation is:
For the standardised coefficients (β), the regression equation is:
Where:
a = Constant
y3 = Households' Resilience to Flood Disaster (HRFD)
x1 = Environmental factor
x2 = Institutional factor
x3 = Socio-economic factor
e = Error term
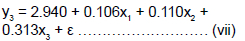
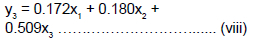
The third model presented the effect of environmental, institutional and socio-economic factors in predicting the households' resilience to flood disaster. The three factors were found to have a coefficient of multiple determination (R2 = 0.321). This implies that 32.1% of households' resilience to flood disaster was predicted by environmental, institutional, and socio-economic issues. Meanwhile, the inclusion of socio-economic factor in the model alone, as determined by a statistically significant change in the coefficient of multiple determination (AR2= 0.259, F(1 508) =194.029, p = 0.000, a = 0.05), showed that it contributed 25.9% to households' resilience to flood disaster in the study area. Based on environmental, institutional, and socio-economic factors, multiple regression models were built as provided in equations (vii) and (viii). This third model was also a multiple regression one, therefore having the same discussion as the second model. With all three factors having statistically significant positive effects (B1 = 0.106, B2 = 0.110, B3 = 0.313, β1 = 0.172, β2 = 0.180, β3 = 0.509, F(3 508) =80.097, p = 0.000, a = 0.05), socio-economic factor is the highest predictor of households' resilience to flood disaster, followed by institutional factor, while environmental factor was the least predictor.
For the unstandardised coefficients (B), the regression equation is:
For the standardised coefficients (β), the regression equation is:
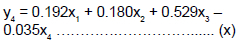
Where:
a = Constant
y4 = Households' Resilience to Flood Disaster (HRFD)
x1 = Environmental factor
x2 = Institutional factor
x3 = Socio-economic factor
x4 = Behavioural factor
e = Error term
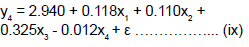
The fourth model contained all four determinants, namely environmental, institutional, socio-economic, and behavioural factors in predicting the households' resilience to flood disaster. The four factors were found to have a coefficient of multiple determination (R2 = 0.322). This implies that 32.2% of households' resilience to flood disaster was predicted by environmental, institutional, socio-economic, and behavioural issues. Meanwhile, the inclusion of behavioural factor in the model, as determined by change in the coefficient of multiple determination (ΔR2= 0.000, F507) = 0.298, p = 0.586, a = 0.05),
although not statistically significant, showed that it had no contribution to households' resilience to flood disaster in the study area. Based on environmental, institutional, and socio-economic factors, multiple regression models were built as provided in equations (ix) and (x). This fourth model was also a multiple regression one, thus having the same discussion as the second and third models. It was indicated in this model that environmental, institutional, and socio-economic factors had statistically significant positive effects, while behavioural factor had a statistically significant negative effect (B1 = 0.118, B2 = 0.110, B3 = 0.325, B4 = - 0.012, β1 = 0.197, β2 = 0.180, β3 = 0.529, β3 = -0.035, F (4, 507) = 60.064, p = 0.000, a = 0.05). The highest predictor of households' resilience to flood disaster was, therefore, the socio-economic factor, followed by institutional factor and environmental factor, with behavioural factor being the least predictor.
The preceding findings of all the four models established statistical significance for all the models (p < 0.05). The null hypothesis is, therefore, rejected, resulting in the acceptance of the alternate hypothesis. The findings, therefore, established that a statistically significant relationship exists between households' flood resilience and its predictors, namely socio-economic, institutional, environmental, and behavioural factors.
5.4 Discussion of findings
The results highlight that the greatest predictor of households' resilience to flood disaster is the socio-economic factor. Further descriptive findings revealed that respondents engaging in farming activities, artisanship, and transport businesses indicated high flood impact with no or limited resilient capacities. The civil servants indicated medium flood impact and medium resilient capacities, while the professionals involved in private practice and businesses indicated low flood impact and high resilient capacities. The reasons for such variation in agreement on flood impact by the respondents are not far-fetched. Many individuals who have occupations revolving around farming, artisanship, and petty trading, among others, have secondary education or less and earn less than N30,000. Many individuals have a household size of more than five persons. All this indicates that they were, in fact, low-income households that might not be economically buoyant to lessen the impact of flood (loss of personal property, damage to their means of livelihood, or survival, etc.) on them. As such, low socioeconomic status indicates a high level of poverty that aggravates households' flood resilience, and vice-versa. This implies that the poor do not have the needed economic resources and social nets to prevent, adapt to, and/or transform from the impact of flood disaster.
The rationale for such vulnerability of most of the low-income households could be that they hardly afford saving their incomes, as the highest proportion is usually spent on catering to basic needs such as food, shelter, and clothing. During disasters and the recovery period, they are highly dependent on external sources through debts or sales of parts of their assets, and cash in hand as emergency funds.
Moreover, the poor whose culture is that of being permanently attached to the flood-risk locations are more exposed and sensitive to flood with limited or no adaptive capacity. The information on households' education, occupation, income, and culture, among others, therefore, shows that the majority of households were well informed, based on their very strong agreement level that their low socio-economic condition made them vulnerable to flood disaster.
The influence of institutional factor was also found to be the second highest predictor of households' resilience to flood disaster. This provided that most of the households were well-informed (strong agreement level) that there is no proper institutional structure, because public disaster-management agency is insufficient, since it is centralised in the State. As a result, there were lapses in the delivery of functional infrastructure and services (health and education), provision of disaster risk-management education, enforcement of environmental laws and policies, and delivery of intervention programmes and relief materials. There is also the problem of not being able to access the public disaster-management agency when required.
The environmental factor being the third highest predictor of households' resilience to flood disaster was also due to medium agreement level regarding environmental amenities. Our study found that most of the buildings are without rain gutter systems and rain gardens that can control flood. The neighbourhoods are without street gardens, swales, green roofs, and other green infrastructure that can help in flood management. The study also found that there is inadequate or poor delivery of functional sanitation facilities and services, including drainages, canals, and waste-disposal systems. Another challenge is poor management of natural vegetation, wetlands, and floodplains.
The smallest predictor of households' resilience to flood disaster is the behavioural factor. This result is quite surprising and interesting. Digging further, we found that, due to the households' refusal to evacuate flood-risk zones, this makes people continually live with flood. Households, especially the poor, are not perturbed by flood impacts and deaths. No matter what happens, people would not evacuate from flood-risk zones, because they are afraid of being homeless. They firmly believe the more flood disaster they experience, the more they survive and learn to live with it. Consequently, nothing could displace them from their properties, cultural heritage, and history. Moreover, households attached less and no importance to their non-compliance with environmental laws. Hence, the high level of disagreement (very strong disagreement) with issues regarding continuous destruction of vegetation and water by felling of forests and dredging of seas, indiscriminate dumping of solid waste that blocks sewers and drains, and non-compliance with planning regulations such as building on waterfronts and blockage of water channels. It is, therefore, deduced that households attached less and no importance to their non-compliance with environmental laws because of their nonchalant attitudes to the environment. The fault could result from non-enforcement of existing environmental laws and penalties.
Previous studies (Adelekan, 2010; Viverita et al., 2014; Zuma et al., 2012; Enwemeka, 2014; Nkwunonwo, Malcolm & Brian, 2015; Ojolowo & Wahab, 2017; Olanrewaju et al., 2019) corroborate the findings of this study, but most of their results evolved from descriptive statistics. As such, they could hardly generalise and predict household flood resilience. These findings are entirely different in that they are predictive and established based on inferential statistics. The overall model, therefore, makes generalisation for the study area that low socio-economic status, limited environmental assets, and weak institutional frameworks lead to low flood resilience and vice-versa, and that poor human behavioural response to flood leads to increased household resilience and vice-versa.
This study nevertheless has its own limitations. The emergence of the COVID-19 pandemic and the new normal might have a serious impact on households' flood resilience, which might affect the outcome of this study. It is anticipated that the socio-economic status of households living in flood-risk zones might be further impacted by the pandemic.
However, this study was unable to capture situations concerning the pandemic, since it was conducted before its emergence. In addition, the study was not conducted throughout Nigeria; it was restricted to the flood-prone areas of Lagos State. Therefore, it is impossible to generalise the results for the entire nation. Furthermore, because households were used as the analysis unit in this study, results for other analysis units such as neighbourhoods and communities could not be generalised. These limitations have implications for further studies. Future research could, therefore, be conducted across different states and geo-political zones of the country to understand household flood resilience. Other units of analysis such as neighbourhood and community levels could be explored. Finally, those further studies might consider the impact of the new normal, the post-COVID-19 pandemic era.
6. CONCLUSION
This study examined issues regarding how households bounce back or recover after being negatively impacted by flood disasters. Predictors of the resilience of households to flood disaster were theoretically explored from literature and established through the results of this study as behavioural, socio-economic, institutional, and environmental factors. It is important to note that each factor was a composite determinant of households' resilience to flood disaster derived from analysing several observed variables. The percentage contribution of each factor was provided and a mathematical model was built to define its role in determining the resilience of households to flood disaster. Hence, each model is useful in predicting households' resilience in future occurrences of flood disaster. From the findings, it was noted that the highest predictor of households' resilience to flood disaster is the socio-economic factor. It is concluded that the households attach the highest correlation to issues such as education, occupation, income, and culture. This implies that it is only when socio-economic issues are properly and adequately addressed that households' resilience could be highly strengthened. Hence, the need to formulate policies that would address the social and economic welfare of households.
Finally, the results of the study are essential information for academics, policymakers, and practitioners. The data provided would be useful in establishing the number of factors affecting households' resilience to flood disaster. Stakeholders could, therefore, better understand the varying dimensions of each factor and how to accordingly disburse and channel their resources in building and/or strengthening the resilience capacities of households in pre-disaster, disaster, and post disaster scenarios, thus improving the flood disaster-management system. These findings might not directly apply to other extreme climate events such as drought, heat waves, and storms, but by extension, applying the methodology herein in any of such study on resilience of households and other population could be worthwhile.
REFERENCES
ADELEKAN, I.O. 2010. Vulnerability of poor urban coastal communities to flooding in Lagos, Nigeria. Environment and Urbanization, 22(2), pp. 433-450. doi: 10.1177/0956247810380141 [ Links ]
ADEOTI, S. & AKINTUNDE, T. 2014. Poverty implications on natural disasters occurrence in Nigeria. The International Journal of Engineering and Science, 3(10), pp. 8-14. [ Links ]
ADEWARA, B.M., IRIVBOGBE, H.E., YUSUF, W. & AKITOYE, M. 2018. Analysing flood risk in Lagos Island Local Government Area of Lagos State. Presented at the FIG Congress 2018 on Embracing Smart World Where the Continents Connect: Enhancing the Geospatial Maturity of Society, 6-11 May, Turkey. [ Links ]
ADGER, W. 2000. Social and ecological resilience: Are they related? Progress in Human Geography, 24(3), pp. 347-364. https://doi.org/10.1191/030913200701540465 [ Links ]
AICH, V., KONE, B., HATTERMANN, F.F. & MULLER, E.N. 2014. Floods in the Niger basin: Analysis and distribution. Natural Hazards and Earth System Sciences Discussion, 2(8), pp. 5171-5212. https://doi.org/10.5194/nhessd-2-5171-2014 [ Links ]
AJAYI, A. 2022. Factors militating against cooperative societies' contributions to housing development in Osogbo, Nigeria. Acta Structilia, 29(2), pp. 58-82. https://doi.org/10.18820/24150487/as29i2.3 [ Links ]
ALMALKI, S. 2016. Integrating quantitative and qualitative data in mixed methods research: Challenges and benefits. Journal of Education and Learning, 5(3), pp. 288-296. doi: 10.5539/jel.v5n3p288 [ Links ]
ANDERSEN, T.K. & SHERPERD, J.M. 2013. Floods in a changing climate. Geography Compass, 9(2), pp. 95-115. doi: 10.1111/gec3.12025 [ Links ]
APUKE, B.D. 2017. Quantitative research methods: A synopsis approach. Arabian Journal of Business and Management Review, 6(10), pp. 40-47. https://doi.org/10.12816/0040336 [ Links ]
ATUFU, C.E. & HOLT, C.P. 2018. Evaluating the impacts of flooding on the residents of Lagos, Nigeria. Urban Water Systems & Flood, 184, pp. 81-90. https://doi.org/10.2495/FRIAR180081 [ Links ]
BARIWENI, P.A., TAWARI, C.C. & ABOWEI, J.F.N. 2012. Some environmental effects of flooding in the Niger Delta Region of Nigeria. International Journal of Fisheries and Aquatic Sciences, 1(1), pp. 35-46. [ Links ]
BATICA, J., HU, F. & GOURBESVILLE, P. 2012. Flood resilience and urban systems: Nice and Taipei case studies. In: Proceedings of the 2nd European Conference on Flood Risk Management, FLOODrisk2012, 19-23 November, Rotterdam, The Netherlands. Boca Raton: CRC Press, pp. 348-350. https://doi.org/10.1201/b13715-205 [ Links ]
BENE, C., WOOD, G., NEWSHAM, A. & DAVIS, M. 2012. Resilience: New utopia or new tyranny? IDS Working Paper (No. 405). Brighton: IDS. https://doi.org/10.1111/j.2040-0209.2012.00405.x [ Links ]
BIRKMANN, J., AGBOOLA, J., WELLE, T., AHOVE, M., ODUNUGA, S. et al. 2016. Vulnerability, resilience and transformation of urban areas in the coastal megacity Lagos: Findings of local assessments and household survey in highly exposed areas. Journal of Extreme Events, 3(3), article number 1650019, pp. 1-24. doi: 10.1142/s2345737616500196 [ Links ]
BOWER, T., PRESNALL, C., FRANKENBERGER, T., SMITH, L., BROWN, V. & LANGWORTHY, M. 2016. Shocks, resilience capacities and response trajectories over time. Technical Consortium Technical Report Series 2: Strengthening the Evidence Base for Resilience in the Horn of Africa. Nairobi: ILRI and TANGO International. [ Links ]
CRED (Center for Research on the Epidemiology of Disasters). 2011. Disaster loss characterization: Review of human and economic impact indicator definitions. Working Paper (Draft). Brussels: CRED. [ Links ]
CRESWELL, J.W. 2014. Research design: Quantitative, qualitative and mixed methods approach. 4th edition. Thousand Oaks, CA: Sage. [ Links ]
DADA, O.T. 2021. Environmental and health hazards of residents domiciled around Africa's largest landfill. Journal of Environmental Planning and Management, 64(9), pp. 1642-1667. doi: 10.1080/09640568.2020.1835621 [ Links ]
DAMINGO, S. 2017. Institutional issues on disaster risk reduction and management. Discussion Paper Series (No. 2017-50). Philippine Institute for Development Studies, Quezon City, Philippine. [ Links ]
DARAMOLA, O., ODUNSI, O. & OLOWOPOROKU, O. 2017. The corridor to survival: Assessment of disaster management literacy in a developing country. Environmental Quality Management, 27(2), pp. 15-24. doi: 10.1002/tqem.21525 [ Links ]
DIAZ, H.F. & MURNANE, R.J. 2008. Climate extremes and society. Cambridge: Cambridge University Press. https://doi.org/10.1017/CBO9780511535840 [ Links ]
DOMMARAJU, P. 2015. One-person households in India. Demographic Research, 32(45), pp. 1239-1266. doi: 10.4054/DemRes.2015.32.45 [ Links ]
DOUBEN, N. 2006. Characteristics of river floods and flooding: A global overview, 1985-2003, irrigation and drainage. Wiley International Science, 55, pp. 9-21. https://doi.org/10.1002/ird.239 [ Links ]
EA (Environmental Agency). 2000. Lessons learned: Autumn 2000 floods. Almondsbury: Environmental Agency. [ Links ]
ENWEMEKA, S. 2014. The administration of emergency relief programme in Nigeria: A case of flood incident in Delta State. MSC thesis, University of Nigeria, Nsukka. [ Links ]
FAGBEMI, K. 2011. Nigerian: National progress report on the implementation of the hyogo framework for action (2009-2011). [Online]. Available at: <https://www.preventionweb.net/> [Accessed: 12 June 2020]. [ Links ]
FERNANDEZ, P., MOURATO, S. & MOREIRA, M. 2016. Social vulnerability assessment of flood risk using GIS-based multicriteria decision analysis: A case study of Vila Nova de Gala (Portugal). Geomatics, Natural Hazards and Risk, 7(4), pp. 1367-1389. doi: 10.1080/19475705.2015.1052021 [ Links ]
FIELD, A.P. 2005. Discovering statistics using SPSS. 2nd edition. London: Sage. [ Links ]
FOLKE, C. 2006. Resilience: The emergence of a perspective for social-ecological systems analyses. Global Environmental Change, 16, pp. 253-267. https://doi.org/10.1016/j.gloenvcha.2006.04.002 [ Links ]
FOLKE, C., CARPENTER, S., ELMQVIST, T., GUNDERSON, L., HOLLING, C. & WALKER, B. 2002. Resilience and sustainable development: Building adaptive capacity in a world of transformations. Ambio, 31(5), pp. 437-440. https://doi.org/10.1579/0044-7447-31.5.437 [ Links ]
FOLKE, C., CARPENTER, S., WALKER, B., SCHEFFER, M., CHAPIN, T. & ROCKSTRÖM, J. 2010. Resilience thinking: Integrating resilience, adaptability and transformability. Ecology and Society, 15(4). http://www.ecologyandsociety.org/vol15/iss4/art20/ [ Links ]
GELLEH, I.D., IBIDUN, O.A. & OKEKE, U.H. 2016. Flood vulnerability assessment in Lagos City using multi-criteria analysis. Greener Journal of Environmental Management and Public Safety, 5(2), pp. 24-32. https://doi.org/10.15580/GJEMPS.2016.2.011316005 [ Links ]
GOVERNMENT OF INDIA. 2001. Concept and definitions used in NSS. National Sample Survey Organisation, Ministry of Statistics and Programme Implementation, India, pp. 1-137. [ Links ]
HAIR, J.F., BLACK, W.C., BABIN, B.J. & ANDERSON, R.L. 2014. Multivariate data analysis. 5th edition. Upper Saddle River, NJ: Prentice Hall. [ Links ]
HANNAFORD, J. 2015. Climate-driven changes in UK river flows: A review of the evidence. Progress in Geography: Earth and Environment. doi: 10.1177/0309133314536755. [ Links ]
HARLACHER, J. 2016. An educator's guide to questionnaire development (REL 2016-108). Washington, DC: U.S. Department of Education, Institute of Education Sciences, National Center for Education Evaluation and Regional Assistance, Regional Educational Laboratory Central. [ Links ]
HOFMANN, J. & SCHUTTRUNPF, H. 2019. Risk-based early warning system for pluvial flash floods: Approaches and foundations. Geosciences, 9(127), pp. 1-22. doi: 10.3390/geosciences9030127 [ Links ]
HOLLING, C. 1973. Resilience and stability of ecological systems. Annual Review of Ecology and Systematics, 4, pp. 1-23. https://doi.org/10.1146/annurev.es.04.110173.000245 [ Links ]
HOYLE, R.H. 1995. The structural equation modeling approach: Basic concepts and fundamental issues. In: Hoyle, R.H. (Ed.). Structural equation modeling: Concepts, issues, and applications. Los Angeles, CA: Sage, pp. 1-15. [ Links ]
HUNDECHA, Y., PARAJKA, J. & VIGLIONE, A. 2017. Flood type classification and assessment of their past changes across Europe. Hydrology and Earth System Science. https://doi.org/10.5194/hess-2017-356 [ Links ]
IBEM, E. 2011. Challenges of disaster vulnerability reduction in Lagos Megacity Area, Nigeria. Disaster Prevention and Management, 20(1), pp. 27-40. https://doi.org/10.1108/09653561111111063 [ Links ]
IKHUORIA, I., YESUF, G., ENARUVBE, G. & IGE-OLUMIDE, O. 2012. Assessment of the impact of flooding on farming communities in Nigeria: A case study of Lokoja, Kogi State, Nigeria. Paper presented at Geoinformation Society of Nigeria (GOESON) & Nigerian Cartographic Association (NCA) Joint Annual Workshop, RECTAS, Obafemi Awolowo University, Ile-Ife. [ Links ]
IPCC (Intergovernmental Panel on Climate Change). 2012. Summary for policymakers. In: Field, C.B. et al. (Eds). Managing the risks of extreme events and disasters to advance climate change adaptation. A Special Report of Working Groups I and II of the Intergovernmental Panel on Climate Change. Cambridge: Cambridge University Press, pp. 1-19. [ Links ]
KLEM, L. 2000. Structural equation modeling. In: Grimm, L.G. & Yarnold, P.R. (Eds). Reading and understanding MORE multivariate statistics. American Psychological Association, pp. 227-260. [ Links ]
KREJCIE, R.V. & MORGAN, D.W. 1970. Determining sample size for research activities. Educational and Psychological Measurement, 30, pp. 607-610. https://doi.org/10.1177/001316447003000308 [ Links ]
KUNDZEWICZ, Z. 2005. Is the frequency and intensity of flooding changing in Europe? In: Kirch, W. (Ed.). Extreme weather events and public health responses. Berlin Heidelberg: Springer-Verlag, pp. 27-32. [ Links ]
KUNDZEWICZ, Z., PINSKWAR, W. & BRAKENRIDGE, R. 2012. Large floods in Europe, 1985-2009. Hydrological Sciences Journal, 58(1), pp. 1-7. doi: 10.1080/02626667.2012.745082. [ Links ]
LAGOS STATE GOVERNMENT. 2014. Lagos State Millennium Development Goals report. Ministry of Economic Planning & Budget. Lagos State Government, Lagos State, Nigeria. [ Links ]
MADDOX, I. 2014. The risks of hazard: Three common types of flood explained. [Online]. Available at: <www.intermap.com> [Accessed: 8 April 2018]. [ Links ]
MANDYCH, A. 2010. Classification of floods. In: V. Kotlyakov (Ed.). Natural disasters, vol. 2. UNESCO-Encyclopedia Life Support Systems (EOLSS), pp. 63-88. [ Links ]
MASTEN, A.S., BEST, K.M. & GARMEZY, N. 1990. Resilience and development: Contributions from the study of children who overcome adversity. Development and Psychopathology, 2(4), pp. 425-444. https://doi.org/10.1017/S0954579400005812 [ Links ]
MCCARTHY, I., COLLARD, M. & JOHNSON, M. 2017. Adaptive organizational resilience: An evolutionary perspective. Current Opinion in Environmental Sustainability, 28, pp. 33-40. doi: 10.1016/j.cosust.2017.07.005 [ Links ]
MILLER, J.D. & HUTCHINS, M. 2017. The impacts of urbanisation and climate change on urban flooding and urban water quality: A review of the evidence concerning the United Kingdom. Journal of Hydrology: Regional Studies, 12, pp. 345-362. https://doi.org/10.1016/j.ejrh.2017.06.006 [ Links ]
MSENGANA-NDLELA, L. 2008. Opening remarks at the disaster management, Indaba (Unpublished). Gallagher Estate, Midrand. [ Links ]
NATH, S. 2014. Addressing Delhi's urban flooding problem. Bachelor's project research paper. Guru Gobind Singh Indrapratha University, Kashmere Gate Campus, Delhi, India. [ Links ]
NKWUNONWO, U. 2016. A review of flooding and flood risk reduction in Nigeria. Global Journal of Human-Social Science: B Geography, Geo-Sciences, Environmental Science and Disaster Management, 16(2), pp. 22-37. [ Links ]
NKWUNONWO, U., MALCOLM, W. & BRIAN, B. 2015. Flooding and flood risks reduction in Nigeria: Cardinal gaps. Journal of Geography and Natural Disasters, 5, article 136. doi: 10.4172/2167-0587.1000136 [ Links ]
NORD, M. 2007. Characteristics of low-income households with very low food security: An analysis of the USDA GPRA food security indicator. EIB-25. U.S. United States Department of Agriculture, Economic Research Service Economic Information, May, Bulletin No. 25. https://doi.org/10.2139/ssrn.1084839 [ Links ]
OECD (Organisation of Economic Co-operation and Development). 2016. Family size and household composition. Social Policy Division -Directorate of Employment, Labour and Social Affairs. [Online] Available at: <www.oecd.org/els/family/database.htm> [Accessed: 11 December 2018]. [ Links ]
OJOLOWO, S. & WAHAB, B. 2017. Municipal waste solid and flooding in Lagos metropolis, Nigeria: Deconstructing the evil nexus. Journal of Sustainable Development, 11(2), pp. 98-111. [ Links ]
OKUNOLA, O.H. 2018. Assessment of disaster risk management practices in selected cities of Nigeria. PhD thesis, Department of Urban and Regional Planning, Obafemi Awolowo University, Ile-Ife, Nigeria. [ Links ]
OLADIMEJI, O. 2019. Factors influencing professionalism and the viability of local Arms in Nigeria. Acta Structilia, 26(2), pp. 142-174. https://doi.org/10.18820/24150487/as26i2.5 [ Links ]
OLAJUYIGBE, A.E., ROTOWA, O.O. & DUROJAYE, E. 2012. An assessment of flood hazard in Nigeria: The case of Mile 12, Lagos. Mediterranean Journal of Social Sciences, 3(2), pp. 367-377. doi: 10.5901/mjss.2012.v3n2.367 [ Links ]
OLANIRAN, O.J. 1983. Flood-generating mechanisms at Ilorin, Nigeria. Geography Journal, 7(3), pp. 271-277. http://www.jstor.org/stable/41143048. https://doi.org/10.1007/BF00209065 [ Links ]
OLANREWAJU, C.C., CHITAKAITA, M., OLANREWAJU, O.A. & LOUW, E. 2019. Impacts of flood disasters in Nigeria: A critical evaluation of health implications and management. Journal of Disaster Risk Studies, 11(1), article nubmer 557. doi:10.4102/jamba.v11i1.557 [ Links ]
OLOWOPOROKU, O., DARAMOLA, O. & ODUNSI, O. 2021. Determinants of residents' environmental hazards and risks in coastal towns of Delta State, Nigeria. International Journal of Disaster Risks Reduction, 56, article 102094, pp. 1-6. https://doi.org/10.1016/j.ijdrr.2021.102094 [ Links ]
OXFAM INTERNATIONAL. 2017. The future is a choice: Absorb, adapt, transform resilience capacities. Oxfam House Oxford: Oxfam GB. [ Links ]
PLATT, S. 2017. Factors affecting the speed and quality of post-disaster recovery and resilience. In: Rupakhety R. & Olafsson, S. (Eds). Earthquake engineering and structural dynamics in memory of Prof. Ragnar Sigbjörnsson: Selected topics. The Netherlands: Springer, pp. 369-403. doi: 10.1007/978-3-319-62099-2_19 [ Links ]
PORTFOLIO COMMITTEE ON COOPERATIVE GOVERNANCE AND TRADITIONAL AFFAIRS. 2011. Flooding disaster management: Minutes from the committee meeting held on 28 February, Parliament of South Africa, Cape Town, South Africa. December 2010/January 2011: Update by Deputy Minister of Cooperative Governance. [ Links ]
REPUBLIC OF MALI. 2007. Enquete legere integree aupres des menages (elim) 2006. 1-3. World Bank, European Union. Mimeo. [ Links ]
RESTEMEYER, B., WOLTJER, J. & VAN DEN BRINK, M. 2015. A strategy-based framework for assessing the flood resilience of cities - A Hamburg case study. Planning Theory and Practice, 16(1), pp. 45-62. doi: 10.1080/1464357.2014.1000950 [ Links ]
ROSSI, A., MENNA, C., ASPRONE, D., JALAYER, F. & MANFREDI, G. 2012. Socio-economic resilience of the L'Aquila Community in the aftermath of the 2009 earthquake. Paper presented at the 15th WORLD Conference on Earthquake Engineering, 24-28 September, Lisbon, Portugal. [ Links ]
ROSSONI, L., ENGELBERT, R. & BELLEGARD, N.L. 2016. Normal science and its tools: Reviewing the effects of exploratory factor analysis in management. Revista de Administração, 51(2), pp. 198-211. https://doi.org/10.5700/rausp1234 [ Links ]
SALISU, U.O., ODULAJA, A.O., OGUNSEYE, N.O., FASINA, S.O. & OKUNUBI, S.A. 2019. Residents' satisfaction with public housing in Lagos, Nigeria. Ghana Journal of Geography, 11(1), pp. 108-200. https://dx.doi.org/10.4314/gjg.v11i1.11 [ Links ]
SERRE, D., BARROCA, B., BALSELLS, M. & BECUE, V. 2018. Contributing to urban resilience to floods with neighbourhood design: The case of Am Sandtorkai/Dalmannkai in Hamburg. Journal of Flood Risk Management, 11, pp. S69-S83. doi: 10.1111/jfr3.12253 [ Links ]
SIDI, M. 2012. The impact of the 2012 floods on agriculture and food security in Nigeria using GIS. Paper presented at the United Nations International Conference on Space-Based Technologies for Disaster Management - Risk Assessment in the Context of Global Climate Change, 7-9 November, Beijing, China. [ Links ]
TABER, K.S. 2018. The use of Cronbach's alpha when developing and reporting research instruments in science education. Research in Science Education, 48, pp. 1273-1296. https://doi.org/10.1007/s11165-016-9602-2 [ Links ]
TAPSELL, S. 2001. The health effects from fluvial flooding. Report to the Environment Agency. Flood Hazard Research Centre, Enfield. [ Links ]
UNITED NATIONS. 2009. Water in a changing world. Paris: UNESCO. [ Links ]
UNITED NATIONS. 2017. Household size and composition around the world. Population facts. Department of Economic and Social Affairs. Population Division, No. 2. [Online]. Available at: <www.unpopulation.org> [Accessed: 4 June 2019]. [ Links ]
UNITED NATIONS. 2018. The 2030 Agenda and the sustainable development goals: An opportunity for Latin America and the Caribbean. Santiago: United Nations. [ Links ]
URP GIS LAB. 2022. Lagos State in the context of Nigeria. Department of Urban and Regional Planning, Olabisi Onabanjo University, Ibogun, Ogun State, Nigeria. [ Links ]
US NOAA (United States National Oceanic and Atmospheric Administration). 2016. Climate change increased chances of record rains in Louisiana by at least 40 per cent. [Online]. Available at: <https://www.noaa.gov/media-release/climate-change-increased-chances-of-record-rains-in-louisiana-by-at-least-40-percent> [Accessed: 4 June 2019]. [ Links ]
VIVERITA, D., KUSUMASTUTI, R., HUSODO, Z., SUARDI, L. & DANARSARI, D. 2014. Households' perceptions on factors affecting resilience towards natural disasters in Indonesia. The South East Asian Journal of Management, 8(1), pp. 13-28. https://doi.org/10.21002/seam.v8i1.3099 [ Links ]
WAHAB, B. & OJOLOWO, S. 2018. Drivers and spatial extent of urban development in flood-prone areas in metropolitan Lagos. Journal of Sustainable Development, 11(2), pp. 98-111. https://doi.org/10.5539/jsd.v11n2p98 [ Links ]
WAHAB, B., OJOLOWO, S., ADELEKAN, I. & FASONA, M. 2014. Building contraventions and incidence of flood in the Lagos metropolis. Paper presented at the 6th International conference on flood management, 16-18 September, Sao Paulo, Brazil. [ Links ]
WALKER, B. & SALT, D. 2006. Resilience thinking: Sustaining ecosystems and people in a changing world. Washington, DC: Island Press. [ Links ]
WALKER, B., ABEL, N., ANDERIES, J. & RYAN, P. 2009. Resilience, adaptability, and transformability in the Goulburn-Broken Catchment, Australia. Ecology and Society, 14(1), article 12. [Online]. Available at: <http://www.ecologyandsociety.org/vol14/iss1/art12/> [Accessed: 6 June 2019]. [ Links ]
WALKER, B., GUNDERSON, L., KINZIG, A., FOLKE, C., CARPENTER, S. & SCHULTZ, L. 2006. A handful of heuristics and some propositions for understanding resilience in social ecological systems. Ecology and Society, 11(1), article 13. http://www.ecologyandsociety.org/vol11/iss1/art13/ [ Links ]
WILLEKENS, F. 2010. Family and household demography. In: Yi, Z. (Ed.). Demography: Encyclopedia of life support systems (Volume 2). Oxford, UK: UNESCO in partnership with EOLSS Publishers, pp. 86-112. [ Links ]
WOODEN, M., FREIDIN, S. & WATSON, N. 2002. The household, income and labour dynamics in Australia (HILDA) survey: Wave 1 survey methodology. Melbourne, Australia: Melbourne Institute of Applied Economic and Social Research. https://doi.org/10.1111/1467-8462.00252 [ Links ]
YODO, N. & WANG, P. 2016. Resilience analysis for complex supply chain systems using Bayesian Networks. Paper No. 2016-0474 presented at the 54th AIAA Aerospace Sciences Meeting, 4-8 January, San Diego, California, USA. https://doi.org/10.2514/6.2016-0474 [ Links ]
ZUMA, B., LUYT, C., CHIRENDA, T. & TANDLICH, R. 2012. Flood disaster management in South Africa: Legislative framework and current challenges. In: Proceedings of the International Conference on Applied Life Sciences (ICALS2012), 10-12 September, Turkey, pp. 127-132. [ Links ]
ZURICH INSURANCE GROUP. 2017. Pre-event financial protection is key to flood recovery. [Online] Available at: <https://zurich.com/en/corporate-responsibility/flood-resilience> [Accessed: 5 September 2018]. [ Links ]
Received: November 2022
Peer reviewed and revised: November 2022
Published: December 2022
* The author(s) declared no potential conflicts of interest with respect to the research, authorship, and/or publication of this article

