


Services on Demand
Article
 English (pdf)
 Article in xml format
 Article references
Indicators

Related links
-
 Cited by Google
 -
 Similars in Google
Share

 Permalink
Town and Regional Planning
On-line version ISSN 2415-0495
Print version ISSN 1012-280X
Town reg. plan. (Online) vol.80 Bloemfontein 2022
http://dx.doi.org/10.18820/2415-0495/trp80i1.4
RESEARCH ARTICLE
A living conditions index for main and backyard shacks and backyard rooms in Gauteng's metropolitan municipalities: 2001 to 2011
'N lewensomstandigheidsindeks (lci) vir hoof- en agterplaas-'shacks' en agterplaaskamers in gauteng se metropolitiaanse munisipaliteite: 2001 tot 2011
Lenane la maemo a bodulo bakeng sa mekhukhu e meholo le e ka morao le dikamore tse ka morao ho bomasepala ba toropo ya gauteng: 2001 ho isa 2011
Itumeleng MahlakanyaI; Lodene WillemseII
IMPhil Urban and Regional Science student, Centre for Regional and Urban Innovation and Statistical Exploration (CRUISE), Department of Geography and Environmental Studies, Stellenbosch University; Currently employed at Statistics South Africa, Chief Systems Analyst, Business Modernisation, Physical and postal address: Wing 1 third floor (Office 3F MO 02), Isibalo House, 1 Koch Street, Salvakop, Pretoria, 0002. Phone: +27 12 310 3486, email: Itumelengmah@statssa.gov.za
IILecturer, Centre for Regional and Urban Innovation and Statistical Exploration (CRUISE), Department of Geography and Environmental Studies, Stellenbosch University, Private Bag X1, Matieland, 7602, South Africa. Phone: +27 21 808 9103, email: lodene@sun.ac.za
ABSTRACT
Physical housing conditions and neighbourhood characteristics influence people's living conditions. This article aims to determine changes in the living conditions of people residing in main and backyard shacks, and backyard rooms in the City of Johannesburg, City of Tshwane, and Ekurhuleni from 2001 to 2011. The methods involved computing percentages to determine profile characteristics, calculating an average living conditions index (LCI) score per main place for 2001 and 2011, and mapping the average LCI scores through thematic and hot spot analyses. Results show that young, Black, single men mostly reside in these dwellings. People are better educated and have higher incomes in backyard rooms, compared to main shacks; service delivery shows similar patterns. People in all the dwelling types and municipalities generally experience poor to average LCI scores, and none higher than 60%. Backyard rooms do, however, generally produce higher LCI scores than main shacks. Important policy implications are highlighted.
Keywords: Living conditions index (LCI), main shacks, backyard shacks, backyard rooms, City of Johannesburg (CoJ), City of Tshwane (CoT), Ekurhuleni (EMM)
OPSOMMING
Die fisiese behuisingstoestande en omgewingseienskappe beïnvloed mense se lewensomstandighede. Die artikel het ten doel om veranderinge in die lewensomstandighede van mense wat in hoof- en agterplaas-'shacks' en agterplaaskamers in die CoJ, CoT en EMM woon, vanaf 2001 tot 2011, te bepaal. Die metodes het die berekening van persentasies behels om profieleienskappe te bepaal, berekening van 'n gemiddelde lewensomstandigheidsindeks (LCI)-telling per hoofplek vir 2001 en 2011, en kartering van die gemiddelde LCI-tellings deur tematiese en 'hot spot' ontledings. Resultate toon dat jong, Swart, en enkellopende mans meestal in hierdie wonings woon. Mense is beter opgelei en het 'n hoër inkomste in agterplaaskamers, vergeleke met hoof-'shacks', terwyl dienslewering soortgelyke patrone toon. Mense in al die behuisingstipes en munisipaliteite ervaar oor die algemeen swak tot gemiddelde LCI-tellings, met geen telling wat hoër as 60% is nie. Agterplaaskamers produseer egter gewoonlik hoër LCI-tellings, vergeleke met hoof-'shacks'. Belangrike beleidsimplikasies word uitgelig.
Sleutelwoorde: Agterplaaskamers, agterplaas 'shacks', lewensomstandig-heidsindeks (LCI), hoof-'shacks', Stad van Johannesburg (CoJ), Stad van Tshwane (CoT), Ekurhuleni (EMM)
Maemo a matlo a bolulo le sebobeho sa metse li susumetsa maemo a batho a bophelo. Sengoliloeng sena se ikemiselitse ho fumana liphetoho maemong a bophelo a batho ba lulang mek'huk'hung le likamoreng majareteng a fumanehang litoropong tsa limasepala tsa Johannesburg, Tshwane, le Ekurhuleni ho tloha 2001 ho isa 2011. Mekhoa ea ho fuputsa e ne e kenyelelitse ho etsa liperesente ele ho fumana sebopeho sa matlo karolelano ea lipalo tsa maemo a bophelo (LCI) ntlo ka 'ngoe pakeng tsa 2001 le 2011, le ho etsa 'mapa oa lintlha tse tloaelehileng tsa LCI ka ho hlahloba libaka tse khethehileng. Liphetho li bontsa hore boholo ba batho ba lulang matlong ana ke banna ba bacha, ba Batso, ba masoha. Hape, boholo ba batho ba lulang likamoreng ke ba rutehileng, ba nang le meputso e holimo ho feta batho ba lulang mek'huk'hung; liphetho tse tsoanang li iponahalitse nthleng ea phepelo ea litsebeletso. Batho ba lulang mefuteng eohle ea matlo, ka hara limasepala ka kakaretso, ba fumane liphetho tse tlase tsa LCI, 'me ha ho tse fetang 60%. Leha ho le joalo, likamore tsa majareteng li hlahisa lintlha tse phahameng tsa LCI ho feta mekhukhu. Sengoliloeng sena se totobatsa litlamorao tsa bohlokoa tsa maano a puso.
1. INTRODUCTION
The term 'living conditions' is multidimensional and relates to quality of life (QOL). This article specifically explores the intersection between living conditions (QOL) and housing satisfaction. According to Maslow's hierarchy, adequate housing is an important physiological need (Poston, 2009: 348). The physical-structural configurations of houses and neighbourhood conditions (i.e., well-functioning infrastructure, services, and facilities) contribute positively to people's living conditions (Govender, Barnes & Pieper, 2011: 335-336). However, rapid population growth and urbanisation increase the growth of informal settlements (80% of which are found in Eastern and South-Eastern Asia, sub-Saharan Africa, and Central and Southern Asia) and this increases the pressure of demand: an estimated 3 million people will require adequate and affordable housing by 2030 (UN General Assembly, 2015). Informal settlements share similar challenges worldwide, including inadequate housing, overburdened infrastructure, inaccessible economic opportunities and facilities, and an immeasurable service-delivery problem, which negatively influence people's living conditions (Farha, 2018: 6).
South Africa is no different, as apartheid's legacy of racial- and class-based development continually manifests in highly fragmented socio-spatial development; peripheral informal settlements are highly urbanised but lack adequate housing, economic opportunities, services, and facilities (Tshikotshi, 2009: 1-8). The National Housing Forum (19921994) established guiding principles for non-racial housing delivery through public-private partnerships. The White Paper on Housing (1994) encouraged the development of integrated human settlements with access to opportunities, infrastructure, and services. The Housing Subsidy Scheme (HSS) (1994) offered once-off subsidies to households earning less than R3500 monthly. The private sector erected single-roomed Reconstruction and Development Plan (RDP) ('site-andservice') model houses. The RDP (1994) envisaged equal economic and service-delivery opportunities and prioritised housing quantity over quality (the 'breadth versus depth' debate) (Tissington, 2010: 32-33).
Breaking New Ground (2004) announced the establishment of sustainable human settlements through increased accessibility to economic opportunities, services, and facilities (DOHS, 2004). The Social Housing Policy (2005) offered rental/ cooperative housing options to low-income people, and the Inclusionary Housing Policy (2007) incentivised private-sector construction of racially integrated and income-inclusive residential neighbourhoods (Tissington, 2010: 51-52).
The DOHS launched the Upgrading of Informal Settlements Programme (UISP) (2004) for the incremental in situ upgrading of pre-existing informal settlements (DOHS, 2020a: 15-16). This established the Urban Settlements Development Grant, intended to supplement metropolitan municipal capital to update infrastructure and services to improve people's living conditions (SAHRC, 2021: 8). The South African Local Government Association (SALGA) provides a guiding framework for municipal backyard-dwelling strategies, including slowing the growth of backyard dwellings, customising informal rental market standards to alleviate housing backlogs, densifying well-located areas, and providing good-quality affordable accommodation (Tshangana, 2014: 20). The NDP (2012) focuses on transforming human settlements by increasing its sustainability and liveability, while the Spatial Land Use Management Act (2013) promotes inclusionary affordable housing within a land-use management framework. The Integrated Urban Development Framework (2016) emphasises liveable, safe, resource-efficient, and socio-economically inclusive cities (DOHS, 2020b: 14-16).
Gauteng's Department of Human Settlements (GDHS) introduced the Backyard Rental Housing Policy (2008) to address the increase of backyard structures, their non-compliance with building specifications, and to upgrade them to formally serviced two- to three-roomed homes (Lemanski, 2009: 475). The Gauteng Provincial Government's (2011: 23) 'Mega Projects: Clusters and New Cities' policy promotes a housing-policy shift away from the RDP-housing model towards the development of large-scale integrated human settlements close to existing informal settlements and unemployment clusters. The Spatial Development Frameworks of the metropolitan municipalities acknowledge the importance of upgrading informal settlements and implementing backyard strategies and informal settlement formalisation and upgrading programmes (Topham, 2011).
Despite all these efforts, the UISP is implemented inconsistently across South Africa (SAHRC, 2021: 7). Gauteng missed its 2019/2020 upgrading targets for informal settlement households by 25%, while the City of Johannesburg (CoJ) and Ekurhuleni (EMM) outperformed the City of Tshwane (CoT) in this regard (Ngqakamba 2021). Housing demand continues to outpace supply in South Africa (Shapurjee, Le Roux & Coetzee, 2014: 20; Tissington, 2010: 11), with 13.9% and 5.9% of people residing in informal and traditional dwellings, respectively (StatsSA, 2016). Approximately 1 in 7 South African households are informal dwellings, and in the metropolitan municipalities this number is 1 in 5 (SERI, 2018: 6). According to StatsSA (2001, 2011), main shack occupancy grew from 12% (2001) to 20% (2011), while backyard dwellings increased from 62% to 67%. In addition, Gauteng's metropolitan municipalities experienced a 1.59 times increase in rented backyard rooms from 2001-2011, while main and backyard shacks increased 1.79 times and 1.84 times, respectively.
"Informality characterised by poor living conditions and [socio-economic] exclusion [remains one of the most] critical challenges in [South Africa]" (SERI, 2018: 5). Informal settlements are also characterised by illegality, informality, inappropriate locations, restricted access to public- and private-sector investments, poverty and vulnerability, as well as social distress. The SAHRC (2021) confirms this consistent non-delivery to the poor in Gauteng's informal settlements (Ngqakamba, 2021), which negatively impacts on living conditions. Mabin (2020: 465-466) summarises the literature's main problems with post-apartheid housing policies as a continued focus on capitalist agendas prioritising low-density, detached, freehold forms of housing. In addition, there is a skewed geographical pattern of subsidised housing delivery to the poor, with limited expansion of affordable rental accommodation. Shapurjee et al. (2014: 25) reiterate the importance of determining how different types of dwellings influence quality-of-life indicators. The Minister of Human Settlements emphasised the importance of developing a new financing model and legislation in achieving sustainable human settlements that encourage improved quality of household life (Mabin, 2020: 454).
This article aims to determine changes in the living conditions of people residing in main and backyard shacks, and backyard rooms in the CoJ, CoT, and EMM from 2001 to 2011. The aim was achieved through the following objectives: computing percentages for the socio-demographic, socio-economic, ownership of household goods, and service-delivery characteristics of people; calculating an average living conditions index (LCI) for both years, and mapping the spatial distribution (and clustering of higher and lower values) of the average LCI scores through thematic mapping and hot spot analyses for both years. This article uses the following definitions: main and backyard shacks are informal dwellings constructed with non-permanent materials. The former is found mostly in informal settlements or on non-residential land. The latter mostly develops in townships, subsidised housing, or RDP-housing areas, and is separated from the main house/ shack, but still share the services of the yard. Backyard rooms are formal dwellings constructed with permanent building materials separated from the main house/ shack, but still share services within the yard. Only backyard rooms that are rented out as accommodation are used in this article, but they can be used for various purposes. These dwellings are found mostly in townships and subsidised housing areas and can take the form of RDP houses (StatsSA, 2011).
2. LITERATURE REVIEW
2.1 Understanding the theory of living conditions (QOL) and housing satisfaction
The term 'living conditions' is multidimensional and relates to QOL and well-being, which forms the theoretical foundation of this study. QOL refers to people's (dis) satisfaction with their surrounding physical conditions, or the extent to which external factors make people's living conditions (in)adequate. (In) adequate living conditions, in turn, are influenced by people's ability to fulfil their lower order 'deficit needs' (shelter, food, water, rest) before attaining higher order 'being-needs' (self-actualisation and self-fulfilment) (Poston, 2009: 348). The term QOL originated in the early 19th century as scientists studied the positive and negative influences of urban industrial development on individuals. Migration to cities offered many opportunities to ascend the socio-economic ladder and improve QOL, but negative externalities included societal heterogeneity, declining family and kin-group membership, weaker social bonds, and isolation. More recently, the quality and characteristics of the built environment are incorporated into QOL studies (Berry & Okulicz-Kozaryn, 2009: 117-120).
QOL is measured objectively or subjectively. Objective measures comprise social indicators that are easily defined, measured, quantified, and compared, and are thus considered more accurate. Critiques include its potential fallacy in subjective decisions influencing what constitutes objective measurements, and difficulty in determining what constitutes optimum QOL levels. Subjective measures are people's perceptions, preferences, and experiences and, therefore, accurately capture people's perspectives on their lives. The difficulty in extrapolating subjective measures to the wider population does, however, raise questions about its reliability and validity (Diener & Suh, 1997).
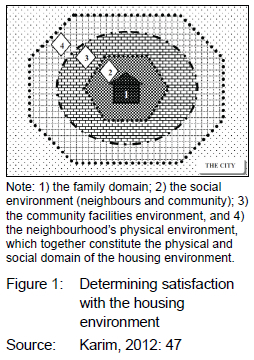
This article specifically explores the intersection between QOL and housing satisfaction through objective measurements. People's experiences of the built environment (and its characteristics) also improve or worsen their living conditions (Gulyani & Bassett, 2010: 2202). The interaction between objective and subjective QOL measures results in four possible housing-satisfaction outcomes: well-being, dissonance, adaptation, and deprivation. Residing in luxurious accommodation is generally associated with greater levels of 'well-being'. 'Dissonance' is experienced when people are dissatisfied with their living conditions, even though they are adequate. 'Adaptation' indicates the opposite effect, i.e., people are satisfied with their living conditions, even though they are inadequate. 'Deprivation' implies having poor living conditions and believing they are poor (Karim, 2012: 46). Chronic dissatisfaction and deteriorating living conditions will occur if people are dissatisfied with their homes and built environment but are unable to move or alter their situation, due to limited resources and/or money (Ukoha & Beamish, 1997: 446). Various factors influence people's satisfaction with their homes and the built environment (Gulyani & Bassett, 2010: 2202). Overlapping physical and social domains influence housing satisfaction through a cause-and-effect relationship: the physical domain comprises the house, infrastructure, community and recreational facilities, and the neighbourhood's physical environment; the social domain includes family, neighbours, and the local community. The interaction between these domains often determines people's satisfaction with their living conditions (Figure 1) (Karim, 2012: 47-48).
Gulyani & Bassett's (2010: 2202-2206) 'living conditions diamond' identifies four composite and interrelated factors influencing people's satisfaction with their homes and built environment, including the importance of tenure status, infrastructure and service provision, housing quality, as well as neighbourhood quality and location (Figure 2).
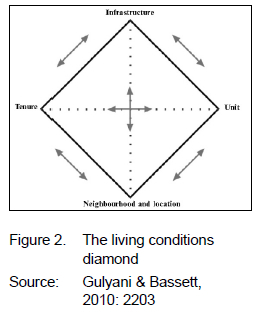
'Tenure status' constitutes several categories: the type of tenure, the level of tenure formality (security), the tenure mix, and the duration of the stay. Having security of tenure is associated with a decreased chance of eviction, longer residency, and improved QOL. Access to infrastructure and services is determined by examining its (il) legality, public/private provision, reliability, and affordability. Improved access to well-functioning infrastructure and services increases people's QOL. Housing quality refers to the appropriate design, construction, and maintenance of houses. The durability of the building materials used to construct the roof, foundations, and walls, the structural integrity of houses, and the number of occupants residing in the house can influence people's QOL. Permanent building materials and a reduction in occupancy generally improve people's QOL. The spatial location, density, physical layout, and quality of the services all influence the quality of the neighbourhood and living conditions. People residing in centrally located areas close to various socio-economic facilities and well-delivered services generally enjoy an improved QOL. For the poor, the optimum housing location often involves a trade-off between job accessibility, public transportation opportunities, centrality to facilities and amenities, and housing quality, which, in turn, influence QOL (Gulyani & Bassett, 2010: 2202-2206). This article examines specifically the living conditions within different types of housing environments (i.e., different types of informal dwellings), classified according to socio-demographic, socio-economic, ownership of household goods, and service-delivery characteristics. The remaining literature thus expands on each of these.
2.2 Socio-demographic characteristics
The socio-demographic characteristics of the residents of informal settlements include gender, age, race, and household size. Men mostly inherit land and/ or properties under customary practices, allowing for subdivision and the leasing of accommodation (Charlton, 2004: 18). Married women cannot obtain additional housing subsidies if their husbands already receive a subsidy, and do not qualify for home ownership in the case of divorce (Mabandla, 2003: 16). Men are generally considered the family breadwinners (Gaibie & Davids, 2009: 9) and will migrate to cities in search of employment opportunities, thus increasing their presence in informal settlements (UN-Habitat, 2003: 216). Conversely, women are mostly responsible for home and child-rearing activities, but have limited resources and input into decision-making, leaving them more vulnerable (Bank, 2007: 215-216; Greyling & Treganna, 2017: 909). Some women do, however, establish their own informal-settlement homes, enter informal-sector employment, and access gender-support structures to provide for their children (Meth, 2017). However, the vast majority of single, uneducated, and poor women are obligated to rent accommodation (Bank, 2007: 217).
Younger individuals reside mostly in informal backyard rented accommodation (Kowaltowski et al., 2006: 1106), while the elderly are landowners (Sendi & Mali, 2015: 28; Taylor, Banda & Mwanangombe, 2015: 33), and not generally as positive about their living conditions and prospects as these younger individuals (Crankshaw, Gilbert & Morris, 2000: 846; Gaibie & Davids, 2009: 11). Sometimes, family and/or friends live together (Tshangana, 2014: 6; UN-Habitat, 2003: 116), and in certain cases strangers also cohabit (Bank, 2007: 116; Lemanski, 2009: 476, 479; Taylor et al., 2015: 35), especially among extremely poor households residing in rent-free accommodation (UN-Habitat, 2003: 111).
Racially and ethnically marginalised communities continue to suffer a disproportionately poorer access to housing, infrastructure, and services (Huchzermeyer, 2003: 591; UN-Habitat, 2003: 145), sited as they are, usually on cheaper land on the periphery of cities (Greyling & Tregenna, 2017: 909; Tshikotshi, 2009: 29). During apartheid, Black people in South Africa were denied the right to land ownership, forcing them to live on the urban periphery (SERI, 2018: 14). This situation has remained largely unchanged, even in the post-apartheid era (Gaibie & Davids, 2009: 20).
2.3 Socio-economic characteristics
Informal settlements are predominantly located on the periphery of large cities (UN-Habitat, 2003: 84), as people search for better living conditions closer to factories and agricultural practices (Darkey & Visagie, 2013: 305; Mahabir et al., 2016: 403; Richards, O'Leary & Mutsonziwa, 2007: 387). Owing to the intransience and unsustainability of these settlements, residents are less resilient, and consequently unable to ensure their overall well-being (Mahabir et al., 2016: 402). With widespread unemployment and a high dependence on social grants, residents are marginalised in societal structures of very poor living conditions (Greyling & Tregenna, 2017: 908; Tshikotshi, 2009: 83). Higher levels of education offer more opportunities for employment and thus income, which decreases emotional and physical distress and improves personal freedom and well-being (Gaibie & Davids, 2009: 13). Well-educated people are more likely to be employed in formal jobs (Taylor et al., 2015: 37), yet even informal employment opportunities have their value, allowing family and kinship groups to work together in adapting their knowledge to function within competitive markets (i.e., adapting the jobs undertaken to the needs of the surrounding formal communities) (Mahabir et al., 2016: 402).
Consequently, the income levels of informal settlement residents influence the type of informal dwellings that are rented. The poorest stay mostly in shanties or shacks, and those with slightly more income stay in informal settlements, but the highest earners rent backyard rooms (Crankshaw et al., 2000: 849; Govender et al., 2011: 335; Turok & Borel-Saladin, 2016: 384; UN-Habitat, 2003: vi).
Rented backyard dwellings near employment opportunities are cheaper than township properties and offer more convenience for alternative job-seeking (Lemanski, 2009: 478, 481). In the case of South Africa, race and income remain inextricably linked (Moller, 2004: 35-36), the result being that Black informal settlement dwellers generally experience poorer living conditions.
It is not only absolute income, but also the perception of one's income in relation to that of others that influences well-being (Gaibie & Davids, 2009: 15). Income distinction also influences the percentage of money allocated to household budgets, but the order in which money is allocated rarely changes: first priority is food, then transport, and finally housing. Housing rental takes a significant proportion of informal settlement budgets (Sendi & Mali, 2015: 29).
Therefore, it is cheaper to rent main shacks for roughly R200 per month, compared to backyard shacks costing between R200 and R500, and even backyard rooms of over R500 (Lemanski, 2009: 481). Govender et al. (2011: 339) estimate that the rent in state-funded houses is between R600 and R1200 per month, excluding water and electricity charges, whereas the median rent for backyard shacks was R150. More recent estimates indicate that rent varies based on the location and access to services. People paid roughly R500 per month on average for shacks in Cape Town, with an additional fixed amount of R100-R150 for electricity. Shacks are also self-made or prefabricated at a cost of roughly R3,000. Rents for backyard rooms vary from approximately R1,500 (12m2-15m2 room with shared toilet and shower, excluding water and electricity) to R2,200 (18m2 room, including water and ensuite facilities) (Scheba & Turok, 2020:119-120). Cheaper rentals improve tenants' spending power on other necessities such as education, household goods, and services, which positively influence living conditions (Govender et al., 2011: 335). Likewise, the resulting available income increases the spending power on household goods (Kowaltowski et al., 2006: 1101, 1106; Richards et al., 2007: 379; Turok & Borel-Saladin, 2016: 385).
2.4 Housing characteristics
Rapid population growth and urbanisation increasingly complicate the match between housing supply and demand, which inevitably increases the growth of informal settlements, characterised by poor-quality housing, overcrowded and unhealthy living conditions, illegal land occupation, tenure insecurity, and inaccessible infrastructure, services, and facilities (UN-Habitat, 2020: 33).
Generally, the durability of building materials used to construct the roof, foundations, and walls determines the structural integrity of houses. The temporary building materials used to construct main and backyard shacks are vulnerable to cracks, degradation, fires, and collapse. Examples of these materials include rough timber/ wood, corrugated iron, mud, old metal sheets, plastic, cardboard, palm fronds, and bamboo (SERI, 2018: 12; Westaway, 2006: 180). Where concrete is used, it is often of poor aggregate consistency (Ukoha & Beamish, 1997: 449), resulting in houses of inferior quality, which, in turn, negatively influence living conditions (Govender et al., 2011: 335; Gulyani & Bassett, 2010: 2202).
Conversely, backyard rooms are more formal structures constructed with approved building materials such as cement and bricks that improve living conditions (Gaibie & Davids, 2009: 12; Taylor et al., 2015: 31).
In addition, main shacks are often built on illegally occupied land, or land not authorised for residential use (Huchzermeyer, 2003: 592; Tshangana, 2014: 11), where it could be dangerous and difficult to build (Mahabir et al., 2016: 403; Tshikotshi, 2009: 4). This negatively impacts on overall living conditions (Darkey & Visagie, 2013: 305). Although the dwellings are more substantial, renting backyard shacks creates an insecurity of tenure, as landlords have authority over eligibility, fees, and yard rules (Bank, 2007: 212). Some landlords offer rental contracts that are registered with the authorities, while others never formalise the tenancy arrangements, because they reside on the property themselves to supervise it (Sendi & Mali, 2015: 30). This, in turn, leads to the unwillingness of residents to contribute to upgrading their houses, infrastructure, and services, which again negatively impacts on living conditions (Gulyani & Bassett, 2010: 2210; Mahabir et al., 2016: 405).
Insufficient (overcrowded) and unhealthy conditions also have a negative influence on residents' living conditions. Houses often comprise only one or two rooms, yet these fulfil multiple functions. This forces residents to share spaces (Crankshaw et al., 2000: 851), and limits the number of household goods and assets (Kowaltowski et al., 2006: 1101, 1106; Oldewage-Theron et al., 2005: 25). Overcrowded spaces also lead to ill-health (Crankshaw et al., 2000: 851; Shapurjee et al., 2014: 26; Westaway, 2006: 178), through poor ventilation, inadequate hygiene practices, and various diseases (Darkey & Visagie, 2013: 304; Govender et al., 2011: 341; Richards et al., 2007: 376).
2.5 Service-delivery characteristics
Adequate drainage, sewerage systems, infrastructure, and other basic services are generally not considered when building informal settlements and can undermine residents' overall health and livelihoods (SERI, 2018: 7&12). A lack of basic services has consistently been found to decrease people's living conditions substantially. Consequently, residents of informal settlements are struggling disproportionately (Gaibie & Davids, 2009: 17; HDA, 2013: 29, 33, 37). People residing in backyard rooms generally experience better service delivery, which positively influences their living conditions (Lemanski, 2009: 476-477).
Site-planning and management problems such as street layout, the marking of territory, and the orientation of homes are particular problems (Kowaltowski et al., 2006: 1109). The approaches to upgrading informal settlements are criticised at four major levels, including failed financial commitments, negative socioeconomic impacts, non-replicability of best practices, and insecurity of tenure (Mahabir et al., 2016: 405).
Access to water is a basic human right. South African municipalities are obligated to provide a minimum level of water service to all residents, yet this often takes the form of communal standpipes along roads or at inconvenient locations along the perimeters of informal settlements (SERI, 2018: 8). Many people must walk great distances to access water (Turok & Borel-Saladin, 2016: 397; UN-Habitat, 2003: xxx). For electricity, many residents resort to illegal connections to the mains electricity supply, putting additional pressure on electricity services and creating hazardous conditions, which increase the risk of shacks catching fire (Govender et al., 2011: 339). Conversely, backyard room occupants are more likely to have electronic household goods such as refrigerators, computers, and televisions (Turok & Borel-Saladin, 2016: 385). Malfunctioning toilets and inadequate storm-water drains create unhygienic conditions (Richards et al., 2007: 379; Westaway 2006: 180). Also common among informal dwelling occupants is sharing toilets, taps, and bathrooms, all of which can lead to health-related problems (Tshikotshi, 2009: 90; Turok & Borel-Saladin, 2016: 387, 397), which again negatively influence living conditions (UN-Habitat, 2003: 131).
3. STUDY AREA
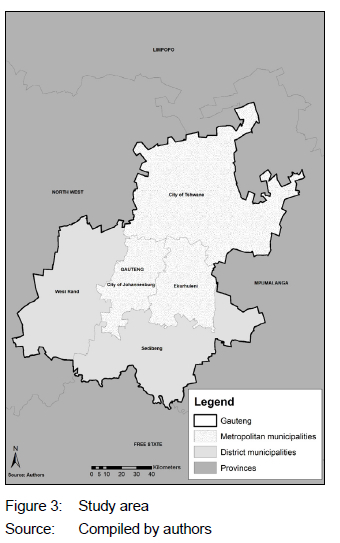
Gauteng is the smallest province in South Africa, with a total land area of only 18,170km2 comprising three metropolitan municipalities (the CoJ, CoT, and EMM) and two district municipalities (Sedibeng and West Rand) (Figure 3). Gauteng comprises the largest urban agglomeration in the country with the strongest economic hub focusing on trade, commerce, and industrial development (Gotz, Wray & Mubiwa 2014: 43). Gauteng's metropolitan municipalities were selected because they contribute significantly to the South African economy (Alexander, 2018).
The CoJ is home to roughly 5.5 million people, making it the largest municipality by population size (COGTA, 2020a: 5, 10). Its significant contribution to the country's GDP is driven by the extensive development of the finance, mining, and manufacturing sectors and, inter alia, its position as a financial and technological hub of innovation, research, and development driven by various public-private sector initiatives. As the financial capital of the country, housing the largest stock exchange on the continent, it is not surprising that the CoJ houses over 70% of the headquarters of South African companies (COGTA, 2020a:
5, 7). Contrasting living conditions and inequality are, however, evident in the CoJ (COGTA, 2020a: 15) as significant developments in areas such as Rosebank, Sandton, Midrand, and Fourways and various inner-city regeneration initiatives showcase its unique African and world-class regional economic character, juxtaposed with fast-growing informal settlements and townships such as Alexandra and Soweto attracting poorer migrants and refugees in search of better opportunities (COGTA, 2020a: 5, 7).
The CoT is the administrative capital of South Africa and houses the headquarters of the various national government departments and approximately 135 embassies. It is the largest metropolitan municipality in Gauteng in terms of size but hosts the smallest population of just over 3.5 million people (COGTA, 2020b: 6, 8, 10). The CoT is the second biggest contributor to Gauteng's GDP through the community services, finance, and trade sectors, and to a lesser extent the manufacturing sector (COGTA, 2020b: 21). Like the CoJ, the CoT's spatial development shows contrasting living conditions and inequality, with economic growth mostly located in the CBD and along nodes and corridors in Brooklyn, Centurion, Hatfield, Akasia, and Bronkhorstspruit. Conversely, the peripheral township areas remain largely underserviced (for example, Mamelodi to the east, Atteridgeville to the west, and Hammanskraal and Soshanguve towards the south), while the northern parts towards Limpopo and the eastern parts towards Mpumalanga are largely characterised by agricultural activities (COGTA, 2020b: 29).
EMM is well administered and received clean and unqualified audits over the past few years, but it remains a challenge to house a growing population of roughly 3.7 million people in a highly urbanised environment comprising five of the most populated township areas in South Africa. In addition, the unemployment rate (31.6%) in EMM is higher than the provincial and national averages (COGTA, 2020c: 5-7). Nonetheless, EMM contributes to nearly a quarter of Gauteng's economy and a third of the national GDP and is often referred to as 'Africa's workshop' dominated by the manufacturing, finance and business services, community services, general government sectors and, to a lesser extent, the trade and hospitality sectors (COGTA, 2020c: 8, 21). In addition, EMM has many well-developed commercial, industrial, and manufacturing value chains in growing industrial and profitable regions, including Germiston, Alberton, Boksburg, Benoni, Springs, and Nigel, among others. Socioeconomic development in the EMM is largely skewed towards the OR Tambo International Airport located roughly 10km from the CoJ border, with future spatial planning initiatives envisaged closer to the eastern spatial periphery of the metropolitan area (Gotz et al. 2014: 42-43).
Informal settlements along the mining belt remain largely underdeveloped, due to the unsuitability of dolomitic conditions limiting strategic housing, infrastructure, and service-delivery initiatives (COGTA, 2020c: 6). Four major concentrations of historically disadvantaged communities are evident on the periphery of the EMM, including the communities of Tembisa, Kathorus complex, Kwatsaduza complex and Daveyton/ Etwata complex (COGTA, 2020c: 34).
4. METHODOLOGY
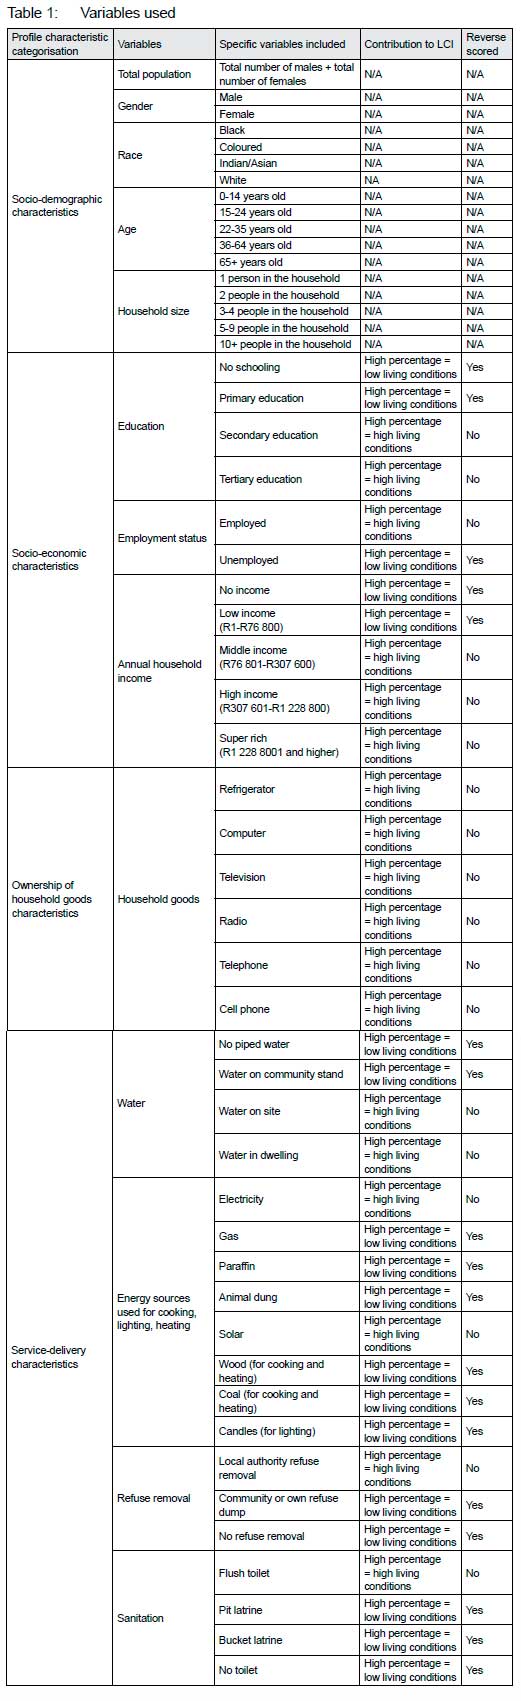
This study used a quantitative design to determine changes in the living conditions of people residing in main and backyard shacks, as well as backyard rooms in the CoJ, CoT, and EMM from 2001 to 2011. The aim was achieved through the following objectives: computing percentages for the socio-demographic, socio-economic, ownership of household goods, and service-delivery characteristics of people; calculating an average LCI for both years, and mapping the spatial distribution and clustering of higher and lower values of the average LCI scores through thematic mapping and hot spot analyses for both years. Table 1 indicates the variables used in the study.
4.1 Characteristics data
In this study, Census 2001- and 2011-unit record data were used (StatsSA, 2001; 2011), due to the difficulty in obtaining more recent spatially joined data for informal settlements in South Africa. The authors acknowledge that the Census 2001 and 2011 data are old and could constitute a data limitation of this study. However, in the absence of more recent spatially joined data for informal settlements covering a variety of variables represented on lower geographical (spatial levels) over two time periods for comparative purposes, it was the best data source to use. To achieve the first objective, the variables were categorised according to four profile characteristics, each with its own sub-sets (Table 1). Excel was used to calculate percentages, after which stacked column charts were created for the profile characteristics of tenants residing in the three dwelling types in the three municipalities for 2001 and 2011.
4.2 Living conditions index
To achieve the second objective, the variables were categorised as either positively or negatively contributing to people's living conditions (i.e., in the case where higher percentages would result in improved living conditions, the variables were scored as 'high percentage = high living conditions', and vice versa for deteriorating living conditions - 'high percentage = low living conditions') (Table 1). To accommodate the difference in the interpretation of higher percentages (i.e., it can result in improved or deteriorating living conditions), the 'high percentage = low living conditions' were reversed scored. The aim of reverse scoring is thus to 're-code' the responses so that a high score is transformed into the corresponding low score on the scale. The means were calculated for all the main places across all the applicable variables to obtain an average LCI score per main place for 2001 and 2011.
4.3 Mapping the spatial distribution and clustering average LCI scores
To achieve the third objective, the average LCI scores were mapped thematically, and hot spot analyses were performed for the three dwelling types in all the municipalities for both years. Thematic maps are used to portray geographic patterns of various aspects within different areas. Hot spot analysis determines the spatial geographic distributional clustering of the high (hot spots) and low (cold spots) values of the average LCI scores. It uses the standard deviation values (GiZScore) ranging from below -2.58 to above 2.58. High positive z-scores indicate clustering of higher values (hot spots) (represented in red on the colour maps/shades of grey on the printed maps), while low negative z-scores indicate clustering of lower values (cold spots) (represented in blue on the colour maps/with cross-hatched/dotted polygon symbols on the printed maps). The intensity of the variation in red and blue colours indicates the intensity of the average LCI scores. Hot spots thus represent areas with better average LCI scores, while cold spots indicate areas with lower average LCI scores. Likewise, darker red colours show better average LCI scores, while the darker blue colours display lower average LCI scores (Shapurjee et al., 2014: 22).
5. FINDINGS
5.1 Profiling changing characteristics of the dwelling types
5.1.1 Socio-demographic characteristics
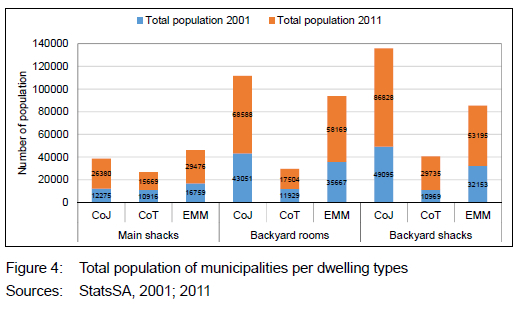
The socio-demographic characteristics include the total population, race, gender, age, and household size (StatsSA 2001; 2011). The population increased in all the dwelling types in all the municipalities from 2001 to 2011 (Figure 4). Main shacks remained the least popular in all the municipalities (2001-2011). Backyard shacks were prevalent in the CoJ in both years, with the CoJ and EMM experiencing a 2.3% and 2.5% growth in 2011, respectively. Likewise, the CoJ and EMM had the highest number of backyard rooms in both years. Although backyard rooms were the most popular form of housing in the CoT in terms of relative numbers in 2001, it is the significant growth in backyard shack numbers in 2011 that is the most worrying.
Given South Africa's racially based past, it is not surprising that approximately 95% of people in all three dwelling types in all the municipalities were Black in both years. The White urban poor who mostly resided in backyard rooms in 2001 possibly moved to formal dwellings in other neighbourhoods (Gaibie & Davids, 2009: 5; Turok & Borel-Saladin, 2016: 399). Men migrate mostly in search of better living conditions (UN-Habitat, 2003: 216), and thus reside mostly in the three dwelling types in all the municipalities. Overall, 68% of men occupied mostly backyard shacks (2001), while 74% and 79% of men in the CoJ and EMM, respectively, resided in main shacks (2011). Conversely, women resided mostly in main shacks in 2001 in all the municipalities, but a third stayed in backyard rooms in 2011.
Not surprisingly, the 22-35-year-olds co mprised the largest age group in the three dwelling types in all the municipalities (between 65% and 73% in 2001 and 2011). The 36-64-year-olds comprised the second largest age group. Main shacks were the most popular among the 22-35-year-olds in the CoJ (2001 and 2011) and CoT (2001). Backyard shacks were the most prevalent among roughly 73% of 22-35-year-olds in the CoT and roughly a third of 36-64-year-olds in the EMM (2011). Approximately 73% of 22-35-year-olds in EMM resided in backyard rooms (2001 and 2011), while the popularity of backyard rooms grew amongst 36-64-year-olds in all the municipalities in 2011.
One-member households dominated among all the dwelling types in all the municipalities and showed substantial increases (between 7% and 31%) from 2001 to 2011. Considerable decreases in larger households are evident in all the municipalities and dwelling types from 2001 to 2011. Roughly a third of 3-4-member households resided in main shacks in all the municipalities in 2001, while backyard shacks were more prevalent among 44% of CoJ tenants, and 48% of EMM tenants, in 2011. Larger households of 5-9 people were more inclined to stay in main shacks in all the municipalities in both years.
5.1.2 Socio-economic characteristics
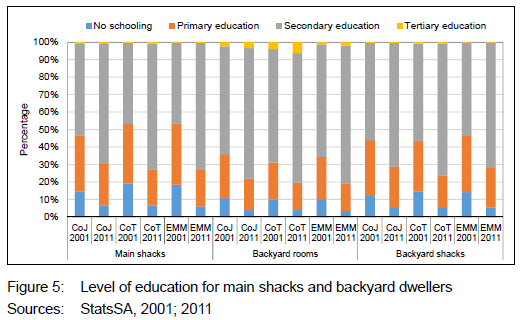
Contrary to popular belief (Oldewage-Theron et al., 2005: 17; Turok & Borel-Saladin, 2016: 392), between 71% and 83% of people in all dwelling types in all the municipalities were well-educated with a secondary education, and the percentages increased in 2011 (Figure 5). Those with no education or only primary schooling decreased significantly. People with secondary and tertiary education resided mostly in formal backyard rooms in all the municipalities in both years. Main shacks were popular among those with no education or only primary schooling in all the municipalities in 2001 and 2011. The only exception was 26.22% of people with primary education who lived in backyard shacks in EMM in 2011. Backyard room occupants studied a wider variety of educational fields in 2001 and 2011, while those in main and backyard shacks were more inclined to utilise their skills to start their own businesses.
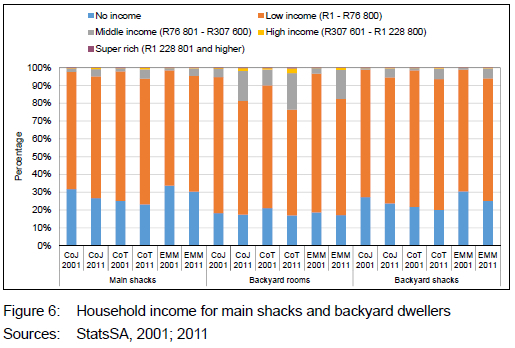
People were predominantly employed in all the dwelling types and municipalities, with increasing percentages in 2011. Roughly three-quarters resided in backyard rooms in all the municipalities (2001 and 2011). Although the percentage of the unemployed declined significantly from 2001 to 2011 in all the dwelling types and municipalities, main shacks remained the most prevalent. Occupants of all the dwelling types and municipalities lived mostly in extreme destitution in 2001 and 2011; approximately 60%-78% of households had a low-income (R1-R76 800) (Figure 6). Interestingly, despite this, they resided mostly in backyard rooms in the CoJ and EMM (the most expensive housing option of the three) and in backyard shacks in the CoT in 2001. This pattern changed drastically in 2011 as the CoJ experienced a 12.19% drop, while the CoT had a 9.44% decline, and EMM decreased by 12.31%. Conversely, backyard shacks became more prominent among the low-income group in all the municipalities in 2011. Albeit lower percentages, middle-income occupants also resided mostly in backyard rooms, owing to higher education and income levels (Crankshaw et al., 2000: 849; Govender et al., 2011: 335). Main shacks were mostly occupied by tenants with no household income in all the municipalities (2001 and 2011).
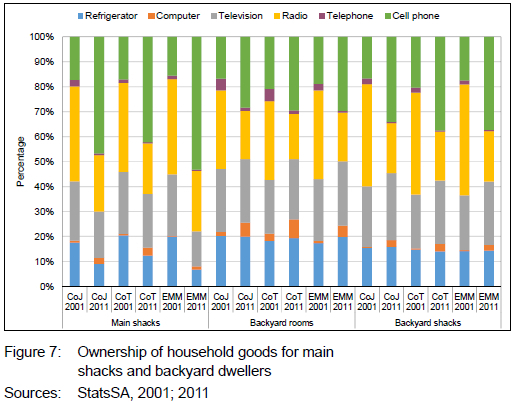
Backyard room tenants who have mostly middle and high incomes in all the municipalities were able to afford electricity to power electrical goods such as refrigerators and computers (Figure 7). Radios and televisions can be operated using batteries and were thus popular household items in all the dwelling types and municipalities in 2011, but especially in main and backyard shacks. Cell phones replaced the radio as the most popular household item in all the dwelling types and municipalities in 2011, with over 88% owning cell phones. Because of connectivity to the internet, a user can easily access job opportunities, thus making the cell phone a crucial household item (Oldewage-Theron et al., 2005: 25).
5.1.3 Service-delivery characteristics
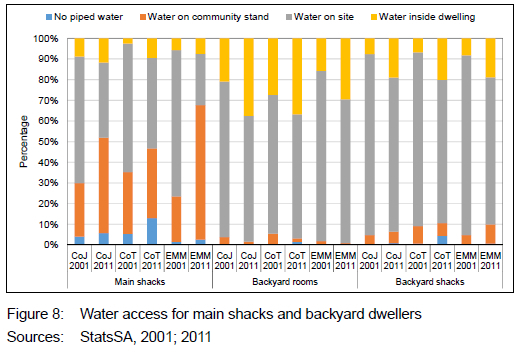
Despite declining percentages, the dwellings and municipalities accessed water mostly on-site (Figure 8), except for main shacks in the CoJ and EMM who retrieved water mostly from the community stand in 2011. Main shack tenants were more likely to have no water (especially for 13.04% of CoT tenants in 2011) and had to walk greater distances (more than 200m) to get it. Most backyard rooms benefitted from water in the dwelling in all the municipalities, with percentages increasing between roughly 9% and 18% in 2011.
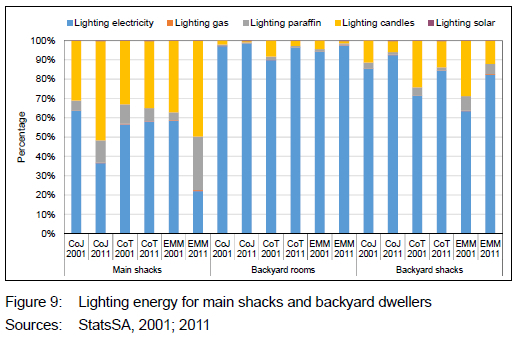
Backyard rooms and shacks were more inclined to use electricity as a form of lighting in 2001 and 2011 in all the municipalities (Figure 9), while candles and paraffin were more popular among residents in the main shacks, and to a lesser extent for backyard shacks. Likewise, backyard rooms and shacks used electricity mostly tor cooking and heating purposes in all trie municipalities in both years, while roost main shacks cooked with paraffin. Main shacks mainly used coal for heating in all the municipalities in 2001, and candles for lighting in 2011.
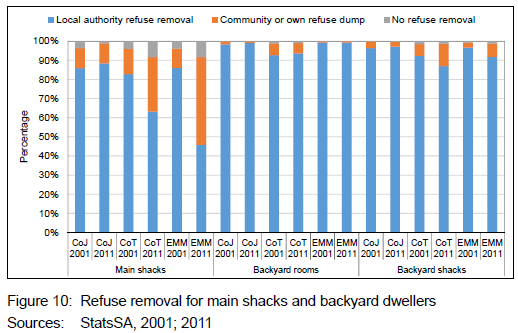
The local authority generally removed the refuse from all the dwelling types and municipalities in 2001 and 2011 (Figure 10). In the CoT and EMM, both types of shacks, but main shacks in particular, experienced substantial decreases in the removal of their refuse by the local authority in 2011. This increased the creation of community or personal refuse dumps near the dwellings, while in other instances the refuse was not even removed.
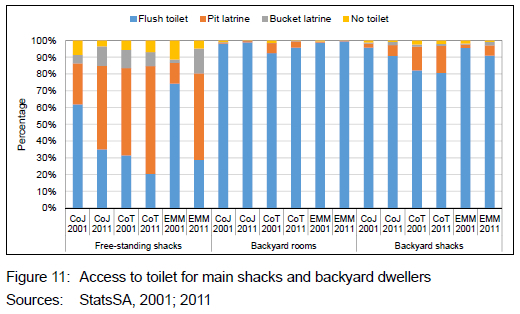
Over 90% of backyard rooms used flush toilets in all the municipalities, and the percentages increased in 2011 (Figure 11). Backyard shacks also predominantly used flush toilets, but percentages generally decreased by roughly 5% in the CoJ and EMM in 2011. Main shacks experienced significant decreases in the usage of flush toilets across all the municipalities in 2011, with sharp increases in the usage of pit latrines. Bucket latrines were more prevalent among main shacks, especially in EMM in 2011, while the nu mber of main shacks with no access to toilets increased slighfly in the (CoT in 2011.
5.2 Mapping the spatiality of living conditions
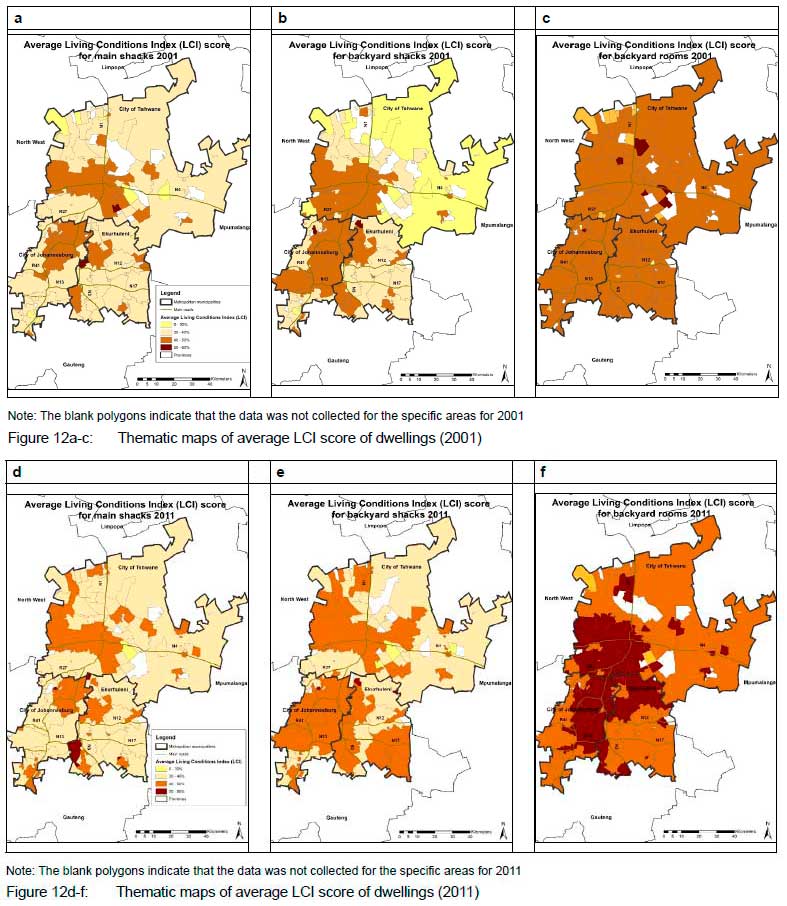
Thematic maps of the average LCI scores indicate that people in all the dwellings and municipalities generally experienced poor to average living conditions as none of the average LCI scores was higher than 60% (Figures 12a-f). Backyard rooms experienced the greatest improvements in their average LCI scores across the municipalities, as many households were categorised within the '50-60%' LCI category in 2011. The only noticeable exception is Zwavelpoort which experienced a decrease in its LCI score, while Winterveld remained unchanged (both were in the '0-30%' LCI category in 2011) (Figures 12c and f). Likewise, backyard shacks also experienced increases in the average LCI scores, as large parts of EMM moved from the '30%-40%' to '40%-50%' category, while the north-eastern part of the CoT moved from the '0%-30%' to '30%-40%' category. Decreases in the average LCI scores were, however, experienced in the region of Centurion in the CoT, especially close to the R27 (Figures 12b and e). Generally, the main shacks experienced the least significant changes in their average LCI scores (2001-2011) and have lower LCI scores overall as most areas fall in the '30%-40%' LCI category. EMM has the most areas with the highest LCI score ('50%-60%'), especially in Alberton, Centurion, and Geluksdal. Zwavelpoort in the CoT again experienced a decrease in its average LCI score among main shacks, while Rietfontein fell from the '50%-60%' to '40%-50%' LCI category (Figures 12a and d).
Hot spot analyses (Figures 13a-f) show that main shacks experienced higher average LCI scores in 2001 in the north-western parts of the CoJ, with the highest LCI score being observed in the Sandton and Alexandra areas (the darkest red). The boundary between the CoJ and EMM (along the N3 highway) and Kempton Park areas, and the western parts of the CoT closer to the CBD (along the N4 highway) show relatively high LCI scores (darker orange). The lowest LCI score is found in Soshanguve in the CoT (darkest blue), with the areas surrounding it also having lower scores, but not to the same extent (lighter blue). The northern areas along the R27 in the CoJ and southern parts also show a slight clustering of low LCI scores. Improvements in LCI score clusters were observed in the far southern parts of the CoJ and around the Midrand/Tembisa areas in the CoJ and EMM in 2011 among main shacks. The most observable changes were in the CoT where no apparent clustering of LCI scores dominated the map (yellow), while large parts along the N12 and N17 highways in EMM experienced a clustering of low LCI scores (Figures 13a and d).
The LCI clusters with the highest values for backyard shacks in 2001
were noted in Midrand and Alexandra (darkest red) and along the western parts of the CoJ and eastern parts of EMM along the N1, N3 and N13 highways (lighter red/orange). The CoT noticeably contained the lowest values of the average LCI scores for 2001 and 2011, with Waterval, Kleinfontein, and Tierpoort being particularly affected by the worst living conditions (darkest blue), and areas around the N1 and to the south of the N4. A decline is observed in the clustering of high LCI values in backyard shacks in the CoJ and EMM in 2011, while the far south-western parts of EMM (Duduza/Nigel/Tsakane areas) experienced an increase in their LCI scores (Figures 13b and e).
Backyard rooms experienced a clustering of high LCI values in Randburg in the CoJ, and, to some extent, in the Mooiplaas/Tierpoort areas in the CoT in 2001. Clusters with low LCI values were noted in the north-western parts of the CoT, especially in the Hammanskraal/ Bultfontein areas (darker blue), while slight clustering of lower LCI values were observed around Benoni (N12) in EMM. Great improvements in the LCI scores for backyard rooms generally occurred in 2011, especially in the CoJ and EMM. Midrand and its surrounds show clusters of the highest LCI scores (darkest red), while Johannesburg CBD, Kempton Park (EMM), and Centurion (CoT) also did relatively well. The clustering of lower LCI values generally remained in the same locations in the CoT in 2011 as in 2001, but the Winterveld area experienced a decline (Figures 13c and f).
6. DISCUSSIONS AND CONCLUSIONS
This study determined changes in the living conditions of people residing in main and backyard shacks, and backyard rooms in the CoJ, CoT, and EMM from 2001 to 2011. Results indicated that main shacks were the least popular form of housing in all the municipalities, due to their usually insubstantial building materials, and locations in dangerous and hazardous flood- and fire-prone areas. Backyard shacks are also constructed with temporary building materials but had slightly better service delivery (Lemanski, 2009: 473-474; StatsSA, 2011; Tshikotshi, 2009: 2, 88; Turok & Borel-Saladin, 2016: 387, 393), which could explain why it grew in popularity in 2011, especially in the CoJ and EMM. Backyard rooms are formal housing structures that could attract workers employed in the formal sector in economic hubs (Shapurjee et al., 2018: 23-24).
Black people continue to suffer disproportionately in informal settlements as the space economy remains highly fragmented along race-class lines (Darkey & Visagie, 2013: 303; Tshikotshi, 2009: 1-8).
Men are more likely to migrate to cities in search of better living conditions (UN-Habitat, 2003: 216). Their predominant presence in all three dwellings and municipalities is thus not surprising. However, a reversal in housing patterns according to gender was observed from 2001 to 2011. Men generally experienced a decrease in their living conditions as they resided in the poorest form of housing (main shacks) in 2011. Cheaper rentals in main and backyard shacks could increase remittances and spending on other necessities (Tshikotshi, 2009: 25). Conversely, women chose the most expensive housing (backyard rooms) offering the best shelter and security in 2011 (Bank, 2007: 211; StatsSA, 2011; Turok & Borel-Saladin, 2016: 394).
Younger working-age people (22-35-year-olds) were more inclined to migrate in search of better living conditions (HDA, 2013: 10; Oldewage-Theron et al., 2005: 17). When starting their careers, they generally cannot afford formal housing (Lemanski, 2009: 474), which could explain why they rented mostly cheaper main and backyard shacks. The popularity of backyard rooms, especially among the 36-64-year-olds in EMM, could be attributed to potential formal employment in nearby industrial areas. The elderly (65 years and above) are generally landlords and do not rent dwellings (Taylor et al., 2015: 35). Smaller household sizes again confirm that people migrated alone in search of better living conditions (Bank, 2007: 211; Sendi & Mali, 2015: 28), and possibly send money back home (Tshikotshi, 2009: 25). Main shacks were popular among larger groups because they often provide a greater number of larger rooms (StatsSA, 2011; Turok & Borel-Saladin, 2016: 396), and occupants can share money and resources (Crankshaw et al., 2000: 847).
Most people in all the dwellings and municipalities were well-educated, implying improved access to education post-apartheid. Higher levels of education are generally associated with higher levels of employment and higher paying jobs (HDA, 2013: 25; Lemanski, 2009: 477-478; Taylor et al., 2015: 37). This suggests that people can choose where to work and stay. For instance, backyard rooms were more popular among those with better education and higher incomes in all the municipalities (Crankshaw et al., 2000: 849). Higher education and income levels also enable people to purchase more household goods (Lemanski, 2009: 473; Richards et al., 2007: 379). Backyard rooms did, however, decrease in popularity among the low-income group in 2011, probably because landlords increased the rent for these formal structures (Bank, 2007: 212; Lemanski, 2009: 478). Conversely, the unemployed are most reliant on temporary informal employment and/ or government grants (Westaway, 2006: 183). This could explain why they resided mostly in the cheapest form of housing (main shacks).
Main shacks generally experienced the worst service-delivery situation (water, energy sources for cooking, heating, and lighting, refuse removal, and sanitation) in all the municipalities, while backyard rooms had the best service delivery. This is attributed to backyard rooms being formal housing structures (Lemanski, 2009: 474), while main shacks are constructed in inaccessible dangerous areas (Govender et al., 2011: 339, 341). These areas lack the infrastructure (Turok & Borel-Saladin, 2016: 389, 391) to supply clean drinking water (Gaibie & Davids, 2009: 17) and sanitation services (Lemanski, 2009: 482). Illegal electricity connections and communal refuse removal also create dangerous and unhealthy living conditions (Darkey & Visagie, 2013: 304; Oldewage-Theron et al., 2005: 25; Richards et al., 2007: 381; Westaway, 2006: 183-184).
People in all the dwellings and municipalities generally experienced poor to average LCI scores, with no scores being higher than 60%. This confirms findings from the literature that informal settlements, especially in Gauteng, consistently experience non-delivery (Nqakamba, 2021), so informal living remains critically challenged in terms of access to crucial socio-economic opportunities, infrastructure, and services (SERI, 2018: 5). Higher LCI scores were observed mostly among backyard rooms, which are formal housing structures with slightly better access to infrastructure and services in all the municipalities (Gaibie & Davids, 2009: 12; Shapurjee et al., 2018: 23-24). Backyard rooms also experienced the greatest improvements in their average LCI scores across the municipalities in 2011, as many households were in the '50%-60%' category.
Average LCI scores were higher closer to the main roads, CBDs, and larger regional nodal developments that offer more job opportunities in all the municipalities (Turok & Borel-Saladin, 2016: 388; UN-Habitat, 2003). This is especially evident in all the dwelling types (especially in 2011) in the northern parts of the CoJ areas (Midrand and Sandton), and the eastern parts of EMM around the Kempton Park and Tembisa areas located along the N1 and N3 highways.
Conversely, lower LCI scores were observed mostly among the main shacks in all the municipalities, aligning with findings from Westaway (2006: 175). This could be attributed to main shacks often being constructed in dangerous and hazardous areas (Mahabir et al., 2016: 403), on land typically not authorised for residential use (Huchzermeyer, 2003: 592; Tshikotshi, 2009: 4), and with temporary building materials (SERI, 2018: 12). Overall, the CoT experienced the lowest LCI scores across all the dwelling types. This aligns with the SAHRC report findings where the CoT under-performed in terms of the UISP, while the CoJ and EMM made concerted efforts to upgrade informal settlements (Ngqakamba, 2021).
The economic and investment opportunities are much more concentrated geographically than the population, creating a mismatched space economy with extensive unemployment and poverty, especially on the periphery of large cities. This spatial mismatch also creates dysfunctional and spatially exclusionary human settlements as poor informal settlement residents on the periphery of the large cities generally experience the worst living conditions (South African Government, 2019: 144). Results in the study confirm this, as the LCI scores were generally lower in all the dwellings in all the municipalities where informal settlements are located at the periphery of cities, away from busy highways and economic activities. In addition, access to facilities and amenities remains highly disproportionate along racial and class lines (Darkey & Visagie, 2013: 303; Richards et al., 2007: 383; Tshikotshi, 2009: 1-8), ensuring that poor residents of informal settlements remain trapped in vicious cycles of poverty (i.e., 'forgotten places') (Shatkin 2004: 2469), as they are unable to fulfil their most basic physiological needs (SAHRC, 2021: 7; UN-Habitat [United Nations General Assembly], 2015: 4). Table 2 provides an overview of the policy implications that can be deduced from this study.
REFERENCES
ALEXANDER, M.C. 2018. Infographic: Local government in Gauteng. s.l.: South African Gateway. [Online]. Available at: <https://southafrica-info.com/land/infographic-local-government-municipalities-gauteng-province./ [Accessed: 8 May 2022]. [ Links ]
BANK, L. 2007. The rhythms of the yards: Urbanism, backyards and housing policy in South Africa. Journal of Contemporary African Studies, 25(2), pp. 205-228. https://doi.org/10.1080/02589000701396298 [ Links ]
BERRY, J.L. & OKULICZ-KOZARYN, A. 2009. Dissatisfaction with city life: A new look at some old questions. Cities, 26(3), pp. 117-124. https://doi.org/10.1016/j.cities.2009.01.005 [ Links ]
CHARLTON, S. 2004. An overview of the housing policy and debates, particularly in relation to women (or vulnerable groupings). Research Report. Johannesburg: Centre for the Study of Violence and Reconciliation. [ Links ]
COGTA (DEPARTMENT OF COOPERATIVE GOVERNANCE AND TRADITIONAL AFFAIRS). 2020a. City of Johannesburg Metropolitan: Profile and analysis: District development model. Pretoria: COGTA. [ Links ]
COGTA (DEPARTMENT OF COOPERATIVE GOVERNANCE AND TRADITIONAL AFFAIRS). 2020b. City of Tshwane Metropolitan. Pretoria: COGTA. [ Links ]
COGTA (DEPARTMENT OF COOPERATIVE GOVERNANCE AND TRADITIONAL AFFAIRS). 2020c. City of Ekurhuleni Metropolitan. Pretoria: COGTA. [ Links ]
CRANKSHAW, O., GILBERT, A. & MORRIS, A. 2000. Backyard Soweto. International Journal of Urban and Regional Research, 24(4), pp. 841-857. https://doi.org/10.1111/1468-2427.00282 [ Links ]
DARKEY, D & VISAGIE, J. 2013. The more things change the more they stay the same: A study on the quality of life in an informal township in Tshwane. Habitat International, 39, pp. 302-309. https://doi.org/10.1016/j.habitatint.2012.10.016 [ Links ]
DIENER, E.D. & SUH, E. 1997. Measuring quality of life: Economic, social and subjective indicators. Social Indicators Research, 40(1), pp. 189-216. https://doi.org/10.1023/A:1006859511756 [ Links ]
DOHS (DEPARTMENT OF HUMAN SETTLEMENTS). 2004. Breaking new ground: A comprehensive plan for the development of sustainable human settlements. Pretoria: DOHS. [ Links ]
DOHS (DEPARTMENT OF HUMAN SETTLEMENTS). 2020a. 2019-2020 Human settlements Annual Report. Vote 38. Pretoria: DOHS. [ Links ]
DOHS (DEPARTMENT OF HUMAN SETTLEMENTS). 2020b. Revised Strategic Plan 2020-2025. Pretoria: DOHS. [ Links ]
FARHA, L. 2018. Report of the Special Rapporteur on adequate housing as a component of the right to an adequate standard of living and on the right to non-discrimination in this context. Session hosted by the Secretary-General to the General Assembly, 19 September 2018. [ Links ]
GAIBIE, F. & DAVIDS, YD. 2009. Quality of life among South Africans. Presentation made at the International Society for Quality of Life Studies (ISQOLS) Conference held 19-23 July. Florence: ISQOLS. [ Links ]
GAUTENG PROVINCIAL GOVERNMENT. 2011. Gauteng Spatial Development Framework 2030. Johannesburg: Gauteng Provincial Government. [ Links ]
GOTZ, G., WRAY, C. & MUBIWA, B. 2014. The thin oil of urbanisation? Spatial change in Johannesburg and the Gauteng city-region. In Harrison, P., Gotz, G., Todes, A., and Wray, C. Changing space, changing city: Johannesburg after apartheid, pp. 42-62. Johannesburg: Wits University Press. https://doi.org/10.18772/22014107656.6 [ Links ]
GOVENDER, T., BARNES, J.M. & PIEPER, C.H. 2011.The impact of densification by means of informal shacks in the backyards of low-cost houses on the environment and service delivery in Cape Town, South Africa. Environmental Health Insights, 5(5), pp. 23-52. https://doi.org/10.4137/EHI.S7112 [ Links ]
GREYLING, T. & TREGENNA, F. 2017. Construction and analysis of a composite quality of life index for a region of South Africa. Social Indicators Research, 131(3), pp. 887-930. https://doi.org/10.1007/s11205-016-1294-5 [ Links ]
GULYANI, S. & BASSETT, E.M. 2010. The living conditions diamond: An analytical and theoretical framework for understanding slums. Environment and Planning A, 42(9), pp. 2201-2219. https://doi.org/10.1068/a42520 [ Links ]
HAD (HOUSING DEVELOPMENT AGENCY). 2013. Gauteng informal settlements status (2013). Johannesburg: HDA. [ Links ]
HUCHZERMEYER, M. 2003. A legacy of control: The capital subsidy for housing, and informal settlement intervention in South Africa. International Journal of Urban and Regional Research, 27(3), pp. 591-612. https://doi.org/10.1111/1468-2427.00468 [ Links ]
KARIM, H.A. 2012. Low-cost housing environment: Compromising quality of life? Procedia - Social and Behavioral Sciences, 35, pp. 44-53. https://doi.org/10.1016/j.sbspro.2012.02.061 [ Links ]
KOWALTOWSKI, D.C.C.K., GOMES DA SILVA, V., PINA, S.A.M.G., LABAKI, L.C., RUSCHEL, R.C. & DE CARVALHO MOREIRA, D. 2006. Quality of life and sustainability issues as seen by the population of low-income housing in the region of Campinas, Brazil. Habitat International, 30, pp. 1100-1114. https://doi.org/10.1016/j.habitatint.2006.04.003 [ Links ]
LEMANSKI, C. 2009. Augmented informality: South Africa's backyard dwellings as a by-product of formal housing policies. Habitat International, 33, pp. 472-484. https://doi.org/10.1016/j.habitatint.2009.03.002 [ Links ]
MABANDLA, B. 2003. Keynote address: Promoting access for women in housing. Speech by the Minister of Housing MS Bridgitte Mabandla at the workshop: Promoting access for women in Housing, 8 August 2003. Woodmead, Johannesburg. [ Links ]
MABIN, A. 2020. A century of South African housing acts 1920-2020. Urban Forum, 31, pp. 453-472. https://doi.org/10.1007/s12132-020-09411-7 [ Links ]
MAHABIR, R., CROOKS, A., CROITORU, A. & AGOURIS, P. 2016. The study of slums as social and physical constructs: Challenges and emerging research opportunities. Regional Studies, Regional Science, 3(1), pp. 399-419. https://doi.org/10.1080/21681376.2016.1229130 [ Links ]
METH, P. 2017. How women and men experience the city: Gender in an informal urban context. Germany: Urbanet. [Online]. Available at: https://www.urbanet.info/gender-informal-urban-context/ [Accessed: 28 June 2021]. [ Links ]
MOLLER, V. 2004. Peaceful coexistence in South Africa in the millennium: A review of social indicators in the 2002 democracy study. Letters from Byblos No. 4. Byblos: International Centre for Human Sciences. [ Links ]
NGQAKAMBA, S. 2021. SAHRC report finds Gauteng's informal settlement projects need more monitoring. News24. 24 March 2021. [Online]. Available at: https://www.news24.com/news24/southafrica/news/sahrc-report-finds-gautengs-informal-settlement-projects-need-more-monitoring-20210324 [Accessed: 19 June 2021]. [ Links ]
OLDEWAGE-THERON, W.H., DICKS, E.G., NAPIER, C.E. & RUTENGWE, R. 2005. Situation analysis of an informal settlement in the Vaal Triangle. Development Southern Africa, 22(1), pp. 13-26. https://doi.org/10.1080/03768350500043794 [ Links ]
POSTON, B. 2009. An exercise in personal exploration: Maslow's hierarchy of needs. Thornton, Colorado: Everest College. The Surgical Technologist, August, pp. 347-353. [ Links ]
RICHARDS, R., O'LEARY, B. & MUTSONZIWA, K. 2007. Measuring quality of life in informal settlements in South Africa. Social Indicators Research, 81(2), pp. 375-388. https://doi.org/10.1007/s11205-006-9014-1 [ Links ]
SAHRC (SOUTH AFRICAN HUMAN RIGHTS COMMISSION). 2021. Report on the State of Human Rights in Gauteng: Towards ensuring the right to adequate housing through the upgrading of informal settlements. Braamfontein: SAHRC. [ Links ]
SCHEBA, A. & TUROK, I. 2020. Informal rental housing in the South: Dynamic but neglected. Environment & Urbanization, 32(1), pp. 109-132. https://doi.org/10.1177/0956247819895958 [ Links ]
SENDI, R. & MALI, B.C. 2015. Surviving in limbo: An insight into Slovenia's informal private rented housing sector. Theoretical and Empirical Researchers in Urban Management, 10(4), pp. 19-39. [ Links ]
SERI (SOCIO-ECONOMIC RIGHTS INSTITUTE OF SOUTH AFRICA). 2018. Informal settlements and human rights in South Africa. Submission to the United Nations Special Rapporteur on adequate housing as a component of the right to an adequate standard of living. Braamfontein: SERI. [ Links ]
SHAPURJEE, Y., LE ROUX, A. & COETZEE, M. 2014. Backyard housing in Gauteng: An analysis of spatial dynamics. Town and Regional Planning Journal, 64, pp. 19-30. [ Links ]
SHATKIN, G. 2004. Planning to forget: Informal settlements as 'forgotten places' in globalising metro Manilla. Urban Studies, 41(12), pp. 2469-2484. https://doi.org/10.1080/00420980412331297636 [ Links ]
SOUTH AFRICAN GOVERNMENT. 2019. Towards a 25-year review: 1994-2019. Chapter 8: Spatial planning and human settlements, pp. 136-147. Pretoria: Ministry of the President. [ Links ]
STATSSA (STATISTICS SOUTH AFRICA). 2001. Census 2001-unit record data on formal and informal dwellings. Pretoria: StatsSA. [ Links ]
STATSSA (STATISTICS SOUTH AFRICA). 2011. Census 2011-unit record data on formal and informal dwellings. Pretoria: StatsSA. [ Links ]
STATSSA (STATISTICS SOUTH AFRICA). 2016. General Household Survey. Pretoria: StatsSA. [ Links ]
TAYLOR, T.K., BANDA-THOLE, B. & MWANANGOMBE, S. 2015. Characteristics of house ownership and tenancy status in informal settlement in the city of Kitwe in Zambia. American Journal of Sociological Research, 5(2), pp. 30-44. [ Links ]
TISSINGTON, K. 2010. A review of housing policy and development in South Africa since 1994. Working paper for SERI. Braamfontein: SERI. [ Links ]
TOPHAM, S. 2011. Informal settlement upgrading and backyard shacks. Presentation made to the Housing Leadership Forum, 9 February. s.l.: National Upgrading Support Programme. [ Links ]
TSHANGANA, A. 2014. South African Local Government Association (SALGA): Local government position on municipal responses to backyarders and backyard dwellers. A policy proposal presented to the Department of Human Settlements. s.l.: SALGA. [ Links ]
TSHIKOTSHI, V. 2009. The challenges of eradicating informal settlements in South Africa by 2014: The case of Seraleng sustainable human settlement, Rustenburg local municipality, North-West Province. Master's thesis. Johannesburg: University of the Witwatersrand. [ Links ]
TUROK, I. & BOREL-SALADIN, J. 2016. Backyard shacks informality and the urban housing crisis in South Africa: Stopgap or prototype solution. Housing Studies, 31(4), pp. 384-409. https://doi.org/10.1080/02673037.2015.1091921 [ Links ]
UKOHA, O.M. & BEAMISH, J.O. 1997. Assessment of residents' satisfaction with public housing in Abuja, Nigeria. Habitat International, 21(4), pp. 445-460. https://doi.org/10.1016/S0197-3975(97)00017-9 [ Links ]
UN-Habitat (UN-HABITAT HUMAN SETTLEMENT PROGRAMME). 2003. The challenge of slums: Global report on human settlements. Nairobi: UN-Habitat. [ Links ]
UN-HABITAT (UNITED NATIONS GENERAL ASSEMBLY). 2015. Sustainable Development Goals: Agenda 2030: Sustainable Development Goal 11: Sustainable cities and communities: Make cities inclusive, safe, resilient and sustainable. New York: UN General Assembly. [Online]. Available at: <https://sdgs.un.org/goals/goal11> [Accessed: 19 June 2021]. [ Links ]
WESTAWAY, M.S. 2006. A longitudinal investigation of satisfaction with personal and environmental quality of life in an informal South African housing settlement, Doornkop, Soweto. Habitat International, 30, pp. 175-189. https://doi.org/10.1016/j.habitatint.2004.09.003 [ Links ]
Received: September 2021
Peer reviewed and revised: March 2022
Published: June 2022
* The author(s) declared no potential conflicts of interest with respect to the research, authorship, and/or publication of this article

