


Services on Demand
Article
 English (pdf)
 Article in xml format
 Article references
Indicators

Related links
-
 Cited by Google
 -
 Similars in Google
Share

 Permalink
Town and Regional Planning
On-line version ISSN 2415-0495
Print version ISSN 1012-280X
Town reg. plan. (Online) vol.79 Bloemfontein 2021
http://dx.doi.org/10.18820/2415-0495/trp79i1.5
ARTICLES
Understanding the factors influencing the spatial dynamics of informal settlements: The case of Enugu City, Nigeria
Verstaan die faktore wat die ruimtelike dinamika van informele nedersettings beïnvloed: Enugu city, Nigerië
Matsapa a ho utloisisa linthla tse susumetsang liphetoho metseng e as reroang (ea baipehi): boithuro ba toropo ea Enugu, Nigeria
Chioma John-Nsa
Lecturer, Urban and Regional Planning Department, P.O. Box 400006, University of Nigeria, Nsukka, Enugu State, Nigeria. Phone: +2348063848487, email: <chioma.onwuneme@unn.edu.ng>, ORCID: 0000-0002-0534-3091
ABSTRACT
The need to address the challenge of housing demand in cities has not recorded much success. Informal settlements keep springing up in cities of developing countries in a bid to meet this need. However, due to the degenerated nature of informal settlements, efforts are usually made to improve them. Most of the programmes towards the improvement of informal settlements have only addressed the symptoms rather than the causes. This study aims to assess the footprint occupation of informal settlements in Enugu City and identify the factors that contribute to such dynamics. A total of 276 questionnaires from household heads and 47 from urban planners were analysed. Findings revealed that informal settlements are gaining dominance in Enugu City. The 26 identified factors were reduced, using factor analysis, into nine components that accounted for 70% spatial dominance in Enugu City. Informal settlements need to be approached concerning their triggering factors such as closeness to other informal settlements, and low incomes especially from rural agriculture, among others, for an encompassing approach to its management in Enugu City.
Keywords: Factors, housing, informal settlements, spatial dynamics, urbanisation
OPSOMMING
Die behoefte om die uitdaging van behuisingsvraag in stede aan te spreek, het nie veel sukses behaal nie. Informele nedersettings ontstaan steeds in stede van ontwikkelende lande in 'n poging om in hierdie behoefte te voorsien. Weens die agteruitgang van informele nedersettings word daar egter gewoonlik gepoog om dit te verbeter. Die meeste programme vir die verbetering van informele nedersettings het slegs die simptome eerder as die oorsake aangespreek. Hierdie studie het ten doel om die voetspoorbesetting van informele nedersettings in Enugu Stad te evalueer en die faktore te identifiseer wat bydra tot sulke dinamika. Altesaam 276 vraelyste van huishoudingshoofde en 47 van stedelike beplanners is ontleed. Bevindinge het aan die lig gebring dat informele nedersettings besig is om in Enugu Stad te oorheers. Die 26 geidentifiseerde faktore is verminder, met behulp van faktoranalise, in nege komponente wat verantwoordelik was vir 70% ruimtelike dominansie in Enugu Stad. Informele nedersettings moet genader word in verband met die sneller faktore daarvan soos nabyheid aan ander informele nedersettings, en lae inkomste veral uit landelike landbou, onder andere, om 'n omvattende benadering tot die bestuur daarvan in Enugu Stad te maak.
Sleutelwoorde: Behuising, faktore, informele nedersettings, ruimtelike dinamika, verstedeliking
SA BONAHALENG
Haho so be le katleho e kaalo tharollong ea phephetso ea tlhokeho ea matlo litoropong. Ele ho arabela tlhoko ena, metse e sa reroang e ntse e eketseha litoropong tsa linaha tse futsanehileng. Leha ho le joalo, ka lebaka la maemo a hlobaetsang ka kakaretso metseng ena, hangata ho etsoa boiteko ba ho e ntlafatsa. Le ha hole joalo, merero e mengata mabapi le ntlafatso ea metse e sa reroang a sebetsane le matsoao feela ho fapana le lisosa. Boithuto bona bo ikemiselitse ho lekola bophara le boholo ba metse e sa reroang toropong ea Enugu, le ho tseba sesosa sa qaleho ea eona. Ka kakaretso boithuto bo sekasekile lethathamo la lipotso tse arabiloeng ke lihloho tse 276 tsa malapa, 'moho le liofisiri tse 47 tse sebetsanang le thero ea libaka. Liphuputso li senotse hore metse e sa reroang e runya ka potlako toropong ea Enugu. Lintlha tse 26 tse fumanoeng li ile tsa fokotsoa ho sebelisoa tlhahlobo ea lintlha. Qetellong, linthla tsena li ile tsa aroloa ka likarolo tse robong tse ikarabellang ho 70% ea taolo ea toropo ea Enugu. Metse e sa reroang e tlameha ho atameloa le ho lekoloa ho ipapisitsoe le mabaka a susumetsang qaleho ea oona. Mehlala ekaba katamelano le metse e meng e sa reroang le meputso e tlase ea baahi haholo-holo e tsoang temong ea mahaeng. Sena se tla thusa ho bopa mokhoa o akaretsang oa tsamaiso ea metse ena toropong ea Enugu.
1. INTRODUCTION
Rapid urbanisation has become a reoccurring issue in the vast majority of developing countries, due to many negative environmental issues associated with the trend. UN-HABITAT (2003) noted that rapid urbanisation is the major factor behind the occurrence and growth of informal settlements. Moreover, there has been a continuous rise of officially unplanned settlements in developing countries, due to informal land occupation of the urban and peri-urban areas for residential uses (Newaya 2010: 59). Such settlement are reputed for over crowdedness, unsanitary environment, poor drainage channels, poor housing conditions, lack of adequate infrastructural facilities, among others. Meanwhile, some studies on the spatial dynamics of informal settlements reveal that informal settlements are densifying and expanding at a fast rate in places like Namibia as from year 2000 and Nairobi (Newaya, 2010: 65, 75; Githira 2016). City administrators and other stakeholders have always endeavoured to seek to intervene in improving the living conditions of informal settlements dwellers. However, UN-HABITAT (2003) showed that the challenge of informal settlements is so poorly understood that interventions only handle the symptoms instead of their fundamental causes. Some scholars have examined the causes of factors that contribute to the growth and development of informal settlements. According to scholars such as Sietchiping (2005: 1), Xie, Huang, Claramunt and Chandramouli (2005) and Githira (2016), among others, socio-cultural, economic, site-specific, location, physical, proximity, spatial, and non-spatial factors influence the growth of informal settlements.
Most on the findings on factors that affect the growth of informal settlements seem to show some level of similarity at some point, though with variant categorisation, while there is also disparity among other locations especially in relation to their ranking. Xie et al. (2005) as well as Ahmed and Bramley (2015: 361) argued that every human settlement is different and it is thus impossible to have universal agreeable factors on growth to suit all environments. Thus, a localised study will help understand the causes of informal settlement growth and development in any city.
Given the above background, there are two research questions. What are the spatial dynamics of the informal settlements in Enugu City? What factors have contributed to the spatial dynamics of the informal settlements in Enugu City? In answering these questions, the study assessed the spatial dynamics of informal settlements in Enugu City, with a view to providing baseline information for furthering study on informal settlements. By implication, therefore, this research seeks to improve the availability and accessibility of spatial data on urban informal settlements, which is pertinent for diverse actors in the management of the urban environment of Enugu City. Identifying and categorising (ranking) the factors that have contributed to the growth of informal settlements in Enugu City will provide reliable information on the underlying factors of informal settlement growth in the city that can guide policies and intervention targeted at such settlements. Roy, Lees, Palavalli, Pfeffer and Sloot (2014) have emphasised this and opine that for governments to comprehend the significance of their plans and polices on informal settlement, they need to take cognisance of several factors. A knowledge of the factors that influence the growth of informal settlements will enable urban managers and policymakers to consider such factors and better proffer innovative means of planning and managing the settlements and the general urban space of Enugu City.
2. LITERATURE REVIEW
2.1 Urbanisation and informal settlements formation
Urbanisation issues have been recurring in human history especially since the 19th century. UNDESA (2019) asserts that, in 2050, roughly 2.5 billion people are estimated to be added to the world, with 90% of that population increase concentrated in African and Asian cities only. The urbanisation of developing economies, in particular sub-Saharan Africa, has experienced a notable revolution over the past decades (Onodugo, Ezeadichie, Onwuneme & Anosike, 2016). Furthermore, due to population pressure in cities, several households chose to erect make-shift housing units with all manners of waste materials on land illegally occupied (Olotuah & Adesiji, 2006: 5), especially when they cannot afford what the formal market provides. Some informal settlements simply show the extreme anxiety of the people who only wish to access land where they can live closer to prospects offered in the cities (Newaya, 2010: 15). The larger percentage of the urban poor resides in informal settlements of the urban area, essentially because of access to affordable accommodation and their localities are in close proximity to their places of work (Newaya, 2010: 15) and other facilities. Informal settlements offer hope and optimism as inexpensive entries to city economic prospects for individuals determined to enhance their situation by leaving distressed rural areas (Turok, Budlender & Visagie 2017: 2). It is a means of escaping poverty which has engulfed many rural communities. Turok et al. (2017: 2) also showed that informal settlements provide people seeking work with access to a freely existing labour market and promising entrepreneurs with consumer availability in the broader city. The financial gain from this is usually remitted to other family members in the rural hometowns. Informal settlements offer the opportunity for the promotion of people's endeavour and broader interactions, as they provide more open and new social relationships unrestricted by a rural social system and customary kinship structures (Cross, 2013).
2.2 Condition of informal settlements
The crowdedness of cities in Africa is most obvious in their slums. Over 60% of the urban population of Africa (on average) is crammed into slums - a far greater portion than the 34% average in other developing nations (United Nations 2015). Slums are generally characterised by unhygienic environment, dilapidated dwelling units, limited and derelict infrastructural facilities, diseases such as Cholera and HIV (cholera and Ebola are reputed to emerge and spread faster in slums [UN Habitat, 2016]), overcrowding, and poor living conditions, among others. These deplorable features of slums or informal settlements as a component of the cityscape impede the sustainable development of cities, as these areas are not even healthy for present and future generations. Despite this, Newaya (2010: 75) affirmed that informal settlements are growing at a fast rate. The large informal settlement areas in Dar es Salaam cover extensive areas (Sirueri, 2015). Githira (2016) studied the growth of informal settlements in a period of ten years, with a five-year interval of three phases (2005, 2010, and 2015). He opined that, in Kibera, the built-up area represents 60% of the total surface of the informal settlement boundary (Githira, 2016). Githira (2016) classified informal settlements into classical and atypical. Informal settlements in Nairobi are expanding at a rate of 4.1% surface area, with atypical informal settlements expanding Ave times faster than classic informal settlements (1.2% against 7.1% per annum). Sliuzas (2004) noted that, in determining the percentage of roof coverage, the formula is: PRC = (Sum of Roof Area)/(Area of Settlement!)*100..... Eq.1. This formula will be used to compute the spatial dominance by footprint in this study.
2.3 Economic and social factors influencing the formation and growth of informal settlements
The factors that trigger or encourage the development of informal settlements in the urban environment can be varied, due to dynamism in urban environment. Scholars such as Xie et al. (2005) as well as Ahmed and Bramley (2015: 361) argued that every human settlement is different and that it is thus impossible to have universal agreeable factors on growth to suit all environments. However, there have been attempts to delineate the factors of urban growth for a firm theoretical base in urban growth studies. For example, Sietchiping (2005: 1) classified the factors of informal settlement growth into socio-cultural, economic, and physical factors, while Xie et al. (2005) classified factors of growth of informal settlements into proximity, site-specific, and neighbourhood features. Githira (2016) presents the non-spatial factors and spatial factors. The main reasons for urbanisation (invariably affecting informal settlement growth and development) have been noted in City Alliance (2014) and Githira (2016), to include escape from poverty in rural areas, insufficient income from agriculture, economic recessions, better job opportunities in urban areas, and the rural dwellers' belief that urban areas can offer improved living conditions as in better quality communication and education systems, among others. Based on rating (in descending order): absence of livelihood earnings in rural areas was rated highest, followed by minimal income from agriculture and poor social and infrastructure services in rural areas as some factors that trigger the growth of informal settlements (Githira, 2016). He further acknowledged the shortage of affordable or low-cost housing, low incomes or wages, and the unavailability of jobs and dawdling rate of housing delivery by housing agencies as the three most internal factors of informal settlement growth. Other lesser influential factors include spatial policies, inability of urban poor to access housing credit, bad politics (politicians without the interest of the people at heart), and class discrimination and inequality (Githira, 2016). He also showed that a liking for city lifestyle, class segregation and inequality are strong factors driving the growth of informal settlements. Poor governance is also noted as a factor generally considered to be driving the growth of informal settlements (City Alliance, 2014; Olajuyigbe, Popoola, Adegboyega & Obasanmi, 2015: 312, in Fekade 2000). Moreover, bribery and corruption seem to have penetrated almost all facets of society, with planning function as no exception (Wahab & Agbola, 2017). In brief, the vast majority of scholars have affirmed that urban informal settlements seem to occur by default, as a result of bureaucracy and corruption in formal processes, weak political/legal structure, absence of inexpensive serviced land, and so on (Hansen & Vaa, 2004). UN-HABITAT (2015) affirmed that informal settlements are caused by a series of interconnected factors such as rural-urban migration and population growth, weak urban governance (mainly in planning, policy, land and urban management, resulting in land grabbing and speculation), lack of affordable housing for the urban poor, economic vulnerability and underpaid work, discrimination and marginalisation, as well as displacement caused by conflict, natural disasters and climate change.
2.4 Spatial and locational factors influencing the formation and growth of informal settlements
Physical or spatial features influence informal settlement growth. Githira
(2016) showed that spatial factors include proximity of industrial areas; distance to business centres; distances to Central Business District and rivers; distance to major roads and railway; proportion of nearby commercial land use; amount of adjacent vacant land; proportion of surrounding existing informal settlements; proportion of surrounding planned residential areas, and closeness to a major investment. Other factors include close proximity to educational institutions (10% in Nairobi) and industries (9% in Nairobi) in Dar es Salaam; undeveloped land within informal settlement environs (Sirueri, 2015). Moreover, Dubovyk, Sliuzas and Flacke (2011) note that slope, population density and proximity to vacant land, as revealed in Sancaktepe, are other location-related factors. Abebe (2011: 37) supports Githira's position, by noting that the availability of vacant land without restrictions contributes to the development of informal settlements in Dar es Salam. In addition, Amnesty International's (2009: 4) study showed that the vasl majority of informal settlement is found on government-owned public land. Generally, Matrix Development Consultants (1993: 24-28) showed that locations occupied by informal settlements include relocation sites allotted to squatters by government, undeveloped land close to big farms, undeveloped government land near industrial areas, workers' camps for colonial settlers farms, and idle private land. Meanwhile, according to Abebe (2011: 52-53), Dar es Salaam's spatial densificatior can be attributed to density of population and distance to rivers (with a positive influence) as well as distance to the Central Business District and major roads (a negative influence). This shows that there may be minor disparities in factors of informal settlement growth in various cities and countries. There is no known study on Nigerian cities such as Enugu. Thus, the need to study Enugu City, in order to make localised findings that can enable targeted intervention and improved urban management.
3. STUDY AREA
Enugu City is the capital of Enugu State, which is one of the five states in southeast Nigeria (Figure 1). Enugu City developed as a result of the discovery and development of the coal mine in roughly 1909. It is euphemistically referred to as the "Coal City" because of the significance of the industry for the city's foundation and development (Odoemenne, 2009). Enugu City has 18 neighbourhoods, which are of low-, medium-, and high-density residential land uses.
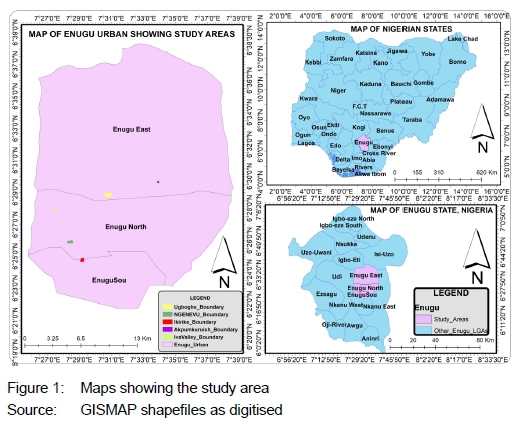
Residential land uses in Enugu City consist of formal and informal areas. Ogbete layout was the oldest neighbourhood area in Enugu. It served as a place of residence for the coal workers. Other residential layouts that were built later include the Government Reservation Area (GRA) for colonial masters and China Town for railway workers, and later Ogui layout and Uwani for other migrants to the city. The continuous migration of people in search of greener pastures in the city gave rise to other residential land-use developments, as witnessed nowadays, such as Achara Layout, Maryland, Trans-Ekulu, Independence Layout, New haven, Uwani, among others. The informal residential areas in Enugu City are found in the city core, intermediate and the peripheral of the city. Those at the peripheral are found on the outskirts of the local government areas (Enugu South, Enugu North and Enugu East (see Figure 1) making up the city of Enugu; Ugboghe, Ugbo Ezeji, Ikirike Campus 1, Iva Valley Pottery as examples). Moreover, there is a minor or small number of informal settlements at the core and intermediate zones of the city, which includes Onu-Asata, Ngenevu, and Obiagu. However, the areas of the study within Enugu City include Ugboghe, Ngenevu, Ikirike Campus 1, Iva Valley Pottery, and Akpumkpirishi.
4. METHODOLOGY AND DATA
4.1 Research design
This study assessed the spatial dynamics and the factors that have contributed to spatial dynamics of the informal settlements in Enugu City, Nigeria. The study used a mixed methods design, in which qualitative and quantitative data are collected in parallel, analysed separately, and then merged (Creswell, 2014). This study reviewed documents from Town Planning Authorities in Enugu City to get an estimate of the informal settlements in Enugu City and its peripheral areas. Interviews with key informants defined the boundaries of these settlements and this information helped generate digital settlement footprint maps. The questionnaire survey explored factors influencing informal spatial dynamics in Enugu City. Exploratory factor analysis with principal component analysis (PCA) and varimax rotation was used to reduce the factors from the questionnaire results to a smaller number of factors (Rossoni, Engelbert & Bellegard, 2016: 201). Both quantitative and qualitative data were collected in order to elaborate on specific findings from the breakdown of the interviews such as similar factors influencing informal spatial dynamics suggested from respondents (Creswell, 2014).
4.2 Population, sample, and response rate
To obtain the informal settlements population, data from Town Planning Authorities was reviewed to get an estimate of 28 informal settlements in Enugu City and its peripheral areas. Applying cluster sampling technique, the informal settlements clustered into two; those at the urban centre/intermediate zones (with 11 informal settlements) and those at the urban peripheral (with 17 informal settlements). From these clusters, five informal settlements were selected in the ratio of 2:3 for settlements at the city centre/ intermediate zone (Ngenevu and Ugboghe) and those at the peripheral (Ikirike Campus 1, Akpumkpirishi and Iva Valley Pottery), respectively. There are 7 927 households living in the five informal settlements (see Table 1). From these, stratified sampling (Kusi, 2012: 61) was used to select 317 household heads (see Table 1) to participate in the survey. Purposive sampling (Rai & Thapa, 2015: 6) was used to select 50 urban planners from the 150 listed by the Nigerian Institute of Town Planners, Enugu State Chapter.
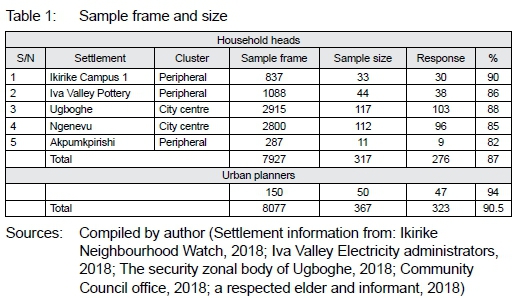
The sample size table of Krejcie and Morgan (1970: 608) recommends a sample size of 367 for a population of 8 000. This recommendation validates the sample size of 317 and 50 as efficient for the population of 7 927 and 150 in Table 1. In total, 323 (see Table 1) completed questionnaires were returned; 90% response rate is excellent, as built-environment survey response rates vary between 7% and 40%, in a broader perspective (see Moyo & Crafford, 2010: 68).
In sampling the key informants who provided information on the boundary and origin of the informal settlements, community leaders from each informal settlement selected individuals to represent them. The selection criteria were based on residents living in the area for over 20 years, and individuals actively involved in the management of the informal settlements (Thapa & Murayama, 2010). At least 10 key informants were identified for each of the informal settlements.
4.3 Data collection
The authors and survey assistants administered a face-to-face questionnaire from September 2017 to October 2017. Questionnaires were administered on the head of the household (s/he is expected to represent his/her household on matters of informal settlements) and urban planners in Enugu Metropolis. Section A on the respondent's profile obtained socio-demographic information on age, education qualification, average monthly income (households), occupation, and work experience (planners). Section B set 17 mostly tick-box questions on the nature of informal settlements (including aspects such as facilities, rent, planning regulations, and planning implications). Section C is a set of 26 Likert-scale type items relating to the spatial and non-spatial factors that trigger the growth and development of informal settlements in Enugu City. Respondents were requested to rate how strongly these factors informed the footprint changes of informal settlements in Enugu City.
The data from these measurements forms the Likert-scale items used in the descriptive and inferential analysis of this study. To reduce the respondent's bias, closed-ended questions were preferred for sections 2 to 4 (Akintoye & Main, 2007: 601).
To assess the spatial dynamics of the informal settlements, discussions took place between 5 June 2017 and 5 July 2017. The key informant discussion guide set five open-ended questions to determine the boundary coordinates, estimate the number of families in each settlement, find the origin of the settlements, and assess the factors influencing the movement of people to the settlement.
4.4 Data analysis and interpretation of the findings
To compile the settlement areas maps, the key informants defined the boundary of the settlements and hand-held GPS (Global Positioning System) was used to obtain the boundary co-ordinates (Abbott, 2003). The latitude and longitude of the boundary of each of the settlements understudy were inputted into Google Earth Pro, from which the settlements maps (aerial view) were generated for the years 2003, 2010, and 2017 (seven-year intervals); Geographic Information System software (ArcGIS under the ArcMap suite) was also used to digitise the generated maps which gave the area of the settlements footprints and to compute the rate of growth for each of the informal settlements studied (ESRI, 2010).
The Statistical Package for Social Sciences (SPSS) version 20 was used to analyse factors influencing the spatial dynamics of informal settlements by means of descriptive and inferential statistics (Pallant, 2013: 134). The respondents' background information was analysed, using descriptive statistics, in which the frequencies and percentages were generated and reported.
In determining the internal reliability of the factors influencing the spatial dynamics of informal settlements, Cronbach's alpha values were determined in line with Taber (2018: 1279) who stated that the acceptable Cronbach's alpha values range from 0.70 to 0.95. In the current study, a cut-off value of 0.75 was preferred. In addition, a range from 0.2 to 0.4 was suggested as the optimal inter-item correlations mean (factor loadings) for the factor to be reliable (Pallant, 2013: 134). This study, therefore, adopted a value of 0.4 and above.
Furthermore, in determining the suitability of the obtained data for factor analysis, the following tests were conducted: Kaiser-Meyer-Olkin (KMO) (Lorenzo-Seva, Timmerman & Kiers, 2011: 340), and Bartlett's Test of Sphericity (Hair, Black, Babin & Andersen, 2014: 110). In the KMO test, as the values of the test vary between 0 and 1, values above 0.7 are required for applying PCA (Hair et al., 2014). A statistically significant Bartlett test (p<0.05) indicates that sufficient correlations exist between the variables to continue with the analysis (Hair et al., 2014: 110; Pallant, 2013: 190).
For factor extraction, PCA with varimax rotation was adopted to analyse the information into a minimum number of factors, by concentrating the explanatory power on the first factor (find the principal components of data) (Rossoni et al., 2016: 102).
5. RESULTS AND DISCUSSION
5.1 Mapping and settlement density
Figures 2 to 6 present the maps of the informal settlements studied, showing the footprint density for the years 2003, 2010 and 2017.
Ugboghe is located in Abakpa area of Enugu East Local Government Area of Enugu State in the southeastern region of Nigeria. Ugboghe is part of the urban section of the Nike community. It is close to a major market at Abakpa Nike.
Ngenevu is located close to the city centre, near coal camp where the first coal miners settled during the early development of the city. Ngenevu is close to other informal settlements and the major market of the city at Ogbete.
Ikirike Campus 1 is found in Enugu South of Enugu State. Ikirike Campus 1 is close to a main market at Mayor axis. The settlement is also close to other informal settlements such as Ikirike Campus 2 and 3.
Iva Valley Pottery is found almost at the peripheral of the city, with other informal settlements such as Camp 2, Valley Road 1 and 2, Ugwu Pik, Forestry Hill, and so on. Iva valley Pottery is closest to New market within Enugu City.
Akpumkpirishi is located at the city peripheral (Enugu East). It is also close to Eke market at Emene (which houses more industrial and residential land uses).
The digitised maps in Figures 2 to 6 were used to compute the area coverage of the footprint of the informal settlements as shown in Table 2, with the percentage area occupied by buildings and structures for each of the settlements for the years studied. Ugboghe has the most (310 269 m2) and Akumkpirishi the least (40 710 m2) land area among the studied settlements. All the informal settlements studied showed a rapid increase in the development of structures and buildings except for Akumkpirishi with 4% in 2017. The reason for this is that this land, though vacant, is not accessible to residents or to those desiring to occupy the land informally, due to serious land conflicts that led to the eviction of some of the residents.
Ikirike Campus 1 and other settlements at the Enugu City peripheral showed higher footprint growth rate than those at the city centre - Ugboghe and Ngenevu (see Table 2). This shows that informal settlements at the city peripheral are still gaining footprint dominance over those at the city centre.
5.2 Descriptive analysis
5.2.1 Respondents' profile
Table 3 shows the general information of the respondents of the study. The data collected from the survey indicated that the majority (61%) of the household heads of the informal settlements were aged between 25 and 36 years and that over half (63%) of them stayed over six years in their residences in the informal settlements. Half (50%) of the household respondents have secondary school education and 63% noted that their place of work is located within their settlement.
These characteristics imply that the household heads respondents have adequate experience of informal settlement living to give substantial information that could help make useful inferences and deductions on factors influencing the spatial dynamics of informal settlements.
Analysis of the urban planners' profile in Table 3 shows that the majority (63%) of them were aged between 31 and 50 years and that over half (64%) of them have over six years' professional experience. Analysis of the urban planners' education level showed that the majority of them have either a first degree (57%) or a Masters' degree (32%); only 11% of the urban planners have a PhD degree. The vast majority (70%) of urban planners work for either a planning authority or ministry in Enugu City and 45% are involved with urban development control and plan design. These characteristics imply that the urban planners have adequate education and experience to give substantial information that could help make useful inferences and deductions on factors influencing the spatial dynamics of informal settlements.
5.2.2 Ranking the factors influencing the spatial dynamics of informal settlements
Table 4 shows the result of the 26 identified factors influencing the spatial footprint dynamics of informal settlements in descending order, as ranked by the respondents (informal settlement dwellers and urban planners). With an average MS rating of 2.19, respondents agreed that all the factors evaluated are strong spatial footprint growth success factors within Enugu City. The Cronbach's alpha ratings was greater than 0.70, indicating acceptable internal reliability, as recommended by Hair, Black, Babin and Anderson (2014).
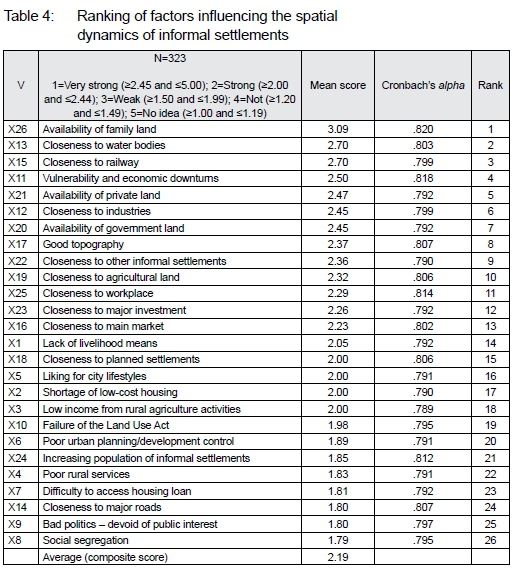
Respondents noted that availability of family land, closeness to water bodies, closeness to railway, vulnerability and economic downturns, availability of private land, closeness to industries, and availability of government land are very strong factors to understand and assess spatial dynamics of informal settlements in Enugu, Nigeria, with mean score of (3.09), (2.70), (2.70), (2.50), (2.47), (2.45), and (2.45), respectively, and are the top seven factors critical for assessing the spatial dynamics of informal settlements in Enugu, Nigeria.
Furthermore, with MS ratings >2.00 and <2.44, respondents ranked 11 variables as strong factors for assessing the dynamics of informal settlements in Enugu, Nigeria. These are, good topography, closeness to other informal settlements, closeness to agricultural land, closeness to workplace, closeness to major investment, closeness to main marketplace, lack of livelihood means, liking for city lifestyles, shortage of low-cost housing, and low incomes especially from rural agriculture activities.
Lastly, respondents noted that failure of the Land Use Act, poor urban planning/development control, increasing population of informal settlements, left rural area due to poor services, difficulty to access housing loan, closeness to major roads, bad politics and social segregation are weak factors for assessing the spatial dynamics of informal settlements in Enugu, Nigeria.
The nature of the country's customary land ownership system, which permits family land ownership that is not easily transferred to outsiders but mostly to the upcoming family lineage, has been ranked as the highest factor influencing spatial footprint growth of informal settlements in Enugu City. Moreover, the findings also agree with Abebe (2011), Shekhar (2012), Sirueri (2015) and Githira (2016) who opined that the amount of surrounding vacant land is the greatest influential factor influencing growth and expansion in informal settlements.
This vacant land can be family land, government land or privately owned land. Although Githira noted that the growth of informal settlements is affected at a lower rating by distance to major roads and railway, Enugu City owes its initial growth to the development of a railway system for the movement of coal to other parts of the country by the colonial masters. Thus, closeness to railway is a very strong factor of the spatial growth of informal settlements in Enugu City. Economic downturn greatly influenced people's choice of residing in informal settlements. The reason for this is that the Nigerian economy has been unstable over the years and many employees are retrenched from work on a regular basis. Githira also showed that distance to industrial areas is rated as the highest proximity factor, while distance to business centres rated with the third, being distances to rivers (rated second in this study), with bad politics having a lesser rank. This is closely related to what obtains in the case of informal settlements in Enugu City.
5.3 Factor analysis
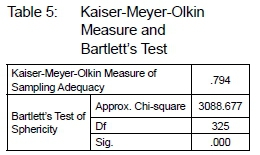
The Kaiser-MeyerOlkin (KMO) value of 0.794 was obtained, which is greater than 0.70, and Bartlett's test of Sphericity has the significant value of (p<0.05) at 5% level of significance, as shown in Table 5. Therefore, the results obtained indicate that the data is robust and suitable for conducting factor analysis in line with Pallant (2013).
The 26 identified factors influencing the footprint densification (spatial dynamics) of informal settlements in Enugu City were subjected to PCA to determine the number of factors to retain. With an initial Eigenvalue greater than 1 criterion (Table 6), the orthogonal varimax rotation and a factor loading of 0.4, nine factors (components) explain a cumulative variance of approximately 70.051% of the total variance.
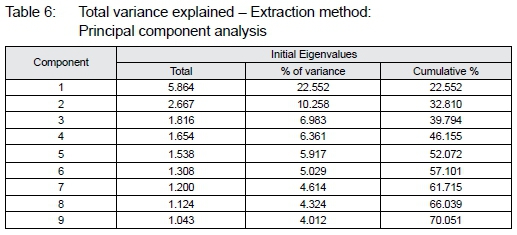
Table 6 confirms the retaining of 9 components, where component 1 (unrelated needs) explains 22.552% of the total variance; component 2 (poverty and control constraint), 10.258%; component 3 (societal constraint), 6.983%; component 4 (employment potential), 6.361%; component 5 (accessibility and conveyance), 5.917%; component 6 (formal urbanism), 5.029%; component 7 (unforeseen constraint), 4.614%; component 8 (low-cost potential), 4.324%, and component 9 (density), 4.012%.
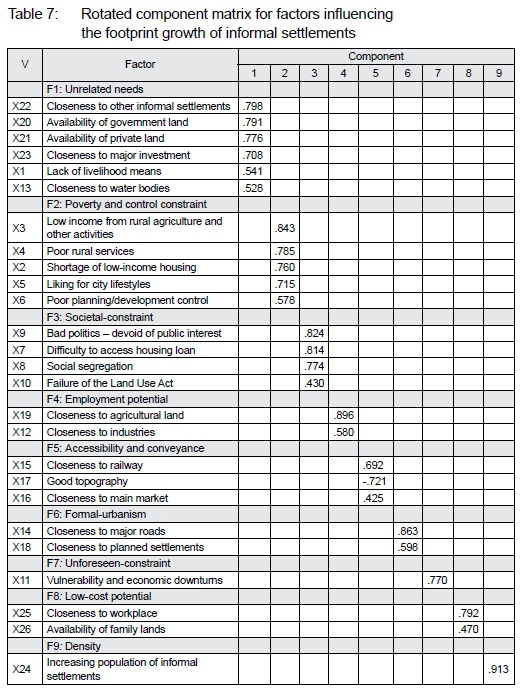
Based on PCA, orthogonal varimax rotation with Kaiser Normalization rotation method and with a significant factor of .04, the correlation between components and variables after rotation are shown in Table 7.
Factor 1: Unrelated needs
With an Eigenvalue of 5.864, and six subfactors, factor 1 accounts for 22.552% of the total variance in the variables and is, therefore, identified and classified as the major determinant of informal settlement growth in Enugu City. Closeness to other informal settlements has the highest loading of 0.798; availability of government vacant land has a loading of 0.791; availability of private vacant land has a loading of 0.776; closeness to major investment has a loading of 0.708; lack of livelihood means has a loading of 0.541, and closeness to water bodies has a loading of 0.528. Ngenevu is close to other informal settlements such as Coal Camp (a formal area turned informal, due to large occupation of the area) and also noted by the residents to be close to a stream. Ugboghe is close to Ugbowa, and Ikirike Campus 1 is close to Ikirike Campus 2 and 3. Iva Valley Pottery is close to Camp 2, Valley Road 1 and 2, Ugwu Pik, and Forestry Hill. Akpumkpirishi is not close to any informal settlement; it is a private vacant land. Most of the area around most of the informal settlements studied has been occupied by people informally. This agrees with the findings of Abebe (2011: 55) and Githira (2016) who opine that proximity to existing informal settlements is one of the most important factors of informal settlement expansion in Dar es Salaam and Nairobi, respectively, and so is availability of vacant land. Moreover, Amnesty International's (2009) study showed that most of the informal settlements are found on government-owned public land, which have been shown to be obtainable in this study. Meanwhile, the growth of Ngenevu and Ugboghe informal settlements is influenced by closeness to water bodies, because minor streams were found close to these two settlements. Ngenevu is close to a stream along the valley of Ugwuonyeama, while Ugboghe is also close to a stream at the east of the settlement. In support of what obtains at Ugboghe and Ngenevu, it was demonstrated earlier in this study by the findings of Abebe (2011) and Sirueri (2015) that spatial densification of informal settlements can be attributed to closeness to rivers. In his study at Nairobi, Githira (2016) showed that closeness to a major investment rated high in terms of proximity factors to informal settlement growth, while Minetos, Polyzos and Sdrolias (2007) showed that the concentration of several workforces in areas where they do not have the financial capacity of obtaining a formal dwelling unit induces the practices of building informal dwelling units. Major investment close to informal settlements such as Ngenevu (with Ricco Company) attracts people into such environments. These people, who either do menial jobs or hawk in the vicinity of such investment, usually construct kiosks and other temporary structures for the business which they may later inhabit as time progresses.
Factor 2: Poverty and control constraint
Factor 2, with an Eigenvalue of 2.667 and five subfactors, explains 10.258% of the determining variables and are, therefore, identified and classified as a determinant of informal settlement growth in Enugu City. Factors with high loadings include low income especially from rural agriculture activities, with a factor loading of 0.843; poor rural services, with a loading of 0.785; shortage of low-income housing, with a loading of 0.760, and liking for city lifestyles, with a loading of 0.715. Poor planning/development control has a loading of 0.578. The principal component in this factor is low income, especially from rural agriculture. Residents in informal settlements in Enugu City have experienced rural life, where they engaged in agriculture as the major occupation. However, due to poor soil fertility, lack of finance for mechanised farming, low quantity of land, among others, they could not thrive in the agricultural activities in rural areas. Rural dwellers migrate to urban areas when they experience economic hardship, despite their farming activities, and others live in informal settlements while their family and other economic activities such as farming are concentrated in the rural area. This supports Githira's (2016) findings that minimal income from agriculture was the second most significant factor contributing to informal settlement growth in Nairobi. Shortage of affordable or low-cost housing, low incomes, wages and unavailability of jobs, and dawdling rate of housing delivery by housing agencies are the three most internal factors of informal settlement growth. He also showed that liking for city lifestyle is a strong factor for informal settlement growth.
Factor 3: Societal-constraint
This factor with an Eigenvalue of 1.816, and four subfactors explain 6.983% of the determining variables and are a determinant of informal settlement growth in Enugu City. Factors with high loadings include bad politics that are devoid of public interest, with a factor loading of 0.824; difficulty to access housing loans, with a loading of 0.814, and social segregation, with a loading of 0.774. Failure of the Land Use Act of 1978, CAP 202, LFN 2004 has a factor loading of 0.430. Wahab and Agbola (2017) showed that those in political offices contribute to informal and illegal developments in that they usually decline granting approval for the demolition of dangerous contraventions and developments in which they have interests, even when the developments are in risky areas such as along rail tracks, road setbacks, urban stream/river setbacks, under high voltage power lines, and pedestrian walkways. Some interventions in the urban environment of Nigerian cities are usually met with interferences from political office holders, with Enugu City as no exception. This is sometimes in the form of resistance from political office holders, which usually makes the urban planners fearful and apprehensive in responding to development treat in the city. This has led to different shades of informality, especially in relation to land in Enugu City.
Factor 4: Employment potential
This factor, with an Eigenvalue of 1.654 and two subfactors, is the fourth determinant that contributes 6.361% of the total variance to the informal settlement growth in Enugu City. Closeness to agricultural land has a high factor loading of 0.896 and closeness to industries has a loading of 0.580. Closeness to agricultural land is the principal component in this factor. Agricultural activities, especially farming, are the major occupation of the vast majority of rural dwellers in Enugu State. The availability of agricultural land attracts people to an area, especially the poor who need such agricultural land for their sustenance. There are farming patches in or close to all the informal settlements studied and this may have encouraged their initial growth until this date. Information obtained also revealed that most of these informal settlements grew out of the need to farm (e.g. Ugboghe). Furthermore, availability of agricultural land encourages habitation by the poor, as these areas are used for farming and help reduce the cost of living in the city. Furthermore, informal settlements at the city core such as Ngenevu also have some agricultural area along the hill and valley close to the settlement. This concurs with the findings of Sirueri, (2015) who attributed the densification of informal settlements in Dar es Salam and Nairobi to the high proportion of agricultural unoccupied land uses and large chunk of forest land found therein. Furthermore, Sirueri (2015) opined that the infancy phase of informal settlements is proven by the availability of agricultural or unoccupied land which a group of people transformed to residential use. This has been the cause of the early development of some of the informal settlements studied such as Ugboghe, Ikirike Campus 1, and Akpumkpirishi.
Factor 5: Accessibility and conveyance
The fifth factor, with an Eigenvalue of 1.538, explains 5.917% of the determining variables of spatial footprint of informal settlements in Enugu City. Factor 5 was highly and positively loaded on two variables and highly and negatively loaded on one variable out of the 26 variables. A variable in this factor was closeness to railway, with factor loading of 0.692. Other variables in this factor include good topography, with factor loading of -0.721 (which is negatively related to the factor), and closeness to main market, with factor loading of 0.425. Thus, good topography does not affect the spatial growth of the informal settlements studied. Most of the settlements include hills and valleys, thus impeding their growth. Meanwhile, closeness to railway is the principal component in this factor. The railway system in Enugu City seems to have become obsolete. Railway was the contributing factor to the development of informal settlements in Enugu City, for example, Ngenevu has a history of people being conveyed to the area by rail. Enugu City's history is attributed to the development of a railway as a major means of transportation in the city when coal and other raw materials were being transported to other parts of the country and beyond.
Factor 6: Formal urbanism
Factor 6, with two subfactors and an Eigenvalue of 1.308, explains 5.029% of the determining variables of footprint densification of informal settlements in Enugu City. The variable with the highest factor loading was closeness to major roads, with a loading of 0.863, and closeness to planned settlements, with a loading of 0.598. Closeness to major roads shows that the presence of functional roadways in Enugu City has succeeded in attracting people from the rural hinterland into the urban environment. Successive governments put in much resource in the construction of roads and road rehabilitation. These roadway systems enable easier access to all parts of the city. Informal settlements have also been noted to be growing in Enugu City, as the tendency of accessing facilities in different parts of the city is facilitated by the presence of functional road systems. All the informal settlements studied have either a major or a minor road that connects them to other parts of the city, especially the city centre. This finding concurs with the findings of Abebe (2011: 62) and Githira (2016) in that closeness to major roads affects the growth of informal settlements at a lower rating in Dar es Salam for low- and medium-density informal settlements and those of Nairobi, respectively.
Factor 7: Unforeseen constraint
This factor was highly and positively loaded on vulnerability and economic downturns, with factor loading of 0.770. This factor, with an Eigenvalue of 1.200, explains 4.614% of the determining variables of footprint densification growth and development of informal settlements in Enugu City. Factor 7 is one of the less significant factors and contributes 4.614% of the determinants on the growth of informal settlements in Enugu City. Economic recession, as was recently experienced in the whole country, could have affected some residents of informal settlements, thus reducing their ability to meet their family needs. This can cause most of the people to seek housing in locations which they would normally not go for, if not for the economic hardship in which they found themselves. During such economic hardship, some dwellers in informal settlements may reside there to meet the family obligation of training children, constructing their own houses, and taking care of family land or buildings. It should be noted that City Alliance (2014) showed that economic recession is one of the major reasons for the high influx of people into the urban environment. For Enugu City, economic recession and reduction of soil fertility are not a major reason.
Factor 8: Low-cost potential
This factor, with an Eigenvalue of 1.1243 and two subfactors, explains 4.324% of the determining variables of densification of informal settlements in Enugu City. The variable closeness to workplace had the highest factor loading of 0.792 and availability of family lands had a loading as 0.470. Closeness to place of work is the highest correlating variable in this factor. Residing close to one's place of work usually reduces stress, transport cost and time spent on transportation/movement. People ordinarily prefer to reside in areas that are close to their place of work, so as to save cost and time and ease stress. In Enugu City, residents of informal settlements are mostly in the low-income group that prefers such settlements that will reduce transport cost when they live close to their workplace. Furthermore, interview responses show that most of the residents were working within their settlement and some worked very close to the settlements, as this helps minimise costs and time spent on transportation. This supports the findings of Newaya (2010) who showed that the urban poor reside in the slum or informal settlement area of the urban area essentially because the localities are in close proximity to their workplaces.
Factor 9: Density
Factor 9, with an Eigenvalue of 1.043, explains 4.012% of the determining variables of spatial footprint growth of informal settlements in Enugu City. It is highly and positively loaded onto increased population of informal settlements, with a factor loading of 0.913. It must be noted that the presence of people in an area attracts more people, because individuals usually bring their relations to reside with or among them, due to the communal nature of Nigerians and Africans, in general. Furthermore, this increase in the population of informal settlements often breeds good social relationships among the residents. Some of the residents noted that they like the communal relationship they share with their close neighbours who are sometimes closer than a biological brother. Dubovyk et al. (2011) and Abebe (2011: 71-72) showed that population density is the strongest factor that positively influences informal settlements densification from low to medium density. Although high population density affects the growth of informal settlements in Enugu State (about 2.5% annual growth rate), this is at the lowest rating.
6. CONCLUSION
The study examined the dimension of informal settlement footprint growth in Enugu City, in order to generate baseline information that can guide efforts at achieving a sustainable city. The spatial occupation by the footprint of the informal settlements studied showed that all five informal settlements have expanded spatially between 2003 and 2017. Yet their rate of spatial densification by footprint tends to differ significantly. Ikirike Campus 1, Iva Valley Pottery, Ugboghe, and Ngenevu showed a consistent progressive spatial density in footprint throughout fourteen years of study with the varying growth rate. However, Ugboghe has the highest land area among the studied settlements and the highest footprint for the years captured, while Akumkpirishi has the least land area and the least footprint. An average of 7% annual growth rate in footprint density of the informal settlements studied was noted. It is recommended that the policy should be adjusted, in order to use the utilisation of geographic information system technologies for informal settlements management in Enugu City as a basis for sustainable planning and management of the city. Meanwhile, the study revealed that nine factors were responsible for the growth of informal settlements in Enugu City. The factors, in the order of the highest impact to the least, are unrelated needs (closeness to water bodies), poverty and control constraint (shortage of low-cost housing), societal constraint (difficulty to access housing loan), employment potential (closeness to agricultural land), accessibility and conveyance (closeness to railway), formal urbanism (closeness to major roads), unforeseen constraint (vulnerability and economic downturns), closeness to workplace (closeness to workplace), and density (increased population of informal settlements).
This study provided some major causes that trigger the growth of informal settlements. UN-HABITAT (2003) showed that the challenge of informal settlements is so poorly understood that interventions applied only handle the symptoms instead of their fundamental causes. Addressing these factors will serve as basis for charting the course or solutions to informal settlement growth. The study recommends that urban managers enforce development control on such locations (areas close to water bodies, areas close to other informal settlements, private vacant land, government vacant lands, areas close to major investments, and so on) that were shown in this study to encourage the growth and development of informal settlements in the city, so as to mitigate against the intrusion of informal land occupiers into such areas. Furthermore, in understanding the factors that trigger informal settlement development, Enugu City administrators can also anticipate and leverage more incremental planning, whereby areas close to the identified space factors are annexed into the city development through the provision of services, for healthier Enugu City development. However, there should also be incremental formalisation of existing informal settlements in collaboration with informal settlements dwellers and administrators to build healthier communities in Enugu City. Altghough Enugu Capital Territory Development Authority (ECDTA) makes an effort to demolish shanty structures along roadways in the cities, this should be extended to settlements with degraded environment. The aim, however, should be a healthy and functional city for all, not the eradication of existing informal settlements but their incremental upgrading and formalisation. In addition, the government of Enugu State should provide more social welfare packages (for those with low skills, those affected by economic recession, and so on) to socially assist informal settlement dwellers in ameliorating their standard and enabling them to help themselves in the formalisation and upgrading of their settlements. These will ensure a holistic approach to improving existing informal settlements and preventing the growth of future degraded informal settlements, while meeting and empowering the poor to meet their housing needs.
7. LIMITATIONS OF THE STUDY
The study was for Enugu City in Southeast Nigeria. The general application of the findings to all cities of Nigeria and beyond cannot be guaranteed.
REFERENCES
ABBOTT, J. 2003. The use of GIS in informal settlement upgrading: Its role and impact on the community and on local government. Habitat International, 27(4), pp. 575-593. https://doi.org/10.1016/S0197-3975(03)00006-7 [ Links ]
ABEBE, F.K. 2011. Modelling informal settlement growth in Dar es Salaam, Tanzania. Unpublished Master's thesis. Faculty of Geo-Information and Earth Observation, University of Twente, Enschede, The Netherlands. [ Links ]
AHMED, S. & BRAMLEY, G. 2015. How will Dhaka grow spatially in future? Modelling its urban growth with a near future planning scenario perspective. International Journal of Sustainable Built Environment, 4(2), pp. 359-377. doi:10.1016/j.ijsbe.2015.07.003 [ Links ]
AKINTOYE, A. & MAIN, J. 2007. Collaborative relationships in construction: The UK contractor's perception. Engineering, Construction and Architectural Management, 14(6), pp. 597-617. http://dx.doi.org/10.1108/09699980710829049 [ Links ]
AMNESTY INTERNATIONAL. 2009. The unseen majority: Nairobi's two million slum-dwellers. London: Peter Benenson House. [ Links ]
CITY ALLIANCE. 2014. About slum upgrading. [Online]. Available at: <http://www.citiesalliance.org/About-slum-upgrading> [Accessed: 15 August 2016]. [ Links ]
CRESWELL, J.W. 2014. Research design: Qualitative, quantitative and mixed methods approaches. 4thedition. Thousand Oaks, CA: Sage. [ Links ]
CROSS, C. 2013. Delivering human settlements as an anti-poverty strategy: Spatial paradigms. In: Pillay, U., Hagg, G. & Nyamnjoh, F. (Eds). State of the Nation: South Africa 2012-2013. Cape Town: HSRC Press, pp. 239-272. [ Links ]
DUBOVYK, O., SLIUZAS, R. & FLACKE, J. 2011. Spatio-temporal modelling of informal settlement development in Sancaktepe district, Istanbul, Turkey. ISPRS Journal of Photogrammetry and Remote Sensing, 66(2), pp. 235-246. doi:10.1016/j. isprsjprs.2010.10.002 [ Links ]
ESRI. 2010. GIS in the web-era. [Online]. Available at: <http://www.downloads2.esri.com/ESRIpress/images/188/11539_WeGIS_Chapter01.pdf> [Accessed: 15 August 2020]. [ Links ]
FEKADE, W. 2000. Deficits of formal urban land management and informal response under rapid urban growth, an international perspective. Habitat International, 24(2), pp. 127-150. http://dx.doi.org/10.1016/S0197-3975(99)00034-X [ Links ]
GITHIRA, D.N. 2016. Growth and eviction of informal settlements in Nairobi. Unpublished Master's thesis. Faculty of Geo-Information and Earth Observation, University of Twente, Enschede, The Netherlands. [ Links ]
HAIR, J.F., BLACK, W.C., BABIN, B.J. & ANDERSON, R.E. 2014. Multivariate data analysis. 7th edition. Hoboken, Upper Saddle River: Pearson Education. [ Links ]
HANSEN, K.T. & VAA, M. 2004. Introduction. In: Hansen, K.T. & Vaa, M. (Eds). Reconsidering informality: Perspectives from urban Africa. Oslo, Uppsala: Nordic African Institute (NAI), pp. 7-24. [ Links ]
KREJCIE, R.V. & MORGAN, D.W. 1970. Determining sample size for research activities. Educational and Psychological Measurement, vol. 30, pp. 607-610. https://doi.org/10.1177/001316447003000308 [ Links ]
KUSI, H. 2012. Doing qualitative research: A guide for researchers. Accra: Emmpong Press. [ Links ]
LORENZO-SEVA, U., TIMMERMAN, M.E. & KIERS, H.A.L. 2011. The Hull method for selecting the number of common factors. Multivariate Behavioral Research, 46(2), pp. 340-364. https://doi.org/10.1080/00273171.2011.564527 [ Links ]
MATRIX DEVELOPMENT CONSULTANTS. 1993. Nairobi's informal settlements: An inventory. Report for USAID/REDSO/ESA. Nairobi. [ Links ]
MINETOS, D., POLYZOS, S. & SDROLIAS L. 2007. Features and spatial analysis of illegal housing in Greece. Transactions on Line, 1(1), pp. 86-107. [ Links ]
MOYO, T. & CRAFFORD, G. 2010. The impact of hyperinflation on the Zimbabwean construction industry. Acta Structilia, 17(2), pp. 53-83. [ Links ]
NEWAYA, T.P. 2010. Rapid urbanization and its influence on the growth of informal settlements in Windhoek, Namibia. Unpublished Master's thesis. Department of Town and Regional Planning, Cape Peninsula University of Technology, South Africa. [ Links ]
ODOEMENE, A.C. & OLAOBA, O.B. 2009. Explaining inter-ethnic co-existence and harmony in Enugu City, South-east Nigeria. African Journal on Conflict Resolution, 6(8), pp. 9-13. DOI: 10.4314/ajcr.v10i1.59309 [ Links ]
OLAJUYIGBE, A.E., POPOOLA, O.O., ADEGBOYEGA, S.A. & OBASANMI, T. 2015. Application of geographic information systems to assess the dynamics of slum and land use changes in urban core of Akure, Nigeria. Journal of Sustainable Development, 8(6), pp. 311-325. DOI: 10.5539/jsd.v8n6p311 [ Links ]
OLOTUAH, A.O. & ADESIJI, O.S. 2006. Housing poverty, slum formation, and deviant behaviour. In: Proceedings of the Housing Studies Association Conference, University of Lincoln, Lincoln, UK, 8-9 September, pp. 3-10. [ Links ]
ONODUGO, V., EZEADICHIE, N., ONWUNEME, C. & ANOSIKE, A. 2016. The dilemma of managing the challenges of street vending in public spaces: The case of Enugu City, Nigeria. Cities Publication, vol. 59, pp. 95-101. https://doi.org/10.1016/j.cities.2016.06.001 [ Links ]
PALLANT, J. 2013. SPSS, survival manual: A step-by-step guide to data analysis using IBM, SPSS. 5th edition. London: Allen & Unwin. [ Links ]
RAI, N. & THAPA, B. 2015. A study on purposive sampling method in research. Kathmandu: Kathmandu School of Law. [ Links ]
ROSSONI, L., ENGELBERT, R. & BELLEGARD, N.L. 2016. Normal science and its tools: Reviewing the effects of exploratory factor analysis in management. Revista de Administração, 51(2), pp. 198-211. https://doi.org/10.5700/rausp1234 [ Links ]
ROY, D., LEES, M.H., PALAVALLI, B., PFEFFER, K. & SLOOT, M.A.P. 2014. The emergence of slums: A contemporary view on simulation models. Environmental Modelling and Software, vol. 59, pp. 76-90. https://doi.org/10.1016/j.envsoft.2014.05.004 [ Links ]
SHEKHAR, S. 2012. Modeling the probable growth of slums by using Geoinformatics. Innovation Development Indian Journal, 1(8), pp. 588-598. [ Links ]
SIETCHIPING, R. 2005. Prospective slum policies: Conceptualization and implementation of a proposed informal settlement growth model. Paper presented at the 3rd Urban Research Symposium on Land Development, Urban Policy and Poverty Reduction, 4-6 April, Brazil. [ Links ]
SIRUERI, F.O. 2015. Comparing spatial patterns of informal settlements between Nairobi and Dar es Salaam. Unpublished Master's thesis. Faculty of Geo-Information and Earth Observation, University of Twente, Enschede, The Netherlands. [ Links ]
SLIUZAS, R.V. 2004. Managing informal settlements: A study using geo-information in Dar es Salaam, Tanzania. Unpublished PhD dissertation, Utrecht University, The Netherlands. [ Links ]
TABER, K.S. 2018. The use of Cronbach's Alpha when developing and reporting research instruments in science education. Research in Science Education, 48, pp. 273-1296. DOI 10.1007/s11165-016-9602-2 [ Links ]
THAPA, R.B. & MURAYAMA, Y. 2010. Drivers of urban growth in the Kathmandu valley, Nepal: Examining the efficacy of the analytic hierarchy process. Applied Geography, 30(1), pp. 70-83. https://doi.org/10.1016/j.apgeog.2009.10.002 [ Links ]
TUROK, I., BUDLENDER, J. & VISAGIE, J. 2017. The role of informal urban settlements in upward mobility. Development Policy Research Unit Working Paper 201505. DPRU, University of Cape Town. [ Links ]
UN-HABITAT. 2003. The challenge of slums: Global report on human settlements. London: Earthscan Publications Ltd. [ Links ]
UN-HABITAT. 2015. Informal settlements. Habitat III Issue Paper 22. New York: United Nations Human Settlements Programme. [ Links ]
UNDESA. 2019. World urbanization prospects: The 2019 revision. [Online]. Available at: <https://population.un.org/wup/DataQuery/> [Accessed: 1 July 2020]. [ Links ]
UNITED NATIONS. 2015. Millenium development goals indicators. Indicator 7.10 Proportion of urban population living in slums. [Online]. Available at: <http://mdgs.un.org/unsd/mdg/seriesdetail.aspx?srid=710> [Accessed: 1 July 2020]. [ Links ]
WAHAB, B. & AGBOLA, B. 2017. The place of informality and illegality in planning education in Nigeria. Planning Practice & Research, 32(2), pp. 212-225. https://doi.org/10.1080/02697459.2016.1198565 [ Links ]
XIE, C., HUANG, B., CLARAMUNT, C. & CHANDRAMOULI, C. 2005. Spatial logistic regression and GIS to model rural-urban land conversion. In: Proceedings of PROCESSUS 2ndInternational Colloquium on the Behavioural Foundations of Integrated Land-use and Transportation Models: Frameworks, Models and Applications, 12-15 June, University of Toronto, Canada. [ Links ]
Received: June 2021
Peer reviewed and revised: October 2021
Published: December 2021
* The author declared no potential conflicts of interest with respect to the research, authorship, and/or publication of this article

