


Services on Demand
Article
 English (pdf)
 Article in xml format
 Article references
Indicators

Related links
-
 Cited by Google
 -
 Similars in Google
Share

 Permalink
Town and Regional Planning
On-line version ISSN 2415-0495
Print version ISSN 1012-280X
Town reg. plan. (Online) vol.77 Bloemfontein 2020
http://dx.doi.org/10.18820/2415-0495/trp77i1.9
ARTICLES
Structuring South Africa's national economic space: A regional corridor network model approach
Ho aha sebaka sa moruo oa naha ea Afrika Borwa: Mokhoa ka litshebeletso tsa tikoloho
André BrandI; Ernst DrewesII, *
IDirector, Geography, Statistics South Africa, ISIbalo House, Koch street, Salvokop, Pretoria, South Africa. Phone: 012 337 6351, email: <andreb@statssa.gov.za>, ORCID: orcid.org 0000-0002-6587-8899; Extra-Ordinary Senior Lecturer, Urban and Regional Planning, North-West University, Potchefstroom, South Africa
IIDepartment of Town and Regional Planning, North-West University, Potchefstroom, South Africa. Phone: 18 299 2543, email: <ernst.drewes@nwu.ac.za>, ORCID: https://orcid.org/0000-00034094-4922. * (corresponding author)
ABSTRACT
South Africa adopted a National Development Plan (NDP) (2013), referred to in the National Spatial Development Framework (NSDF) (2019) as a 'super plan', to transform national space economy and in the process disrupt the apartheid spatial logic. The South African National government adopted a series of acts and policies; sector plans and programmes, as well as strategic infrastructure investment programmes to eliminate the triple challenges of inequality, unemployment and poverty. This requires a strategic response, including a reorientation of selecting specific cities or regions as preferred locations to create development opportunities. Such a strategic response would require justifiable spatial solutions that can promote economic development. The article focuses on development corridors as a potential solution, elevating the importance of regional attractiveness as essential for economic growth. It is anticipated that the evolution of development corridors will result in the strengthening of cities and regional centres linked to the benefits exerted by corridors, on the one hand, and strong intra-national and interregional economic integration, on the other. The article concludes that development corridors are created to seek development opportunities, thereby increasing the spatial attractiveness of regions and cities that may provide for better economic spaces in South Africa.
Keywords: Development axis, development centres, development corridors, development opportunities, economic space development, regional attractiveness, regional corridor network
OPSOMMING
Suid-Afrika het 'n Nasionale Ontwikkelingsplan (NOP) (2013), ook na verwys in die Nasionale Ruimtelike Ontwikkelingsperspektief (NROP) (2019) as 'n 'superplan', aanvaar om die nasionale ruimte-ekonomie te omskep en, in die proses, apartheid se ruimtelike logika te ontwrig. Die Suid-Afrikaanse Nasionale regering het 'n reeks wette en beleide, sektorplanne en programme, sowel as strategiese infrastruktuur-belegginsprogramme aanvaar om die drievoudige uitdagings van ongelykheid, werkloosheid en armoede te elimineer. Dit verg 'n strategiese reaksie, insluitend 'n heroriëntasie van die selektering van spesifieke stede of streke as voorkeurliggings om ontwikkelingsgeleenthede te skep. So 'n strategiese reaksie sal regverdigbare ruimtelike oplossings verg wat ekonomiese ontwikkeling kan bevorder. Die artikel fokus op ontwikkelingskorridors as 'n potensiële oplossing wat die belangrikheid van streeksaantreklikheid as noodsaaklik vir ekonomiese groei, uitlig. Daar word verwag dat die evolusie van ontwikkelingskorridors sal lei tot die versterking van stede en streke wat gekoppel is aan die voordele wat deur die korridors uitgeoefen word, enersyds, en tot sterk intranasionale en interstreekse ekonomiese integrasie, andersyds. Die artikel kom tot die gevolgtrekking dat ontwikkelingskorridors geskep word om na ontwikkelingsgeleenthede te soek wat sodoende die ruimtelike aantreklikheid van streke en stede sal verhoog wat moontlik vir beter ekonomiese ruimtes in Suid-Afrika kan sorg.
Sleutelwoorde: Ekonomiese ruimte-ontwikkeling, ontwikkeling-as, ontwikke-lingnodes, ontwikkelingsgeleenthede, ontwikkelingskorridors, streekaantrekl-ikheid, streekskorridor
SA BONAHALENG
Aforika Borwa e amohetse Leano la Ntshetsopele ya Naha (NDP) (2013) e boletsweng ho NSDF (2019) e le 'moralo o moholo' oa ho fetola moruo oa sebaka sa naha le ts'ebetsong ho senya mohopolo oa karohano ea karohano. Mmuso oa naha ea Afrika Boroa o boetse oa amohela letoto la melao le maano; merero le manane a makala; le mananeo a ntshetsopele ea litshebeletso ele ho felisa mathata a mararo a akaretsang, eleng a ho se lekane hoa sechaba, tlhokahalo ea mesebetsi le bofuma. Sena se hloka maqheka a hlakileng a tshebetso, ho kenyelletsa thlophiso-botjha ho khetha litoropo tse itseng kapa libaka tse ikhethileng joaloka tse ratoang ke sechaba, ele ho theha menyetla ea matsete. Maqheka a joalo a hloka ntshetsopele e loketseng sebaka se ka khothaletsang kholo ea moruo. Tharollo e 'ngoe e joalo e ka ba ntshetsopele ea lithsebeletso tsa ntlafatso ele ho phahamisa bohlokoa ba ho hohela kholo ea moruo libakeng tse khathehileng. Ho lebeletsoe hore phetoho ea lits'ebeletso tsa nts'etsopele e tla baka, ka lehlakoreng le leng, ho matlafatsoa ha litoropo le libaka tsa tikoloho tse amanang le melemo e hlahisoang ke litshebeletso tsa ntshetsopele, ha ka lehlakoreng le leng, ho ba le kopanelo e matla ea moruo lipakeng tsa tikoloho tsa naha le machaba. Ka hona, lits'ebeletso tsa nts'etsopele li thehiloe ho batla menyetla ea kholo ka ho eketsa khahleho ea libaka le litoropo, e ka bakang libaka tse ntlafalitsoeng tsa moruo Afrika Boroa.
1. INTRODUCTION
To eliminate the main challenges of inequality, unemployment and poverty, the National Development Plan (NDP) (South Africa, 2013a: 24) proclaims "South Africa needs an economy that is more inclusive, more dynamic and in which the fruits of growth are shared more equitably". This, in essence, refers to initiating spatial transformation. The National Spatial Development Framework (NSDF) (South Africa, 2019: 24-38) states that the transformation of national space economy needs to be understood against disrupting the apartheid spatial logic. This requires a stronger focus on areas where sufficient agglomeration economies exist, which, according to Drewes (2015: 61), maintains that economic space development is the outcome of selecting specific cities or regions as preferred locations to create development opportunities, i.e. spatial targeting.
Although mining activities continue to be the backbone of the South African industry, intensive industrialisation has expanded rapidly since the 1930s and, as a result, the population of towns and cities increased sharply (Kwamena-Poh, 1986: 64). This resulted in the creation of functional and locational connections between economic nodes, where large amounts of economic resources are concentrated. Batten (1994: 316) referred to functional and locational connections as networks, within which trade occurred and, according to him, this played an important role in the creation of scope economies, i.e. creating synergies of interactive growth. In the South African landscape, economic networks and synergies of interactive growth revolve mainly around cities and city regions, which accommodate over 65% of the national economy (Van Huyssteen, Mans, Le Roux, Maritz, Ngidi & Maditse, 2016: 5-7).
The agglomeration of economies at interdependent locations such as cities and city regions can lead to the creation of competitive advantages (Strzelczyk, 2015: 10; SACN, 2016: 29). New concepts such as spatial attractiveness (the capacity to attract new investment and development opportunities) for promoting regional economic development are becoming a growing importance for all spheres of government (Snieska, Zykiene & Burksaitiene, 2019: 928). The role of regions has increasingly been considered a key element to strengthen economic development. Therefore, different elements such as the effectiveness of infrastructure, network linkages, quality of life, image, institutional capacity and economic activities, which determine regional attractiveness, are substantial factors for attracting new enterprises to create development opportunities (Strzelczyk, 2015: 10; Snieska et al., 2019: 930).
The South African government emphasised various initiatives to offer the most productive and attractive environment to attract new businesses and industries that will enhance economic development. One such initiative, as emphasised in the draft NSDF late in 2019 (South Africa, 2019: 94), is development corridors (appropriate national and supra-national corridors) that seek to overcome the causes and consequences of regional disparities and to structure regional attractiveness (South Africa, 2013a: Chapter 8). Although the restructuring of economic spaces is one of the South African government's economic development initiatives, there is a lack of development corridors as a strategic element in identifying investment opportunities promoting the restructuring of economic spaces in South Africa. This article introduces regional corridor networks as a model to theoretically determine the potential of the most noteworthy development corridors in South Africa. In this article, the regional corridor network model is used to measure key development programmes (i.e. the IDZs, the IPP and Development Corridors), in order to determine whether these programmes promote intra-regional and global trade opportunities in South Africa.
Although there are different research techniques, this article employed a quantitative approach, which is central to the process of measurement, i.e. it provides the fundamental connection between empirical observation and mathematical expression of quantitative relationships (spatial relationship between regional centres based on numerical algorithms), which is the core logic.
2. LITERATURE REVIEW
In order to understand how development corridors can structure South Africa's national economic space, it is important to introduce the current theory on regional corridor networks included in this article. The existing theory focuses on development corridors, regions, urban areas and spatial frameworks to define the elements included in the proposed regional corridor network model.
2.1 Development corridors
The concept of what a development corridor entails is by no means regarded as simplistic. Development corridors are more than simply linkages; development corridors are integral to the economic footprint of a region and country (Brunner, 2013: 3-5). Most of the interpretations put forward by scholars such as Friedmann (1972), Tuppen (1977), Geyer (1988), Andersen and Burnett (1998), Arvis (2011), Buiter and Rahbari (2011), Henning and Saggau (2012), Srivastava (2012), Brunner (2013), and Brand (2017) reveal different perceptions of the concept. As a concept in their view, it is generally referred to as promoting urban reconstruction and the enhancement of urban growth.
However, corridors also bring forth other important alternatives such as the channelling of economic growth, the reconstruction of fragmented spatial disparities (Henning & Saggau 2012), the building or rebuilding of regions, and the mapping of economic spaces (Buiter & Rahbari, 2011: 7). Development corridors have two prominent characteristics: a link between nodes provides access to different levels of economic opportunities, and the intensity of economic development at nodes varies in size and dominance (Arnold, 2005: 6; Srivastava, 2012: 6; Mulenga, 2013: 2).
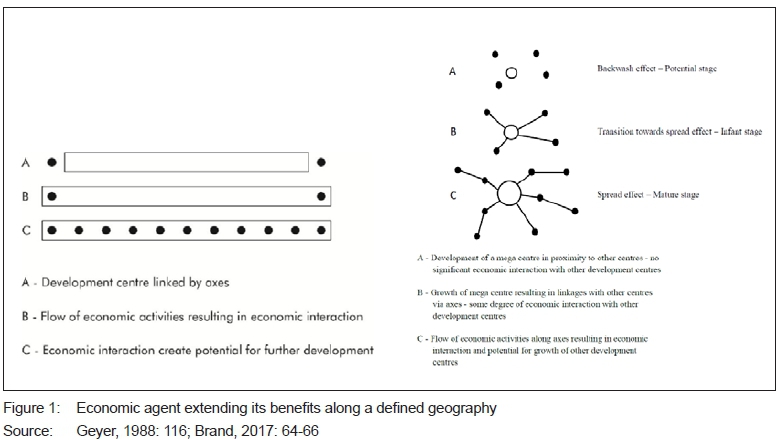
Hope and Cox (2015: 2) emphasised that development corridors connect economic agents along a defined geography (see Figure 1). Development corridors provide linkages between economic nodes, in which large amounts of economic resources are concentrated, i.e. linking the supply and demand sides of markets (Brunner, 2013: 1). Development corridors do not channel economic growth in isolation, but rather as a network (Brunner, 2013: 1).
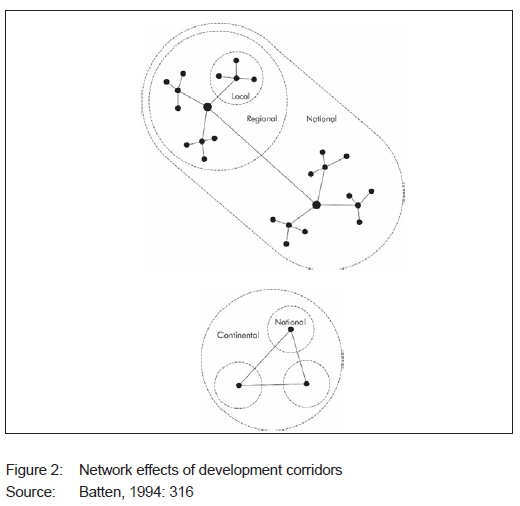
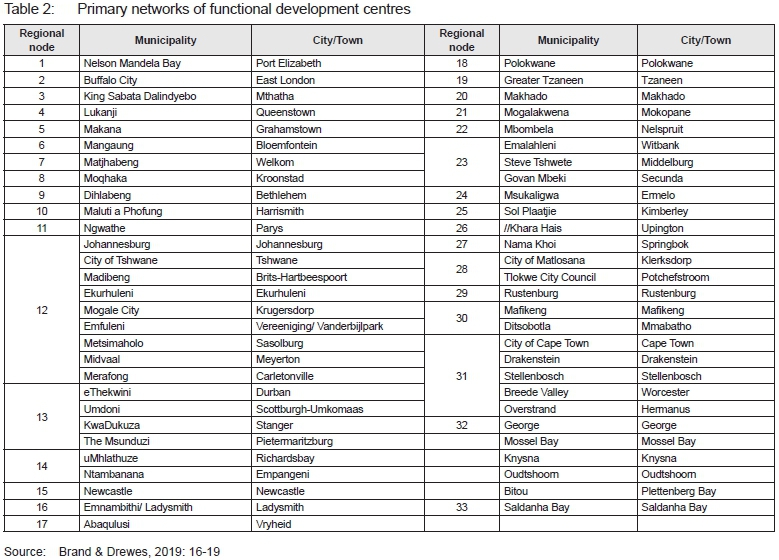
This supports the notion put forward by Batten (1994: 316) and Tudora and Eva (2014: 103) that the concept of nodality is the linking of a network of development centres, within which trade occurs (see Figure 2). Combining the various development centres within a network forms a unique, flexible exchange environment. Cooperation and linkages not only improve the economic performance of development centres, but also overcome uneven regional development, economic competitiveness and sustainability (Aydan Sat, 2018: 74).
Development corridors can thus be described as axes that express forces of development, i.e. they are an outcome of the flow of activities (goods, services and information) between urban and regional centres, which leads to the manifestation of economic development. The functional relationships between development centres play an important and decisive role in the creation of corridors. Functional relationships are more than simply physical connections; they also provide for non-physical connections such as shared economic spaces (Brand & Drewes, 2019: 4). Aydan Sat (2018: 66) emphasised that functional dimension focuses on the flows among different centres, which give information about their interdependencies and interrelations. The application of the regional corridor model (see relevant section) provides such insight on functional relationships. One can, therefore, conclude that development corridors create opportunities to strengthen partnerships and increase the spatial attractiveness of regions and cities. One can surmise that linking regions and cities not only improves their operational and economic efficiency, but also creates a myriad of new economic opportunities; more specifically, it creates integrated networks of systems supporting the flow of goods; improved infrastructure; increased and more efficient interactions, and expanded business involvement.
2.2 South African regions and urban areas
South Africa's cities, towns and localities have developed and become hierarchised over the course of a history, during which population settlements and their distribution have been influenced by colonisation, segregation, industrialisation, and globalisation (Giraut & Vacchiani-Marcuzzo, 2012: 3). Since 1911, South Africa has undergone a long phase of intense urban growth, with urban areas such as Johannesburg, Cape Town and Durban (eThekwini) agglomerating into dominating economic spaces (Van Huyssteen et al. 2016: 1). Many people hailed the end of apartheid in 1994 with optimism, as South Africa became one of the most advanced countries in Africa, with thriving cities integrated into global economies (South Africa, 2016c: 4).
The post-1994 political changes had a profound impact on population and economic distribution patterns (South Africa, 2019: 27-28). The reason is considered against the background of colonialism and apartheid, when areas were (spatially) excluded. This exclusion hampered economic development and growth. In the post-1994 period, when apartheid had ended, many people who had been prevented from migrating in the past, left rural areas for urban areas. This migration of people, mostly characterised by large numbers of Black Africans and largely triggered by Todaro's (1969: 138) "bright lights syndrome", was essentially productionism-oriented, i.e. when people migrate primarily with the aim of finding employment (Bakker, Parsons & Rauch, 2016: 7-11; South Africa, 2016c: 4). The migration caused unprecedented population explosions in towns and cities of all sizes in the country. National governments, introducing several acts, policies and programmes, aimed to redress the spatial legacies of colonial and apartheid rule. Government initiatives were directed at strengthening economic development and creating strategic regional, interregional and intergovernmental planning platforms (Van Huyssteen, Biermann, Naude & Le Roux, 2009: 203-204; Van Huyssteen, Green, Sogoni, Maritz & McKelly, 2018: online; South Africa, 2019: 24-38).
2.3 South African regions and urban areas functionality
There is a growing international awareness that location and place, which, in essence, refer to regions and urban areas, are important elements for growth and development. This growing international awareness has had an important influence on various development approaches promoted by organisations such as the United Nations (UN), the Organisation for Economic Co-operation and Development (OECD), the European Commission (EC), and the World Bank (WB), where extensive rethinking followed to promote the benefits of urbanisation, as a result of the advantages cities offer for economic and social development.
According to Van Huyssteen et al. (2016: 1), the Council for Scientific and Industrial Research (CSIR) developed a regional functional index as part of the National Spatial Trends Overview project commissioned by the South African City Network (SACN). Subsequently, the Presidency and the Department of Provincial and Local Government (DPLG) (and later Cooperative Governance and Traditional Affairs [CoGTA]) used the index to inform the Cabinet on aspects of the urban development policy, as well as during the process of developing a National Urban Development Framework (NUDF) (and later Integrated Urban Development Framework [IUDF]).
The development of the index was based on a classification of settlement patterns, by considering three main functionalities (Van Huyssteen et al., 2009: 203-204):
• Size reflects the agglomeration of economies and population.
• Function indicates an area's economic role, e.g. mining, manufacturing and tourism, and its role, in terms of public and private service delivery.
• Institutional legacy reflects inherited characteristics of past policies, particularly the land-use policies that fostered economic and residential segregation within cities.
Applying the functional index allowed for the delimitation of the economic catchment areas of each settlement in the country and was simultaneously used to determine nested patterns of higher and lower order centres in the country's hierarchy of central places. Functional analysis entails characterisation of regional economic systems in terms of dominant functions and their order of magnitude in their central places, to the actual and potential systematic linkages and relationships between economic composition and places.
The importance of the index is found in the latter showing how the country can be subdivided into functional areas based on the economic catchment areas of higher order centres. This, in turn, will determine spatial targeting, i.e. the functional index provides a mechanism to profile, identify, calculate, and analyse a set of development information and trends pertaining to the range of towns and cities across South Africa. This simplifies the analysis of the network of towns and cities and their hierarchical and functional relationships in relation to economic spaces. The index has subsequently been used in the NDP (2013) as a parameter to classify cities in South Africa (South Africa, 2013a: Chapter 8; South Africa, 2019: 116-118).
The index provides a description of a 'network of towns' as a continuous landscape, interrelated through complex economic, social, political, and environmental forces. This means that the discrete consideration of lower order centre development as completely distinct from higher order centre development is, therefore, no longer valid. Instead, the index provides a balanced approach that addresses both ends of the continuum, rather than lower order centres in isolation from higher order centres (demonstrated under Table 2 of the regional corridor networks). In summary, the index provides an inclusive development framework that complements the current and emerging economic development in South Africa. Table 1 provides a breakdown of the categories and classification criteria, defining the South African urban system and, ultimately, the distribution of economic spaces.
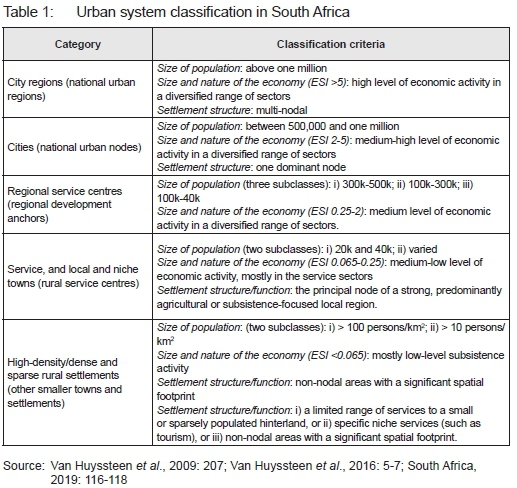
According to the classification, there are five main urban systems, with city regions being the most dominant. The city regions comprise Gauteng (City of Johannesburg; Tshwane, and Ekurhuleni); Cape Town; Durban (eThekwini), and Nelson Mandela Bay (Port Elizabeth), each having the highest level of economic activities. A spatial analysis of the urban categories suggests that the city regions and cities significantly dominate the South African economic spaces. Furthermore, a sector analysis of the city regions and cities not only identifies diverse economies that play a significant role as the core cylinder of South Africa's agglomeration economies, but also that city regions and cities provide key linkages for comparative advantages and development opportunities (Van Huyssteen et al., 2016: 1; StepsSA, 2018: online).
A study by Van Huyssteen, Meiklejohn, Coetzee, Goss and Oranje (2010: 34-38) clearly shows that a national overview of city regions and cities illustrates not only the main agglomeration economies and increased opportunities, but also an increased concentration of interconnected networks of urban and functional regions.
2.4 South African spatial frameworks
Various South African spatial frameworks are available and considered by the different spheres of government in the domain of spatial planning (Schoeman, 2015: 49). Although many of these frameworks are standing on the periphery of the planning system (policies and legislation), only a few are key when considering strategies on how to best manage the country's ability to achieve social and economic transformation (Brand, 2017: 113). The actual implementation of policy and legislation in South Africa has been criticised, because the implementation and coordination between the vertical and horizontal government spheres remains lacking (Terreblanche, 2014: 156-157).
The following policies and legislation are considered to be key strategies:
• The NDP (2013), emphasises the beginning of a new focus on strategic spatial planning for South Africa.
• The National Infrastructure Plan (NIP) (2012) envisions a long-term planning framework for investment in major strategic infrastructure projects as incorporated and promoted in the NDP (2013).
• The Industrial Policy Action Plan (IPAP) (2010), introduces IDZs as a tool to assist in the economic development of regions.
• The National Transport Master Plan (NATMAP) (2011) envisions a dynamic, long-term, sustainable land-use and multimodal (road, rail, air and sea) transportation systems framework for the development of network infrastructure facilities.
• The Integrated Urban Development Framework (IUDF) (2014) unlocks development synergies that emanate from coordinated investments in cities, thereby ensuring a new approach for South African regions, cities and towns.
• The Spatial Planning and Land-Use Management Act (SPLUMA) (2013) brings together, through the development of Spatial Development Frameworks (SDFs) ranging from national to local, the collective vision of government, businesses, and civil society to promote social and economic inclusion (South Africa, 2010; 2011; 2012; 2013a; 2013b; 2016b; 2019).
These policies and legislation provide guidelines relating to spatial development, whether it is at a national, provincial, regional, or local level. The reasons being that they provide the means whereby diverse sector requirements are captured and coordinated; they are where the normative principles (outcomes) can be interpreted, in relation to spatial challenges, and they provide the opportunity to ensure that capital budgeting is directed towards desired investment opportunities (Brand, 2017: 131). The central role of these policies and legislation in strategic spatial planning, sector alignment and spatial targeting of government investment means that spatial transformation will be more explicit, in terms of its geographical application, i.e. stronger focus will be placed on areas where sufficient agglomeration economies exist. This aligns with Drewes' (2015: 61) submission that economic space development is the outcome of selecting specific cities or regions as preferred locations to create development opportunities.
However, this stronger focus requires reconstruction actions and, in this regard, the South African government has responded by placing strong emphasis on various initiatives such as Strategic Infrastructure Projects (SIPS) covering social and economic infrastructure to fast-track development and growth; IDZs to support sustained economic growth in the manufacturing sector; Action Agenda to interconnect cities and transportation systems, and Development Corridors for both southern and South Africa, to promote economic investment opportunities, as the key mechanism to not only address spatial transformation, but also drive economic space development (South Africa, 2010; 2011; 2012; 2013a; 2016a; 2016b; 2019). These reconstruction action initiatives require a kind of unobstructed (unbiased) model that can serve as an interface, whereby spatial planning policies and legislation can be integrated to collectively guide economic space development.
3. PROPOSED REGIONAL CORRIDOR NETWORK MODEL
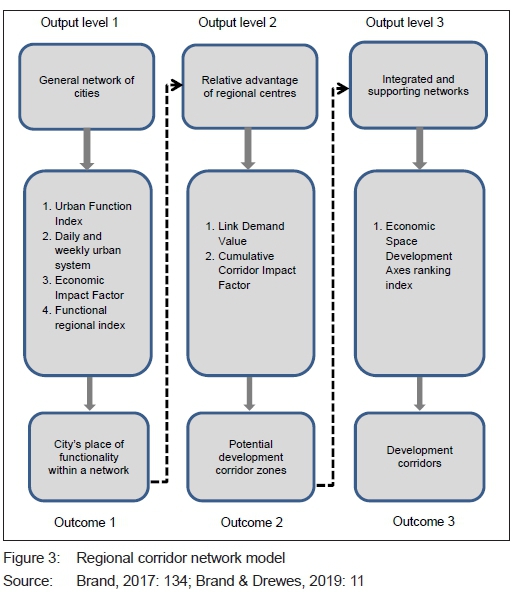
As far back as the 1930s, Wright (1934: 161) maintained that there are diverse approaches to specifying a model of interest. He was the first to suggest that the most intuitive way to specify a model is to describe it by means of a path diagram. In this regard and based on the literature reviewed for this article, Figure 3 illustrates in detail what regional corridor networks entail. A diagram provides a useful guide to clarify ideas about the relationships that exist among variables, which could be directly translated into corresponding equations for modelling. Models are used to imitate processes or systems, in order to illustrate the eventual real effects of specific conditions and the required courses of action, i.e. the creation of a model represents the key characteristics, behaviours and functions of the selected system or process. Furthermore, models require a process of analysis, where special rules and procedures are applied to properly visualise data for better understanding. The visual nature helps simplify the understanding of the data for better deductive reasoning (Wang & Wang, 2012: 2-3).
Brand (2017: 181) devised a spatial corridor model as a potential policy approach to structure national economic spaces. This concept was further advanced by Brand and Drewes (2019: 11-21) to produce the regional corridor network model. The regional corridor network model takes into account two important behaviours, namely what constitutes an economic space development when focusing on cities and regions as economic forces, and the concept and importance of development corridors as supporting networks to guide economic space development. The relevance of the article is based on measuring the potential strength of the spatial relationship between various regional centres. Therefore, the study is based on the modelling of economic spaces to create the opportunity to predict spatial targeting. The following data sets played a central role: population count defined as all usual residents, generally referred to as the de jure population, and the total of all persons present as the de facto population; economically active population defined as the fraction of a population that is either employed, or actively seeking employment, and GVA at basic prices defined as output valued at basic prices less intermediate consumption valued at purchaser's prices, i.e. GVA is known by the price with which the output is valued and is a useful way of comparing regions with different sizes of economies.
The methodology consists of three steps. The first step is to establish the spatial distribution of cities according to central functionality, which represents the economic dominance of cities relative to one another, i.e. creating a network of development centres. The second step is to establish the relative advantage of the network of development centres when considering distance friction and degree of benefits, i.e. creating potential development corridor zones. The third step is to establish the integrated and supporting networks of development corridors, upon which a regional spatial framework to guide economic space development can be fashioned. Each of the outputs is subjected to a chronological, step-by-step process constituting special rules and procedures being applied.
3.1 Regional centres place of functionality within a network
To create a network of development centres (output one) revolves around four steps:
• First, to establish a general functional network of cities and settlements. This first step mainly focuses on an Urban Function Index (UFI) (Van Huyssteen et al., 2018: online) to determine the economic weight of cities relative to one another and to distinguish between the sizes of the commercial, service and industrial components of urban economies. In essence, it determines the relative economic dominance of cities and settlements in relation to one another (Brand & Drewes, 2019: 11-21).
• Secondly, to convert the sphere of synergy that exists in the general network of cities into broader regional centres. This second step considers a daily and weekly urban system to convert the general network of cities into broader networks of regional centres. Cities have recently been linked to the daily and weekly urban system concepts and are used to quantify the relationships and flows (synergy) that exist between cities within a network (Geyer Jr., Geyer & Geyer, 2015: 5; Van Huyssteen et al., 2010: 34-38; Van der Linden, 2014: 26). The outcome elevates lower and higher order cities and settlements into broader regional centres when considering the concept of synergy, i.e. proximity - commuting distance between cities - when establishing functionality of central places (Brand & Drewes, 2019: 11-21).
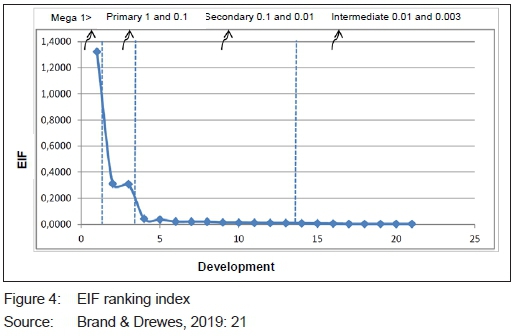
• Thirdly, to establish the degree of economic attraction or economic output levels exerted by each regional centre, in relation to one another. This third step is to establish the degree of economic attraction or economic output levels exerted by each regional centre, based on the economic weight, which is referred to as Economic Impact Factor (EIF)1(Brand & Drewes, 2019: 11-21). The outcome elevates the status of the most dominant economic spaces, based on the degree of economic attraction exerted by each regional centre.
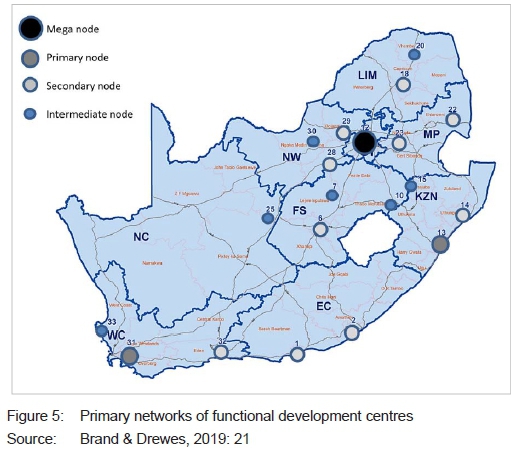
• Fourthly, to categorise the network of regional centres into a functional regional index. This last step is to categorise the distribution of the most dominant economic spaces into a functional regional index (Brand & Drewes, 2019: 11-21). The economic weight from the EIF provides for a natural break which translates into a ranking score, thereby allowing the opportunity to categorise each regional centre as either mega; primary; secondary, or intermediate. The regional index, in essence, identifies a region's 'place' of functionality (performance) within a network (Brand & Drewes, 2019: 11-21).
Figures 4 and 5 and Table 2 illustrate the outcome of the first output level.
3.2 Potential development corridor zones
To create potential development corridor zones (output two) revolves around two steps:
• First, to convert the degree of economic attraction exerted by each regional centre into prominent growth poles (node or development centre). This first step is to establish the relative advantage that exists between each regional centre. The relative advantage is derived from calculating the Link Demand Value (LDV)2between each regional centre as a simple gravity model (Brand, 2017: 155-158). The relative advantage or LDV of a given place attracts the centralisation and specialisation of economic activities, i.e. larger urban areas attract people, ideas and commodities more than smaller urban areas (Janelle, 1968: 351). Considering that distance friction ultimately defines the attraction levels between two places, i.e. if the distance increases, the attraction levels decrease and vice versa, a LDV value above one is considered the best fit (strongest attraction level) in determining which of the regional centres are considered the most prominent growth poles (Brand, 2017: 155-158).
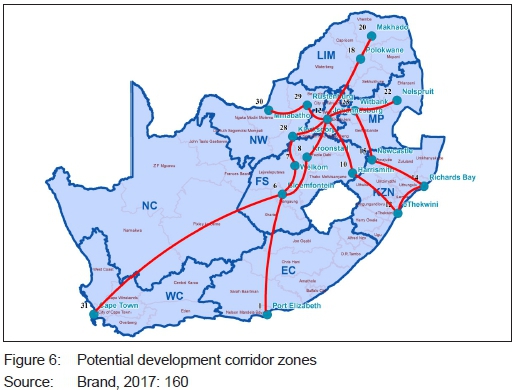
• Secondly, to convert the prominent growth poles into a Cumulative Corridor Impact Factor (CCIF),3 in order to create potential development corridor zones. Having established the most prominent growth poles allows the opportunity to convert the linkages between these poles into potential development corridor zones. Therefore, the second step is to convert the outcome from the LDVs into a CCIF. To achieve this, the linkages between mega, primary, secondary, and intermediate centres are segmented into sections and cumulative adding of each adjacent section (increasing by one addition after another) within the potential link determines the vitality (forcefulness) of a corridor zone. The outcome allows quantifying the degree or the force each mega, primary, secondary, and intermediate centre exerts as benefits through successive additions, which determine the overall strength of a corridor zone (Brand, 2017: 155-158).
Figure 6 illustrates the outcome for the second output level.
3.3 Potential of the most noteworthy development corridors
Having established the potential development corridor zones does not constitute development corridors. Therefore, to determine the potential of the most noteworthy development corridors (output three), the outcomes from the CCIF are converted into Economic Space Development Axes (ESDA). The ESDA determines, with the use of a ranking score, the ultimate, integrated and supporting networks of development axes, upon which a regional spatial framework to guide economic space development can be built. The ESDA considers breakpoints to translate the different strengths of potential development corridor zones into an ESDA ranking index. Applying the ranking index denotes the regional centres' size as an intersection point and the strength (force) of interaction that exists between regional centres (Brand, 2017: 159-163). Figures 7 and 8 illustrate the outcome of output level 3.
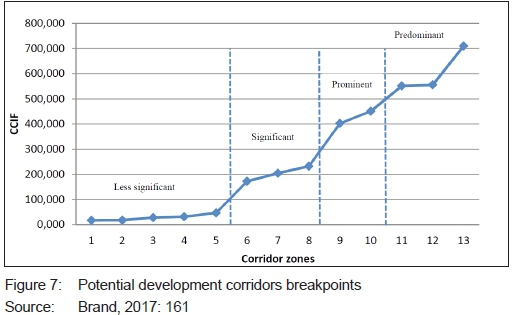
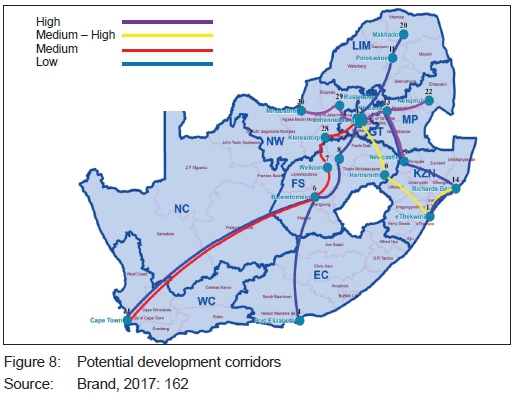
Evident from outcome 3 are the following:
• The most predominant potential development corridors, with a CCIF value of above 500, are:
» The Johannesburg to Newcastle (Johannesburg, Witbank and Newcastle) link
» The Johannesburg to Nelspruit (Johannesburg, Witbank and Nelspruit) link
» The Johannesburg to Mmabatho (Johannesburg, Rustenburg and Mmabatho) link.
• The most prominent potential development corridor, with a CCIF value of between 300 and 500, is the Johannesburg to Richards Bay (Johannesburg, Harrismith, Durban (eThekwini) and Richards Bay) link.
• The most significant potential development corridor, with a CCIF value of between 100 and 300, is the Johannesburg to Cape Town (Johannesburg, Klerksdorp, Welkom, Bloemfontein and Cape Town) link.
The application of the regional corridor network model illustrates that development corridors are key considerations for the pursuit of strategies for cohesion and sustainable development and can stimulate a more balanced development policy approach. This aligns with Meijers, Waterhout and Zonneveld's (2005: 99) submission that the distribution of economically relevant functions over a network addresses the way that a multitude of development centres rather than one or two, gains significance. From the model, one can surmise the following as key characteristics of development corridors: the economic weight or vitality of the development centres; the mutual interdependency between the development centres, and the physical and economic circumstances under which the development centres operate.
4. MEASURE KEY DEVELOPMENT PROGRAMMES
To assist the NDP and NSDF in carrying out their mandate, the regional corridor network model was used as a theoretical framework to measure key development programmes, namely the IDZs, initiated to support sustained economic growth in the manufacturing sector; the IPP, initiated to create investment opportunities to promote economic growth, and Development Corridors for both southern and South Africa, initiated to promote intra-regional and global trade opportunities for South Africa. Each of these programmes are briefly discussed and measured against the outcomes of the regional corridor network model.
4.1 Industrial development
A key initiative linked to the IPAP (2010), as an outflow from the IDZ, is government's IPP, spearheaded by the Department of Trade and Industry (DTI) (2010). The DTI prioritised various state-owned industrial parks (see Table 3 and Figure 9) as part of creating development opportunities to promote economic growth. According to the DTI, the initiative will go a long way in accelerating economic development in especially the lagging regions of the country. In the DTI's view, industrial parks will contribute towards economic growth, job creation and diversification of economic activity, as well as attracting investment opportunities. The DTI strongly believes that industrial parks will enable regions to build, strengthen and develop their strategic industrial capabilities (Industrial Property News, 2020: online).
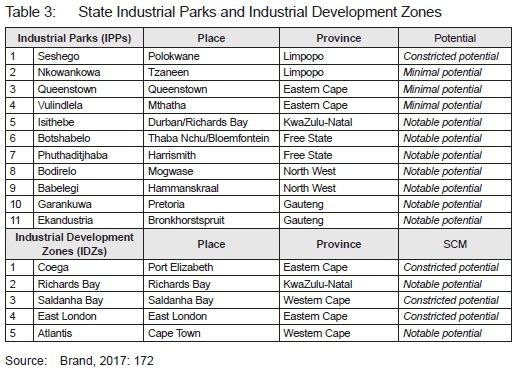
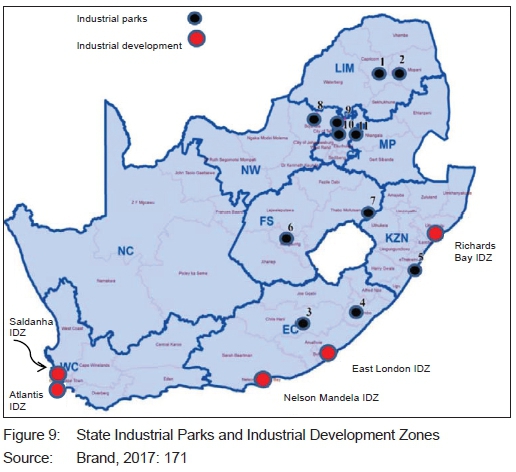
Measuring the IPPs against the outcomes of the regional corridor network model, considering Figures 5 and 8, Isithebe, Botshabelo, Phuthaditjhaba, Babelegi, Garankuwa, Bodirelo and Ekandustria stood out as having notable potential development opportunities for the following reasons. Isithebe is located on a prominent development axis extending between eThekwini (primary node) and Richards Bay (secondary node). Botshabelo is located in the proximity of Bloemfontein (secondary node), which is located on a significant development axis extending between the Gauteng region (mega node) and Cape Town (primary node). Phuthaditjhaba is located on a prominent development axis extending between the Gauteng region (mega node) and eThekwini (primary node). Babelegi and Garankuwa are located in the proximity of the Gauteng region (mega node), which emerged as a monocentric economic powerhouse. Bodirelo is located on a predominant development axis extending between the Gauteng region (mega node) and Mmabatho (intermediate node). Ekandustria is located on a predominant development axis extending between the Gauteng region (mega node) and Nelspruit (secondary node). Seshego stood out as having constricted potential, because, although located in the proximity of Polokwane, which emerged as a strong, viable secondary node, it does not conform to any potential development axis. The Industrial Parks Nkowankowa, Queenstown and Vulindlela stood out as having minimal potential, because they do not conform to any potential growth poles or development axes.
4.2 Industrial development zones
Industrial decentralisation is particularly challenging in the South African landscape, considering the deep-seated spatial distortions inherited from the apartheid period. In this regard, IPAP was introduced to differentiate economic and industrial development related to regions, in order to promote economic growth.
The key consideration identified by IPAP was to strengthen the instruments that would enable appropriate and viable economic and industrial decentralisation to take firm root in the previously underserved regions, connecting them into the wider national economy to discover potential new investment opportunities. In this regard, the national government introduced IDZs as a tool to assist in the economic development of regions (South Africa, 2010; 2016b). IDZs were created to support sustained economic growth of the manufacturing sector, based on the efficiencies stemming from proximity to markets; efficient supply and logistics chains; agglomeration and clusters, as well as supportive economic infrastructure. As illustrated in Figure 9, Ave IDZs were established:
• The Coega IDZ, situated in the Nelson Mandela Bay region (in Port Elizabeth), was designated in 2001 to become South Africa's first IDZ leveraging the public sector to attract foreign and domestic investments with an export orientation in the manufacturing sector.
• The East London IDZ, part of the Buffalo City Metropolitan area, was established in 2003 as part of the South African government's initiative to improve industrial competitiveness and economic growth in the country.
• The Richards Bay IDZ, situated in Kwazulu-Natal near the Durban (eThekwini) city region, is a purpose-built zone securing an industrial estate on the northeastern South African coast.
• The Saldanha Bay ID was launched in 2013 to serve as the primary oil, gas and marine repair engineering and logistics services complex in Africa, servicing the needs of the upstream oil exploration industry and production service companies, operating in the oil and gas fields off sub-Saharan Africa.
• The Atlantis IDZ, approved by Cabinet in 2018, was intended for the manufacturing of "green technology components and services" such as solar components; wind turbine blades; wind turbine towers; solar water heaters, and other components (South Africa, 2010; Commercial Property News, 2012: online; South Africa, 2016b; Creamer Media Reporter, 2018: online).
Measuring the IDZs against the outcomes of the regional corridor network model, considering Figures 5 and 8, only Richards Bay and Atlantis stood out as having notable potential development opportunities for the following reasons. Richards Bay not only emerged as a viable secondary node, but also has a prominent linkage with eThekwini as a viable primary node. Atlantis, located in the proximity of Cape Town, emerged as a strong, primary node. Coega, East London and Saldanha Bay stood out as having constricted development opportunities, because, although located in the proximity of viable secondary nodes, they do not conform to any potential development axes.
4.3 Southern and South African development corridors
Remoteness from major world markets is the principal reason why many African countries have been unsuccessful in mitigating strong economic development. Most of the African countries are developing countries with similar economic structures and limited resources. The trade opportunities between these countries and world markets are insignificant and, in most cases, the transport infrastructure is weak and offers no advantage to economic development. Therefore, under the auspices of the UN (2009) and the African Development Bank (ADB) (2010), African countries have embarked on promoting various action plans to address the special need to develop economic opportunities, in the hope of stimulating intra-regional and global trade. In that regard, various regional development corridors have been established to provide important connections between economic nodes or hubs that are usually centred in major urban areas to address this need (SADC, 2012: 21). In order to create free trade initiatives, nine southern African regional development corridors were established, namely the Northern corridor; the Central corridor; the Dar es Salaam corridor; the Walvis Bay corridor; the Maputo corridor; the Beira corridor; the North-South corridor; the Lobito-Benguela corridor, and the Nacala corridor. Of the selected southern African corridor initiatives, three (illustrated in Figure 10) are directly linked to South Africa, namely the 'Walvis Bay corridor' extending from Walvis Bay to Botswana, from Botswana to Johannesburg and linking up with the Maputo corridor; the 'Maputo corridor' linking the Gauteng region in South Africa with the Maputo region in Mozambique, and the 'North-South corridor' traversing eight countries and covering two existing corridors, i.e. the Durban and Dar es Salaam corridors, linking the port of Durban in southern Africa to the East African port of Dar es Salaam (SATTFP, 2005: online; Mitchell, 2008: 757-769; Infrastructurenews, 2016: online; SATTFP, 2018: online; ADBG, 2019: online; CTTCA, 2020: online; CCTTFA, 2020: online; Byiers et al., 2020: 21-33).
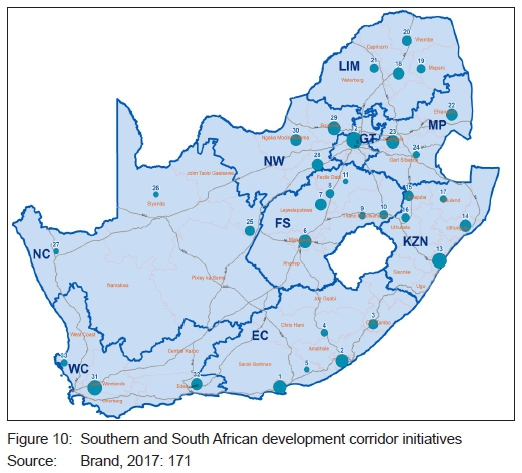
Measuring the southern African corridor initiatives against the outcomes of the regional corridor network model, considering Figure 8, only the 'Walvis Bay' and the 'Maputo corridor'4 initiatives are supported as having potential economic development opportunities to stimulate cross-border or intraregional trade. The reasons relate to the alignment of these corridors to the Gauteng region-Mmabatho (Johannesburg, Rustenburg, Mmabatho) and the Gauteng region-Nelspruit (Johannesburg, Witbank, Nelspruit) axes as the most predominant corridors. Furthermore, it is also evident that the 'North-South corridor' initiative is partially supported, as it only aligns with the Gauteng region-Mmabatho (Johannesburg, Rustenburg, Mmabatho) axis. Unfortunately, there is no potential axis extending from the Gauteng region to Polokwane, due to the lack of the emergence of a viable development corridor.
South Africa responded to the economic vision of regional integration with the establishment of a 20-year planning framework to create investment opportunities within major strategic infrastructure projects (South Africa, 2012). The projects are mainly focused on creating development corridors, which are incorporated in the NDP (2013) as spatial themes and in the NIP (2012) as key infrastructure projects. The NDP (2013) highlighted that, in the South African landscape, city regions and cities are considered economic nodes or hubs that represent the core cylinder of national agglomeration economies. When combined, they support the notion of an economic network extending between them, i.e. the focus is based on modern, urban agglomerations of economic activities that are comprised of an intricate web of cities where the functional and locational relationships provide holistic and competitive advantages. In support of this political and economic vision to pursue greater regional integration, South Africa (2012: 16, 18, 19) identified (as illustrated in Figure 10) three development corridors, namely Durban-Free State-Gauteng corridor, which has been earmarked by the government as an important infrastructural project to boost economic development. It forms part of the government's 2050 vision and is considered to be the backbone of South Africa's freight transportation network, vital in facilitating economic growth for the country and the southern African region; South-Eastern corridor, which has been earmarked to improve the industrial and agricultural development, and export capacity of the Eastern Cape region, expanding the region's economic and logistics linkages with the Northern Cape and KwaZulu-Natal regions, and the Saldanha-Northern Cape corridor, which has been earmarked with the aim of ensuring that the Saldanha-Northern Cape region becomes a value-adding centre to economic development, rather than simply being a transit corridor for iron ore.
Measuring the South African corridor initiatives against the outcomes of the regional corridor network model (considering Figure 8), only the Durban-Free State-Gauteng corridor stood out as having notable potential development opportunities, due to the emergence of a prominent development axis extending between the Gauteng region (mega node) and eThekwini (primary node). It appears that the Saldanha-Northern Cape and South-Eastern corridors have minimal potential, because both the corridors are not directly linked to the emergence of any potential development axes.
Although development corridors may not prove to be the only deciding factor, it is clear from the measurement outcomes, relating to the core logic of measuring spatial relationships between development centres, that participation in the development of corridors is a desirable option not to be dismissed. One can anticipate that the evolution of development corridors will result in strengthening regions and nodes linked to the benefits exerted by corridors, on the one hand, and strong intra-national and interregional economic integration, on the other. Therefore, development corridors do not, as such, contain the resolution of the challenges presented by different development agendas; development corridors are created to seek development opportunities.
Contextualising the outcomes of existing regional corridor networks (as illustrated in Figure 11, taking into account Figure 8) illustrates the following potential considerations5 for South Africa:
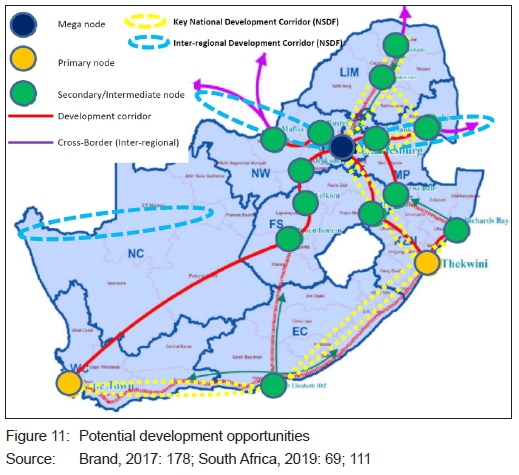
1. The following centres emerge as preferred locations for creating development opportunities to enhance economic growth:
• Gauteng region, Cape Town and eThekwini as dominant nodes and economic powerhouses.
• Witbank, Newcastle, Rustenburg, Mmabatho, Nelspruit, Klerksdorp, Welkom, Bloemfontein, Harrismith and Richards Bay as viable secondary/intermediate nodes. The Newcastle region can open up a linkage with the Richards Bay region to the south and vice versa.
• Port Elizabeth (Nelson Mandela Bay) as a viable secondary node to open up linkages with the Cape Town region to the south, the eThekwini region to the east, and the Bloemfontein region to the north. The investment could enhance the opportunity to create a coastal corridor extending between the Cape Town and eThekwini regions.
• Polokwane and Makhado as viable secondary/intermediate nodes to open up a linkage to the Gauteng region to the south, as well as to enhance regional integration to the north, supporting the North-South corridor initiative.
2. The following centres emerge as preferred locations for creating development opportunities to enhance and support cross-border integration:
• Polokwane and Makhado, as mentioned, enhancing regional integration to the north and supporting the North-South corridor initiative.
• Mmabatho, enhancing regional integration to the north and west, and supporting the Trans-Kalahari, North-South and Maputo corridors initiative.
• Nelspruit, enhancing regional integration to the east and supporting the Maputo corridor initiative.
Therefore, considering a regional corridor network model as a potential spatial framework, accentuates the following: the role of development corridors in economic space development, i.e. what essential attributes and properties are needed to create development opportunities; a measurement to establish prominent development corridors, whereby development opportunities, which ultimately enhance economic space development, are created, and the role of a well-developed network system to structure and guide economic spaces.
5. CONCLUSION
This article introduced regional corridor networks as a model to theoretically determine the potential of the most noteworthy development corridors in South Africa. It should be noted that the regional development corridor in context is a theoretical concept representing axes that express potential forces of development, i.e. it is an outcome of the potential linkages between development centres, which leads to the manifestation of economic development. The functional relationships between development centres play an important and decisive role in the creation and existence of development corridors. Therefore, development corridors potentially create opportunities that strengthen partnerships and increase the spatial attractiveness of regions as well as cities to business and industrial sectors, resulting in economic growth and development. Understanding the linkages between development centres not only improves the operational and economic efficiency of a region or country, but also creates a myriad of new economic opportunities; more specifically, it creates integrated networks of systems supporting the flow of goods; improved infrastructure; increased and more efficient interactions, and expanded business involvement.
The main difference between the approach to identify regional development corridors, in this article, and existing (draft) policy (NDP and NSDF) is that the latter policies envisage an 'ideal' situation with regard to the South African space economy, based mainly on political goals (South Africa, 2019:111).
Accordingly, the main 'regional corridors' established in the draft NSDF reflect on 'transformation corridors' (South Africa, 2019: 115) and are not based on 'economic potential' and 'gravitational analysis', as per the regional corridor network model. This is confirmed in Figure 8 that illustrates numerous regional corridors that have been identified in national policy, but lack any or sufficient economic development potential (i.e. Polokwane corridor, Port-Elizabeth-Durban Corridor).
The principle and theory underlying development corridors is that economic growth is created from transforming the functional relationships that already exist between urban or regional centres into economic development zones. This produces benefits that include the enhancement of trade opportunities; the opening up of neighbouring markets to one another; the granting of access to global markets, and the encouragement of public and private investment opportunities. The regional corridor network model was mainly measured against key national development programmes supported by the NDP (2013) as well as draft proposals initiated through the NSDF (2019) (i.e. the IDZs, the IPP, and Development Corridors) to determine whether these programmes promote intra-regional and global trade opportunities in South Africa.
Considering South Africa's spatial legacy, development corridors, although not the only deciding factor, prove to be an appropriate development instrument for a developing country such as South Africa, because it re-orientates attention to the potential of regional centres as development nodes. It enhances understanding the economic vitality of regional centres as well as the mutual interdependency that exists between the regional centres. This is an important consideration when selecting regions or cities as preferred locations to promote development opportunities.
Regional corridor networks, as a potential spatial targeting instrument, might not be the only solution in transforming the local challenges of inequality, unemployment and poverty, facing South Africa; but it does re-orientate attention to the potential of regional centres as development nodes.
The regional corridor network model was mainly measured against key national development programmes supported by the NDP (2013) as well as draft proposals initiated through the NSDF (2019) (i.e. the IDZs, the IPP, and Development Corridors) to determine whether these programmes promote intra-regional and global trade opportunities in South Africa.-Given the importance and timing of the draft NSDF (2019), measuring the regional corridor network model against the implementation thereof shows that there are critical differences in the approach to the development of the national space economy, where "idealistic" (South Africa, 2019: 111) goals are not necessarily supported by scientific data to support the proposed developments.
Based on the outcome of the regional corridor network model measurements, only Richards Bay and Atlantis stood out as having notable potential development opportunities as IDZs; Isithebe, Botshabelo, Phuthaditjhaba, Babelegi, Garankuwa, Bodirelo and Ekandustria stood out as having notable potential development opportunities as IPPs, and only the 'Durban-Free State-Gauteng corridor' stood out as having notable potential development opportunities.
Taking the 'economic potential' and 'gravitational analysis' as measurement outcomes of the regional corridor network model into consideration, centres emerging as preferred locations for creating development opportunities to enhance economic growth include the Gauteng region, Cape Town and eThekwini as dominant nodes and economic powerhouses. Polokwane, Makhado, Mmabatho and Nelspruit emerged as centres and preferred locations for creating development opportunities to enhance and support cross-border integration.
REFERENCES
ADB (AFRICAN DEVELOPMENT BANK). 2010. Southern African Regional Integration Strategy Paper 2011 to 2015. Strategy report. Belvedere, Tunisia: The Knowledge & Information Center. [ Links ]
AFRICAN DEVELOPMENT BANK GROUP. 2019. Multinational - Lobito Corridor Trade Facilitation Project. [Online]. Available at: <https://www.afdb.org/en/documents/document/multinational-lobito-corridor-trade-facilitation-project-99385#:~:text=The%20Lobito%20Corridor%20represents%20an,two%20countries%20to%20the%20sea.&text=In%20DRC%2C%20the%20Corridor%20connects,%2C%20Lualaba%20and%20Haut%2DKatanga>. [Accessed: 1 September 2020]. [ Links ]
ANDERSEN, S.J. & BURNETT, S.L. 1998. Activity corridors, spines, streets and nodes and access management. Johannesburg: Gautrans. [ Links ]
ARNOLD, J. 2005. Best practices in corridor management. Report prepared for the World Bank. Washington, D.C.: International Bank for Reconstruction and Development (IBRD). [ Links ]
ARVIS, J.F. 2011. Connecting landlocked developing countries to markets - Trade corridors in the 21st century. Washington, D.C: World Bank. https://doi.org/10.1596/978-0-8213-8416-9 [ Links ]
AYDAN SAT, N. 2018. Polycentricity in a developing world: A micro-regional analysis for morphological polycentricity in Turkey. GeoScape 12(2), pp. 64-75. DOI: 10.2478/geosc-2018-0007 [ Links ]
BAKKER, J.D., PARSONS, C. & RAUCH, F. 2016. Migration and urbanisation in post-apartheid South Africa. IZA Discussion Paper No. 10113, Bonn, Germany. [ Links ]
BATTEN, D.F. 1994. Network cities: Creative urban agglomerations for the 21st century. Urban Studies, 32(2), pp. 313-327. https://doi.org/10.1080/00420989550013103 [ Links ]
BRAND, A. 2017. The use of corridor development as a strategic and supporting instrument towards the development of national space economies. Unpublished PhD Thesis. Potchefstroom: North West University. [ Links ]
BRAND, A. & DREWES, J.E. 2019. Identification of network cities in South Africa. GeoJournal [electronic version]. https://doi10.1007/s10708-019-10097-z [ Links ]
BRUNNER, H.P. 2013. What is economic corridor development and what can it achieve in Asia's subregions? Asian Development Bank (ADB) Working Paper on Regional Economic Integration No.117. Metro Manila, Philippines. https://doi.org/10.2139/ssrn.2306801 [ Links ]
BUITER, W. & RAHBARI, E. 2011. Trade transformed - The emerging new corridors of trade power. Citi GPS: Global Perspectives & Solutions, 18 October. [ Links ]
BYIERS, B., KARKARE, P. & MIYANDAZI, L. 2020. A political economy analysis of the Nacala and Beira corridors. Discussion Paper, No. 277. July, pp. 21-33. [ Links ]
COMMERCIAL PROPERTY NEWS. 2012. Industrial development zones have failed - DA. [Online]. Available at: <https://eprop.co.za/commercial-property-news/item/13690-industrial-development-zones-have-failed-da.html> [Accessed: 1 September 2020]. [ Links ]
CREAMER MEDIA REPORTER. 2018. Engineering News, 8th June edition. [Online]. Available at: <https://www.engineeringnews.co.za/article/cabinet-approves-designation-of-atlantis-sez-2018-06-08> [Accessed: 11 February 2020]. [ Links ]
CTTCA (CORRIDOR TRANSIT AND TRANSPORT COORDINATION AUTHORITY). 2020. Transforming the northern corridor into economic development corridor. [Online]. Available at: <http://www.ttcanc.org/page.php?id=11> [Accessed: 1 September 2020]. [ Links ]
DREWES, J.E. 2015. More explicit regional policy for South Africa, please Mr President. Journal of Town and Regional Planning, 67, pp. 58-67. [ Links ]
FRIEDMANN, J. 1972. A general theory of polarized development. London: Collier-McMillan. [ Links ]
GEYER, H.S. 1988. The terminology, definition and classification of development axes. Potchefstroom: North-West University. [ Links ]
GEYER, H.S. Jr., GEYER, P. & GEYER, H.S. 2015. The South African functional metropolis - A synthesis. Journal of Town and Regional Planning, 67, pp. 13-26. [ Links ]
GIRAUT, F. & VACCHIANI-MARCUZZO, C. 2012. Mapping places and people in a settler society: From discrepancy to good fit over one century of South African censuses. Geneva: University of Genève. [ Links ]
HENNING, C. & SAGGAU, V. 2012. Networks, spatial diffusion of technological knowledge, and regional economic growth: An agent-based modelling approach. International Journal of Innovation and Regional Development, 4(3-4), pp. 204-231. https://doi.org/10.1504/IJIRD.2012.047558 [ Links ]
HOPE, A. & COX, J. 2015. Development corridors. EPS-PEAKS topic guide. Coffey International Development. [ Links ]
INDUSTRIAL PROPERTY NEWS SOUTH AFRICA, 2020. Dti to spend R415 m on industrial parks. [Online]. Available at: <https://www.bizcommunity.com/Article/196/711/175200.html> [Accessed: 10 July 2020]. [ Links ]
INFRASTRUCTURENEWS. 2016. North-South corridor Africa's main vein. [Online]. Available at: <https://infrastructurenews.co.za/2016/01/15/north-south-corridor-africas-main-vein/> [Accessed: 1 September 2020]. [ Links ]
JANELLE, D.G. 1968. Spatial reorganization: A model and concept. Colorado: USAF Academy. [ Links ]
KWAMENA-POH, M. 1986. Africa history in maps. Hong Kong: Longman Group. [ Links ]
MEIJERS, E., WATERHOUT, B. & ZONNEVELD, W. 2005. Polycentric development policies in European countries: An introduction. Built Environment, 31(2), pp. 96-102. https://doi.org/10.2148/benv.31.2.97.66255 [ Links ]
MITCHELL, J. 2008. The Maputo Development Corridor: A case study of the SDI process in Mpumalanga. Development Southern Africa, 15(5), pp. 757-769. https://doi.org/10.1080/03768359808440048 [ Links ]
MULENGA, G. 2013. Developing economic corridors in Africa. Rationale for the participation of the African Development Bank. NEPAD, Regional Integration and Trade Department. Regional Integration Brief, No. 1. April, pp. 1-12. [ Links ]
SACN (SOUTH AFRICAN CITIES NETWORK). 2016. State of South African Cities Report 2016. Johannesburg: SACN. [ Links ]
SADC (SOUTHERN AFRICAN DEVELOPMENT COMMUNITY). 2012. Regional Infrastructure Development Master Plan Executive Summary. [Online]. Available at: <https://www.sadc.int/files/7513/5293/3530/Regional_Infrastructure_Development_Master_Plan_Executive_Summary.pdf> [Accessed: 27 August 2019]. [ Links ]
SATTFP (SOUTHERN AFRICAN TRADE AND TRANSPORT FACILITATION PROJECT). 2005. Walvis Bay corridor development. A public private partnership approach: A case study. [Online]. Available at: <https://www.ssatp.org/sites/ssatp/files/publications/HTML/Conferences/Bamako05/Final-Report/Annex10-Presentations/01-Walvis.pdf> [Accessed: 1 September 2020]. [ Links ]
SATTFP (SOUTHERN AFRICAN TRADE AND TRANSPORT FACILITATION PROJECT). 2018. Dar es Salaam corridor. Strategic objectives and project plan. [Online]. Available at: <https://www.ssatp.org/sites/ssatp/files/2018_Annual_Meeting_Abuja/Day1/RI/Dar%20CorridorCPMSPresentation_SSATP_REC-TCC_Abuja_July2018%20-%20By%20Peter%20Masi.pdf>. [Accessed: 1 September 2020]. [ Links ]
SCHOEMAN, C.B. 2015. The alignment between spatial planning, transportation planning and environmental management within the new spatial system in South Africa. Journal of Town and Regional Planning, 67, pp. 42-57. [ Links ]
SNIESKA, V., ZYKIENE, I. & BURKSAITIENE, D. 2019. Evaluation of location's attractiveness for business growth in smart development. Economic Research, 32(1), pp. 925-946. DOI: 10.1080/1331677X.2019.1590217 [ Links ]
SOUTH AFRICA. 2010. Department of Trade and Industry. Industrial Policy Action Plan (IPAP) 2012/13-2014/15. Pretoria: Government Printer. [ Links ]
SOUTH AFRICA. 2011. National Transport Master Plan. Pretoria: Government Printer. [ Links ]
SOUTH AFRICA. 2012. National Infrastructure Plan. Pretoria: Government Printer. [ Links ]
SOUTH AFRICA. The Presidency. 2013a. The National Development Plan 2030. Our future - make it work. Pretoria: Government Printer. [ Links ]
SOUTH AFRICA. 2013b. The Spatial Planning and Land Use Management Act. Act 16 of 2013. Pretoria: Government Printer. [ Links ]
SOUTH AFRICA. 2016a. Department of Transport. Statistical data. Pretoria: Government Printer. [ Links ]
SOUTH AFRICA. 2016b. The Department of Trade and Industry. Industrial Policy Action Plan - IPAD 2016/17-2018/19. Pretoria: Government Printer. [ Links ]
SOUTH AFRICA. 2016c. Statistics South Africa. The Pulse of the Organization. Internal circular 13/05/2016. Pretoria: Government Printer. [ Links ]
SOUTH AFRICA. 2019. Draft National Spatial Development Framework. Pretoria: Government Printer. [ Links ]
SRIVASTAVA, P. 2012. Regional corridors development: A framework. ADB Economics Working Paper No. 258. Manila: ADB. [ Links ]
stepSA (SPATIAL AND TEMPORAL EVIDENCE FOR PLANNING IN SOUTH AFRICA). 2018. The CSIR Functional Town, City and Settlement Typology. [Online]. Available at: <http://stepsa.org/settlement_typology.html> [Accessed: 3 July 2020]. [ Links ]
STRZELCZYK, W. 2015. Investment attractiveness measurement of the regions and versus general location of the enterprises. Economic and Regional Studies, 7(2), pp. 5-25. [ Links ]
TERREBLANCHE, S.J. 2014. Verdeelde land. Kaapstad: Tafelberg Uitgewers. [ Links ]
TODARO, M. 1969. A model of labour migration and urban employment in less developed countries. American Economic Review, 59(1), pp. 138-148. [ Links ]
TTFA (TRANSIT TRANSPORT FACILITATION AGENCY). 2020. Central Corridor Trade Route. [Online]. Available at: <http://centralcorridor-ttfa.org/about-us/central-corridor-trade-route/> [Accessed: 1 September 2020]. [ Links ]
TUDORA, D. & EVA, M. 2014. A geographical methodology for assessing nodality of a road network. Case study on the western Moldavia. Acta Geographica Slovenica, 54(1), pp. 101-113. https://doi.org/10.3986/AGS54107 [ Links ]
TUPPEN, J.N. 1977. Axial regions: An appraisal of their formation, evolution and definition. Discussion Paper in Geography, No. 4. Salford: University of Salford. [ Links ]
UN (UNITED NATIONS). 2009. Report of the Commission of Experts of the President of the United Nations General Assembly on reforms of the international monetary and financial systems. New York: UN. [ Links ]
VAN DER LINDEN, M. 2014. The influence of demographic decline on the 'Daily Urban System': A case study into shrinking areas in a growing city region. Unpublished M-thesis. The Netherlands: Radboud University, Nijmegen. [ Links ]
VAN HUYSSTEEN, E., BIERMANN, S., NAUDE, A. & LE ROUX, A. 2009. Advances in spatial analysis to support a more nuanced reading of the South African space economy. Urban Forum, 20, pp. 195-214. Doi 10.1007/s12132-009-9061-1 [ Links ]
VAN HUYSSTEEN, E., GREEN, C., SOGONI, Z., MARITZ, J. & MCKELLY, D. 2018. South African Functional Town Typology (CSIR 2018 v2). [Online]. Available at: http://stepsa.org/socio_econ.html#Indicator [Accessed: 24 June 2020]. [ Links ]
VAN HUYSSTEEN, E., MEIKLEJOHN, C., COETZEE, M., GOSS, H. & ORANJE, M. 2010. An overview of South Africa's metropolitan areas -Dualistic, dynamic and under threat... European Spatial Research and Policy, 17(2), pp. 23-38. Doi:10.2478/s10105-010-0008-2 [ Links ]
VAN HUYSSTEEN, E., MANS, G., LE ROUX, A., MARITZ, J., NGIDI, M. & MADITSE, K. 2016. Profiling SA system of towns - Introducing the CSIR/SACN South African Settlement typology. StepSA: February 2016. Pretoria: CSIR. [ Links ]
WANG, J. & WANG, X. 2012. Structural equation modelling. Applications using Mplus. West Sussex, UK: John Wiley & Sons Ltd. https://doi.org/10.1002/9781118356258 [ Links ]
WRIGHT, S. 1934. The method of path coefficients. The Annals of Mathematical Statistics, 5(3), pp. 161-215. https://doi.org/10.1214/aoms/1177732676 [ Links ]
Peer reviewed and revised May 2020
Published December 2020
* The authors declared no conflict of interest for this title or article
1 For the algorithm used to calculate the EIF, see Brand & Drewes (2019: 11-21).
2 For the algorithm used to calculate the LDV, see Brand (2017: 155-158).
3 For the algorithm used to calculate the CCIF, see Brand (2017: 155-158).
4 Corridors defined by the NSDF 2019 are shown in Figure 11 holistically. Reference is made in the conclusion with the way forward. It was decided not to discuss the corridors, considering that the NSDF is still a draft format. It was highlighted that the measurements of these corridors can be a future consideration, as mentioned in the conclusion.
5 It should be noted that the outcomes reflected in the paragraph are key to the core logic of the article, as mentioned in the introduction - see last paragraph under introduction. This paragraph should also be viewed in the context of Figure 5 and Table 2. Although the model was only measured against key development programmes, the outcomes from the model in itself articulate the potential of development centres as summarised.

