


Serviços Personalizados
Artigo
 Inglês (pdf)
 Artigo em XML
 Referências do artigo
Indicadores

Links relacionados
-
 Citado por Google
 -
 Similares em Google
Compartilhar

 Permalink
Town and Regional Planning
versão On-line ISSN 2415-0495
versão impressa ISSN 1012-280X
Town reg. plan. (Online) vol.77 Bloemfontein 2020
http://dx.doi.org/10.18820/2415-0495/trp77i1.6
ARTICLES
Land use land cover change and land surface emissivity in Ibadan, Nigeria
Verandering van grondbedekkings en emissiwiteit van grondoppervlakte in Ibadan, Nigerië
Phetoho ea tsebeliso le koahelo ea mobu 'moho le bokaholimo ba lefats'e toropong ea Ibadan, Nigeria
Oluwasinaayomi KasimI; Samuel AgbolaII; Michael OweniweIII
ILecturer, Department of Urban and Regional Planning, University of Ibadan, Nigeria. Phone: +234 8055607009, email: <kasimfaith@gmail.com>, ORCID: https://orcid.org/0000-0002-5985-1534
IIChair: Human Settlement Unit, Mangosuthu University of Technology, Durban, South Africa. Phone: +27 0632291570, email: <Babatunde.agbola@gmail.com>, ORCID: https://orcid.org/0000-0001-8128-5746
IIIGraduate student, Department of Urban and Regional Planning, University of Ibadan, Nigeria. Phone: +234 80649599515, email: <michaelfemioweniwe@gmail.com>
ABSTRACT
There are many drivers of climate change. The urbanization process has been adjudged to be one of the major factors influencing spatial variation in land use and land cover change (LULC), land surface temperature (LST), land surface emissivity (LSE), increasing greenhouse gases emission, and climate change. This article uses a multispectral satellite remote sensing and survey-based approach to examine the nexus of LULC and LSE in the Ibadan city region, Nigeria. The spectral reflectance, the sun angle spectral radiance of the Landsat imageries (2000, 2010, 2018) was corrected and converted from digital number. The LULC, Normalized Difference Vegetation Index (NDVI), Normalized Difference Built-Up Index (NDBI), LSE and LST were obtained from the analysis of Landsat imageries. From the findings, temperature increase was identified as a peculiar environmental issue. Analysis of the Landsat imageries revealed that the NDVI value increased from 0.44 in 2000 to 0.47 in 2018. The NDBI values showed that built-up areas in the core of the urban areas have the highest NDBI values (0.023-0.602). The spatio-temporal trends of LST were related to the changes in LULC, and the built-up area had the highest LSE. The maximum LST (43°C) was observed in the year 2018 at the core area of the city where building density was highest. The study suggests an application of cool pavements, green development, and urban forest regeneration for sustainable development.
Keywords: Land use, surface emissivity, urban expansion, urban resilience, Ibadan
OPSOMMING
Daar is baie drywers van klimaatsverandering. Die verstedelikingsproses word beskou as een van die belangrikste faktore wat die ruimtelike variasie in grondgebruik en landbedekkingsverandering (LULC), landoppervlaktemperatuur (LST), landoppervlakte-emissie (LSE), toenemende emissie van kweekhuisgasse en klimaatsverandering beïnvloed. Hierdie artikel maak gebruik van 'n multispektrale satellietafstandwaarneming en opmetingsgebaseerde benadering om die verband tussen LULC en LSE in die Ibadan-streek, Nigeria, te ondersoek. Die spektrale weerkaatsing, die sonhoekspektrale uitstraling van die Landsat-beelde (2000, 2010, 2018) is reggestel en omgeskakel van digitale nommer. Die LULC, Normalised Difference Vegetation Index (NDVI), Normalised Difference Built-Up Index (NDBI), LSE en LST is verkry uit die analise van Landsat-beelde. Uit die bevindings is die toename van die temperatuur geidentifiseer as 'n eienaardige omgewingskwessie. Analise van die Landsat-beelde het aan die lig gebring dat die NDVI-waarde van 0.44 in 2000 tot 0.47 in 2018 toegeneem het. Die NDBI-waardes het getoon dat beboude gebiede in die kern van die stedelike gebiede die hoogste NDBI-waardes het (0.023-0.602). Die ruimtelike-tydelike neigings van LST hou verband met die veranderinge in LULC, en die beboude gebied het die hoogste LSE gehad. Die maksimum LST (43°C) is in 2018 waargeneem in die kerngebied van die stad waar die geboue se digtheid die hoogste was. Die studie dui op die toepassing van koel sypaadjies, groen ontwikkeling en stedelike bosvernuwing vir volhoubare ontwikkeling.
Sleutelwoorde: Grondgebruik, emissi-witeit op die oppervlak, stedelike uitbreiding, stedelike veerkragtigheid, Ibadan
SA BONAHALENG
Ho na le lisosa tse ngata ba phetoho ea maemo a leholimo. Phallo e phahameng ea batho ho ea litoropong e nkuoe e le e 'ngoe ea lisosa tse kaholimolimo tse susumetsang phapano ea phetoho ts'ebelisong le koahelong ea mobu (LULC), mocheso ea lefatse (LST), mesi e kotsi ho lefats'e (LSE), 'me qetellong e eketsa ho tsoa ha likhase le phetoho ea maemo a leholimo. Sengoliloeng sena se sebelisa mokhoa oa kutlo e hole le oa liphuputso tsa boithuto ho lekola khokahanyo pakeng tsa LULC le LSE tikolohong ea toropo ea Ibadan, Nigeria. Ponahalo, khanya ea letsatsi ea litsoantso tsa Landsat (2000, 2010, 2018) e ile ea lokisoa mme ea fetoloa ho tloha ho nomoro ea 'digital'. LULC, Normalized Difference Vegetation Index (NDVI), Normalised Difference Built-Up Index (NDBI), LSE le LST li fumanoe ho tsoa tlhahlobisong ea litsoantso tsa Landsat. Ho latela liphuputso, keketseho ea mocheso e ile ea khetholloa e le bothata bo ikhethang ba tikoloho. Tlhatlhobo ea litsoantso tsa Landsat e senotse hore boleng ba NDVI bo eketsehile ho tloha ho 0,44 ka 2000 ho isa ho 0,47 ka 2018. Litekanyetso tsa NDBI li bonts'itse hore libaka tse hahiloeng bohareng ba libaka tsa litoropo li na le litekanyetso tse phahameng ka ho fetisisa tsa NDBI (0.023-0.602). Mekhoa ea sebaka sa nakoana ea LST e ne e amana le liphetoho tse iponahalitseng ho LULC, mme libaka tse hahiloeng li na le LSE e phahameng ka ho fetisisa. LST (43° C) e phahameng ka hofetisisa e bonoe ka selemo sa 2018 sebakeng sa mantlha sa toropo moo bongata ba meaho bo neng bo le holimo ka ho fetesisa. Phuputso e khothaletsa ts'ebeliso ea litsela tsa maoto tse pholisitsoeng, nts'etsopele ea botala le temo-bocha ea meru ea litoropo bakeng sa nts'etsopele e tsitsitseng.
1. INTRODUCTION
One of the resultant effects of urban expansion and land use/land cover change (LULC), the dominant factors in regional landscape modification, is global warming (Agbola, Kasim & Coker, 2014: 46; Abegunde & Oluwatola, 2015: 230-231). City growth influences the micro-climate (Quattrochi, Jedlovec & Meyer, 2012: online). Rapid urbanization and expansion of human settlements play important roles in global LULC by modifying the ecological processes that influence the manifestation of climate change at local, regional and global scales (Oladele & Oladimeji, 2011: 635; Kasim, Abshare & Agbola, 2018: 807-808). The warming of the climate system is now unequivocal and, according to the Intergovernmental Panel on Climate Change (IPCC) (2007), the increase in global temperature observed from the mid-20th century is attributable to anthropogenic activities, which include increased rate of fossil fuel burning and LULCs. Estimates for the 21st century indicate an average increase in global temperature ranging from 1.8°C to 4°C. The projection has implications on city liveability, especially in countries with low capacity to cope with perturbations, thereby compromising the already stressed resilience components (Kasim, Wahab & Olayide, 2020).
Cities can only be sustainable if the life support ecosystems on which they depend are resilient (Kasim, 2018: 958). However, observations and analysis of global meteorological data by the IPCC (2007) show that the earth's surface has warmed significantly in the last century. Although several drivers of climate change have been identified, human activities have significantly contributed to elevated greenhouse gases (GHG) emission. The GHG trap heat in the atmosphere and alter the energy dynamics and balance of the climate system (IPCC, 2007; Ramanathan & Carmichael, 2008: 223; Ramanathan & Feng, 2009: 48-49; Kasim et al., 2018: 806). A range of human activities, including deforestation to accommodate urban expansion, have led to an alteration of the energy balance. These alterations are more profound in cities and have found expression in spatial variation in the land surface temperature (LST), land surface emissivity (LSE) and climate change (Morabito, Crisci, Messeri, Orlandini, Raschi, Maracchi & Munafo, 2016: 321-322). The phenomenon termed LSE is conceptualized as the average emission of heat from an element influenced by multiple factors such as impervious surfaces, LULC, surface roughness, and the physical planning characteristics of a settlement (Aakriti & Ram, 2014: 120-121; Wahab & Agbola, 2017: 213; Wahab & Popoola, 2019: 172).
Ibadan city, one of the fastest growing urban centres in Nigeria, in terms of population and urban expansion, has evolved without a discernible growth or physical development pattern. It has been documented that the city expanded from roughly 100 ha in 1830 to 12km2 in 1931, 112km2 in 1973, 214km2 in 1988, 243km2 in 2000 and the present urban sprawl is close to 300km2 (Fabiyi, 2006: 63; Agbola, 2013: 16; Agbola et al., 2014: 43-45). The observed development without proactive physical planning intervention creates an avenue for illegal development, LULC and LST. For example, the Nigerian Meteorological Agency (NIMET) (2018) predicts an increase in temperature, especially in Nigerian cities. As noted by Jin and Liang (2006: 2867-2868), temperature is an aftermath of LSE, which is the ratio of energy emitted from the sun in relation to the earth's surface at the same temperature. Emissivity is the ability of a material to emit, absorb or radiate heat from the sun (Elert, 2018: online). Studies on LULC and LST in developing countries (Adelekan, 2012; Aakriti & Ram, 2014: 126; Swades & Ziaul, 2017: 134; Zaharaddeen, Baba & Ayuba, 2016: 36; Nzoiwu, Agulue, Mbah & Igboanugo, 2017: 772-773) have not paid much attention to the nexus of LSE and increasing urban temperature. In addition, owing to the difficulty in obtaining and scarcity of spatial data (Olomo, 2003: 39-40; Enaruvbe & Pontius Jr, 2015: 252; Enaruvbe, 2018: 40), implications of LULC, LST and the effect of urban heat island on living conditions and city resilience have not been documented. Therefore, this article examines the spatio-temporal trend and nexus of LULC, LSE and LST in Ibadan, Nigeria, adopting climatological and Landsat data. The article also examines the perception of the residents on LULC and LST.
2. STUDY AREA
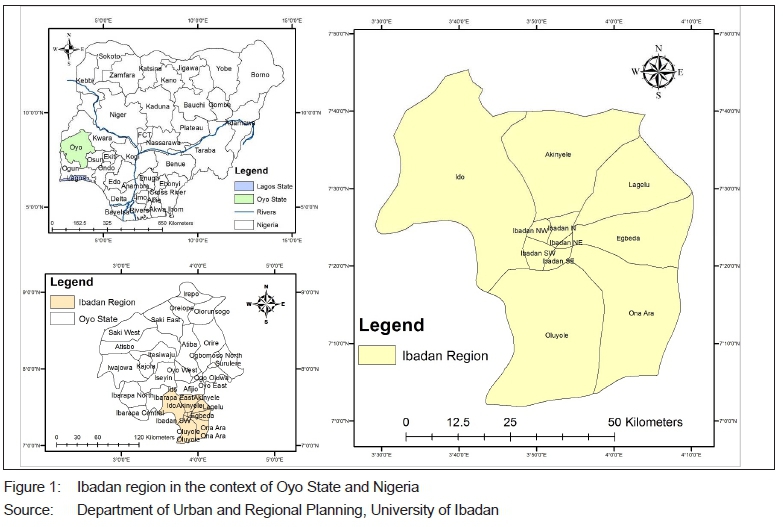
Ibadan city, in south-west Nigeria, is located approximately on longitude 3o5' to 4o36' east of the Greenwich Meridian, and latitude 7o23' to 7o55' north of the Equator. It covers an area of approximately 3,200km2 (Figure 1). Ibadan is located at roughly 145km north of Lagos. In the early 1980s, the city had an aerial extent of approximately 30,080km2, with the metropolis covering roughyl 250km2 of the landmass (Oladele & Oladimeji, 2011: 639).
The Ibadan region is made up of five metropolitan (Ibadan North, Ibadan South, Ibadan Northwest, Ibadan Southwest and Ibadan Northeast) and six rural/peri-urban LGAs (Akinyele, Oluyole, Egbeda, Ido, Lagelu & Ona-Ara). In 1950, the population of the city was 450,111 and the total population of the city from the 2006 census was 2,550,593 with an average population density of 828 persons per km2 (National Population Commission, 2006). This census result was challenged by the Oyo State Government, owing to a perceived undercount. According to the United Nations Department of Economic and Social Affairs Population Dynamics (2018: online), the city's 2020 population is estimated at 3,551,961. In the absence of proactive physical planning strategy, this population outlook has implications for LULC and the capacity of decision makers to respond to climate change impacts and urban resilience to perturbations.
Ibadan's climate is characterized by a tropical wet and dry climate, with an extended wet season and relatively constant temperature all year round. The wet season is from March to October, with August experiencing a break in rainfall, thereby dividing the wet season into two different wet seasons. The dry season is from November to February when the city is influenced by the typical West African harmattan (Audu, Isikwue & Eweh, 2015: 72). According to Audu and Isikwue (2015: 62), the albedo variations in Ibadan may be due to the location of Ibadan in the tropical rain forest, where the mean albedo value obtained is 0.528, with maximum and minimum albedo values of 0.645 and 0.364, respectively. They also observed that the albedo of Ibadan city is usually very high in the rainy season, with its highest value in August (0.641), and low in the dry season, with its lowest value at the onset of the dry season and relatively low at the transition from dry to rainy seasons.
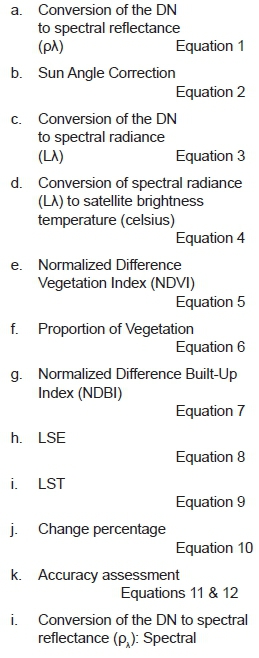
3. RESEARCH METHODOLOGY
This study adopts a mixed methods research strategy where qualitative and quantitative data are collected in parallel, analysed separately, and then merged (Creswell, 2014). It also allows for descriptive statistical analysis (Naoum, 2013: 104). In this study, satellite imageries were used to classify the land cover change and emissivity in the years 2000, 2009 and 2018 in Ibadan by determining LULC, NDVI, NDBI, LSE, LST and the driver of LULC and LSE, using meteorological data and Landsat data. This approach was adopted in the integrated design approach in evaluating spatial patterns of land surface temperature and urban heat island for sustainable cities across the globe (Skivington, 2012; Aakriti & Ram, 2014; Zaharaddeen et al., 2016; Folorunsho, Balogun, Adediji, Olumide & Abdulkareem, 2017). In addition, an integrated design approach allows for complementary roles, for example, while remotely sensed images can show land cover change, they do not clearly show how land use choice and decision-making influence LULC outcomes (Messah & Kigige, 2011). The questionnaire assessed people's perception (in all the local government areas in the city) of the changes in LULC and LST.
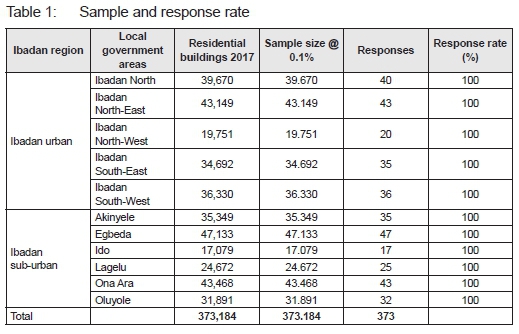
3.1 Sampling and response rate
From a preliminary survey, a total of 373,184 residential buildings were identified in the study area (Table 1). Random sampling was used to select 373 of the residential buildings in Ibadan. From the distribution, 373 household heads were selected per residential building, using the simple random sampling technique (Alvi, 2016: 35). Primary data were collected using questionnaires to determine respondent profiles, the effects (thermal comfort) and perception of people on LULC and LST. In addition, an observatory checklist was used to ascertain the types of landscape materials in the respondents' compound and the type of building materials used. The structured questionnaire was administered on 373 households, a 0.1% of the existing residential buildings (373,184) distributed across the 11 local government areas in Ibadan. The sample size for research done in construction-related populations was calculated in accordance with the table recommended by Krejcie and Morgan (1970: 608). All the questionnaires administered were returned and used for the analysis (Table 1).
3.2 Data collection
3.2.1 Satellite imagery
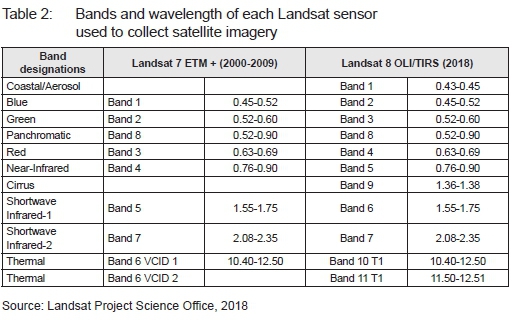
Remote sensing technology plays a vital role in spatial analysis by providing accurate and reliable information that is cost effective within a shorter time frame. The technology also provides the opportunity to update land use and land cover information efficiently and cheaply, in order to keep an inventory and monitor changes (Hamzah, 2015). The multispectral imagery used in this study was sourced from the American Landsat satellite (EC, 2000). In this study, Landsat satellite imageries for 2000, 2009 and 2018 were used to obtain land cover categories for image classification, LSE and surface temperature of Ibadan city. Satellite imagery was used to classify the land cover of Ibadan city and extract information for LSE and LST (Table 2). The pre-processing procedures to correct for geometric and radiometric errors as well as calibration of the images to per cent reflectance were undertaken on the images. The selected images were geo-referenced in the Universal Transverse Mercator (UTM) coordinate system and rectified to correspond to the World Geodetic System (WGS) 1984 UTM Zone 32N.
Google EarthTM combines Google Search with satellite imagery, maps, terrain and 3D buildings to make the world locational and geographic information available (Brovelli, Minghini & Valentini, 2011). Google EarthTM has the capacity to display satellite images of varying resolution of at least 15 meters of resolution of the Earth's surface, allowing users to visualize cities and structure (houses) therein perpendicularly or at an oblique angle, with perspective. Owing to this capacity, it was used to clearly view land cover categories in order to validate the LULC analysis outcomes across the local government areas of the city.
3.2.2 Land surface temperature and emissivity
The derivation of LST is a multistep method that entails conversion of the Digital Number (DN) to Spectral Radiance, conversion of spectral radiance to satellite brightness temperature, LST extraction and conversion of LST from Kelvin to degree celsius. These methods are quite different for each sensor, that is Landsat 7 and 8 (Landsat Project Science Office 2002). The Landsat 7 TM thermal band 6 VCID 1 (10.40-12.50um), Band 6 VCID 2 and Landsat 8 OLI thermal band 10 (10.60-11.19um) and Band 11 (11.50-12.51um) are suitable for capturing the multifaceted intraurban temperature differences and analysis (Landsat Project Science Office 2002). Landsat 7 TM sensor images in the thermal band were taken twice: one in the low-gain mode (Band 6 VCID 1) and the other in the high-gain mode (Band 6 VCID 2). In addition, Landsat 8 OLI thermal bands were taken twice: one in the low-gain mode (Band 10) and the other in the high-gain mode (Band 11). However, the uniformly resampled Landsat thermal bands used to carry out the thermal analysis for the three different periods (2000, 2009, and 2018) were based on the following steps:
reflectance is the brightness of a surface in different regions of the electromagnetic spectrum; the spectral reflectance of an object depends on the particular material and its physical and chemical state; the surface roughness, and the geometric circumstance (Glass 2013). It is expressed as:

Where:
pA = Spectral Reflectance
MQ = Band Specific Reflectance Multiplicative Rescaling Factor from the Metadata File
AQ = Band Specific Reflectance Additive Rescaling Factor from the Metadata File
QCal= Quantified and Calibrated Standard Product Pixel Values (DN)
ii. The sun angle correction is a form of radiometric correction. When a sensor from a satellite observes an emitted energy, the observed energy does not coincide with the energy emitted or reflected from the same object observed from a short distance, owing to the sun's azimuth and elevations, and the atmospheric conditions such as fogs or aerosols. In order to obtain the real radiance or reflectance, the radiometric correction for sun angle has to be done. This is expressed as:
Where:
pλ = Spectral reflectance
Sun Elevation = as contained in the metadata file for 2000, 2009 and 2018 Landsat imageries.
iii. Conversion of the DN to spectral radiance (LA). Every object emits thermal electromagnetic energy, because the temperature of any object is above absolute zero (K). Following this principle, the signals received by the thermal sensors from Landsat satellite imagery were converted to sensor radiance (Landsat Project Science Office 2002). The conversion was done, using equation 3:
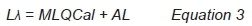
Where:
Lλ = Spectral Radiance
ML = Band Specific Radiance Multiplicative Rescaling Factor from the Metadata File
AL = Band Specific Radiance Additive Rescaling Factor from the Metadata File
QCal = Quantified and Calibrated Standard Product Pixel Values (DN)
iv. Conversion of spectral radiance (LA) to satellite brightness temperatures (in celsius). Corrections for emissivity were applied to the radiant temperatures, according to the nature of land cover. In general, vegetated areas are given a value of 0.95 and non-vegetated areas 0.92 (Tarawally, Xu, Hou & Mushore, 2018). It is expressed as:
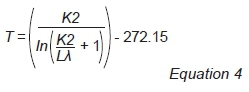
Where:
T = At Satellite Temperature (oC)
Lλ = Spectral Radiance
K1 = Band Specific Thermal Conversion Constant from the Metadata File
K2 = Band Specific Thermal Conversion Constant from the Metadata File
272.15 = Constant for conversion from Kelvin to Celsius
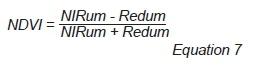
v. Normalized Difference Vegetation Index (NDVI) is an important indicator of vegetation condition, stress and greenness or biomass. The values of NDVI range between -1 to +1, where higher values indicate healthy vegetation cover and negative values represent land surface devoid of vegetation cover such as built-up areas and water bodies (Lo & Quattrochi, 2003: 77-79; Yuan & Bauer, 2007: 381383). However, to get the best results from the combination of the NIR and RED bands, certain corrections are needed (Bruce & Hilbert, 2006). The bands were first converted to spectral radiance and the sun angle corrected. The NDVI in a Landsat satellite image is generated from the red (3rd) and near-infrared (4th) bands and it appropriately represents the coverage and condition of vegetation (Aakriti & Ram, 2014). The NDVI, a widely used vegetation index, was calculated using equation 5:
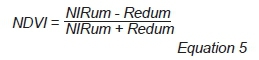
The NDVI was computed for 2000 and 2009 from bands 3 and 4 reflectance data, while it was computed from bands 4 and 5 for 2018.
vi. Estimation of Proportion of Vegetation represents the exposed proportion of green, non-green, and bare cover within each pixel. It is important for the estimation of land surface conditions such as soil erosion, and for assessing the impact of human activities (TERN, 2017: online). It is expressed in equation 6:
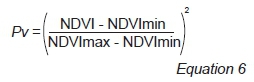
Where
Pv = Proportion of Vegetation
NDVI = DN value for a specific year
NDVImin = Minimum NDVI value for a specific year
NDVImax = maximum NDVI value for a specific year
vii. Derivation of Normalized Difference Built Index (NDBI). The NDBI image was computed for 2000 and 2009 from the bands 4 and 5 reflectance data while bands 5, 6, 10 and 11 were computed for 2018. It was calculated using equation 7:
viii. Derivation of Land Surface Emissivity (LSE). Satellite-sensed thermal infrared (TIR) data is the major source for estimating surface emissivity for a region. The estimated surface emissivity is derived from fine spatial resolution satellite data such as Landsat image TIR bands (Yang, 2003). Corrections for spectral emissivity are necessary and were done according to the nature of land cover, after deriving the Normalized Differences Vegetation Index (NDVI) and Normalized Differences Built-Up Index (NDBI) values for each satellite imagery pixel, as shown in equation 8.
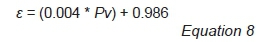
Where:
£ = Emissivity Value
0.0004 and 0.986 = Constant Values
Pv = Proportion of Vegetation
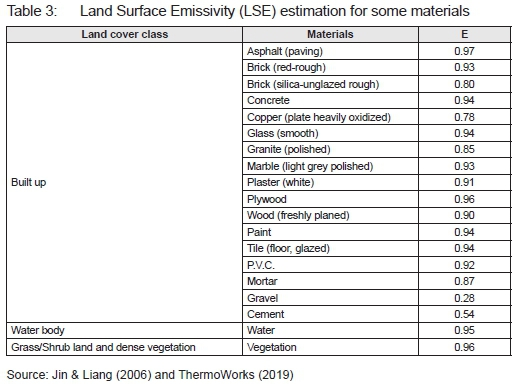
The land surface emissivity was retrieved using the Normalized Difference Vegetation Index (NDVI) threshold method (Tarawally et al., 2018). According to the method, when NDVI <0.2, the pixels are considered as bare lands and the emissivity was retrieved from the red spectral region. When NDVI >0.5, the pixels are considered to be full vegetation coverage and the emissivity value is assumed to be 0.99. When NDVI ranges between 0.2 and 0.5, the pixels are considered to be a mixture of soil and vegetation (Tarawally et al., 2018). Equation 8 was used to estimate Land Surface Emissivity. Table 3 presents reference values of emissivity for some materials that are peculiar to the land cover classes for the study.
ix. Derivation of Land Surface Temperature (LST). This is the radiative temperature of the land surface as measured in the direction of the remote sensor. It is estimated from atmosphere brightness temperatures, using the infrared spectral channels of the satellites. This is done by using equation 9:
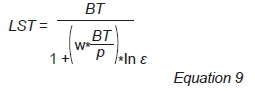
Where
LST = Land Surface Temperature (0oC)
BT = At Satellite Temperature p =  (1.438 * 10-2mk)
h = Planck's constant (6.626 * 10-34Js)
c = Velocity of Light (2.998 * 108 m/s)
s = Boltzmann's Constant (1.38 x 10⁻²³J/k)
3.3 Data analysis
The Statistical Package for the Social Sciences (SPSS) version 25 and Microsoft Excel were used to analyse the aspatial data, in order to determine and report the frequency and percentage of respondents' profile such as gender, age, level of education, monthly income, and duration of residency in the community. Residents' perception of LULC, causes of land use change and dominant environmental condition that had changed were also measured and reported in terms of frequencies and/or percentages. An observation checklist was used to document types and colour of roofing materials, type of material used for building walls, and landscaping materials. The results were also presented in the form of frequencies and/or percentages.
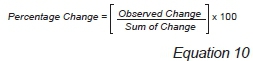
Spatial data were analysed, using ArcGIS 10.0. This was used for overlay operations where maps generated were superimposed on one another and the percentage change and trend between 2000 and 2018 was identified. The percentage change for each year was measured against each land use land cover type and the formula is expressed as:
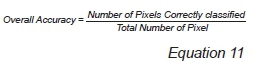
The accuracy measurement of how many ground truth pixels were classified correctly was done, because no map is a perfect representation of reality (Hamzah 2015). There are always errors in maps and there is a need to assess the level of accuracy. The result of an accuracy assessment provides an overall accuracy of the map based on the average of the accuracies for each class in the map. It is expressed as:
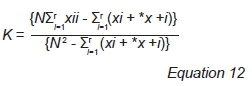
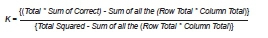
Kappa is used to measure the agreement or accuracy between the remote sensing derived classification map and the reference data as indicated by the major diagonals and the chance agreement, which is indicated by the row and column totals (Im & Jensen, 2005: 328331). Producer's accuracy is the total number of correct pixels in a category that is divided by the total number of pixels of that category, as derived from the reference data (Im & Jensen, 2005). The kappa factor is given by the formula:
Which is interpreted as:
The average overall accuracy and kappa coefficient of the Landsat imageries obtained for 2000, 2009 and 2018 for Ibadan City were 0.967% and 0.951%, respectively. This validated the suitability of data for the analyses in the study.
4. RESULTS
4.1 Questionnaire
Table 4 shows the demographic profile of respondents. The vast majority (60.0%) of the respondents were male. Approximately 11.0% of them were within the age bracket of 19-29 years; 38.9% were aged 30-39 years, and 50.5% of the respondents were aged 40 years and above. In terms of level of education, the vast majority (61.3%) had tertiary education certificates; 33.8% had secondary school certificates, while primary education and no formal education were represented by 4.3% and 0.5%, respectively.
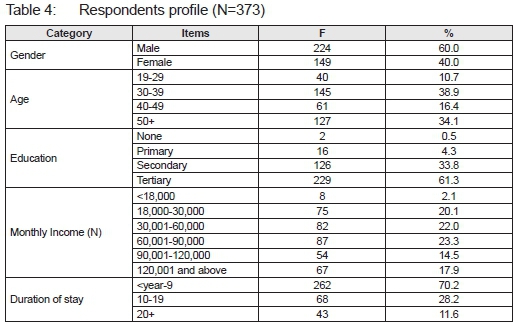
The modal income class for the respondents was N60,001-N90,000 accounting for 23.3%. Income group of between N30,001 and N60,000 were represented by 22.0%; those who fell within income group of N18,000-N30,000 were 20.1%, and N90,001-N120,000 were 13.9%. Those who earned less than N18,000 per month were 2.1%, and 17.9% had monthly income of N120,000 and above. The vast majority (70.2%) of the respondents had been residing in their current residences for between 1 and 9 years; 28.2% of the respondents had been in the neighbourhoods for 10-19 years, and 11.5% of the respondents had been residing in the present locations for over 20 years.
As shown in Table 5, almost three quarters of the respondents indicated that land use had not changed in their neighbourhoods, while 26.8% submitted that the land use had changed. The response on land use change could be a function of the individual's location within the city scape. It may also be a reflection of the duration of occupancy in the localities, as the vast majority (70.2%) of the respondents had been residing within their location for over ten years, as shown in Table 4. Owing to the respondents' location, the perception of land use change varies across the Ibadan regions, although approximately 70% of the respondents reported that the predominant land use change is conversion of agricultural land to residential development.
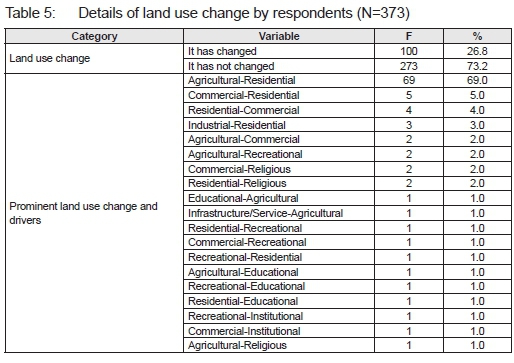
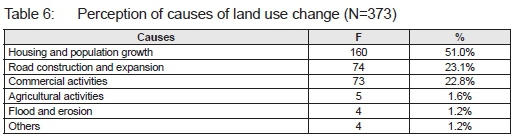
Table 6 lists some of the major causes of land use change, as identified by the respondents. The most significant accounting for more than half of the submission was provision of housing to the growing population (51.0%). Other causal factors were road construction and expansion of the existing ones (23.1%) and commercial activities (22.8%). Approximately 2.0% of the respondents identified agricultural activities as driver; 1.2% pointed to flooding and erosion, while others, including waste disposal, bush burning and abandoned projects, accounted for 1.2%.
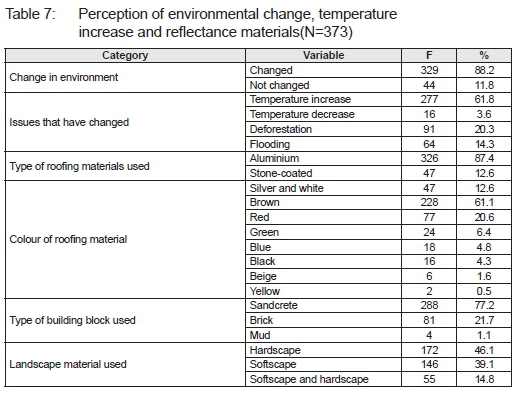
As shown in Table 7, the vast majority (88.2%) of the respondents affirmed that the environment has changed. The major issues that have changed, as submitted by the respondents, included temperature increase and decrease, represented by 61.8% and 3.6%, respectively. Other environmental issues were deforestation and flooding, accounting for 20.3% and 14.3%, respectively. Albedo, the rate of reflection of sun energy into the atmosphere, is a function of surface material. As shown in Table 7, the aluminium component, represented by 87.4%, constituted the main roofing material, while stone-coated materials accounted for 12.6%. In terms of the colour of roofing materials, shining surfaces such as silver accounted for 61.1% of the buildings sampled and dark surfaces of various shades represented 38.9%. The building materials used for construction show that sandcrete was dominant and the major landscaping materials were hardscape, especially concrete. All these have implications on the surface temperature of the environment, as will be shown in subsequent sections.
4.2 Normalized Difference Vegetation Index
The Normalized Difference Vegetation Index (NDVI) estimation for the year 2000 value was higher in the semi-urban local government areas (LGA) of the city. This could be attributed to the concentration of vegetation in the semi-urban LGA in year 2000. Figure 3 presents the names of communities in the suburban LGAs with high NDVI values. These were Moniya (Akinyele LGA), Agudu, Alufa and Odo-Oba (Egbeda LGA), Saliu, Igbona, Elewe, Idiamu, Idi-Aya, Aba-Ada, Ogbontosan and Ajibode (Ido LGA) Elesu and Akobo (Lagelu LGA), Araromi, Awise, Akanran, Abu-Kuye, and Arinokuta (Ona-Ara LGA) and Ogunmakin, Kaka, Onigambari, Ake, Ajao and Olujudoro (Oluyole LGA). All the listed communities, as obtained from the questionnaire administered and interviews conducted, were rustic in year 2000.
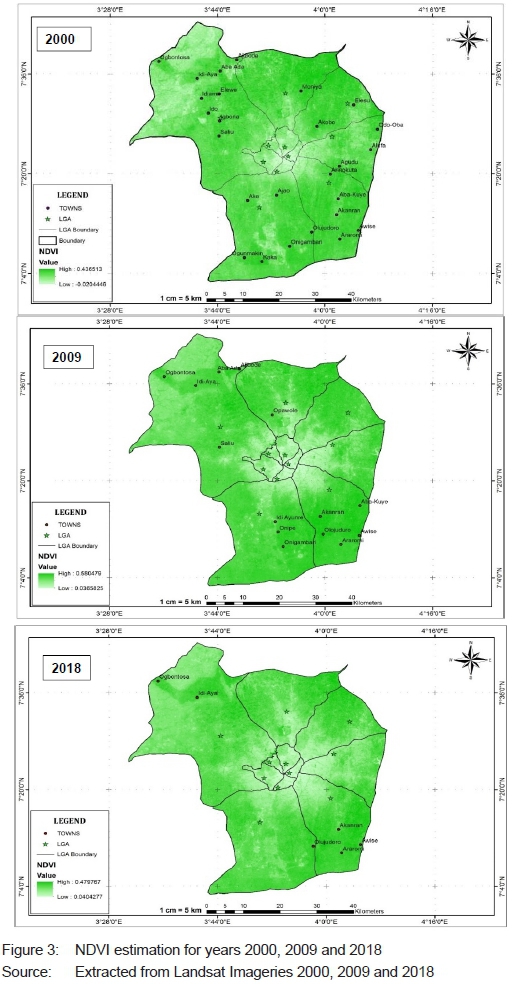
It was also estimated that the NDVI value was higher in the semi-urban local government areas (LGA) in the year 2009, but the number of communities in each rural LGA with high NDVI values declined in 2009 when compared with year 2000. Figure 3 reveals the communities in the LGAs with high NDVI values to include Opawole (Akinyele LGA), Saliu, Idi-Aya, Aba-Ada, Ogbontosan and Ajibode (Ido LGA), Akanran, Abu-Kuye, Awise, Araromi and Olujuduro (Ona-Ara LGA) and Onigambari, Onipe and Idi Ayunre (Oluyole LGA). The NDVI values in year 2018 reduced significantly and very few communities had dense vegetation. It was estimated that the NDVI value was higher in the semi-urban local government areas (LGAs) in the year 2018. In Ido LGA, the communities with high value NDVI were Idi-Aya and Ogbontosan; in Ona-Ara LGA, the communities were Akanran, Araromi, Awise and Olujuduro.
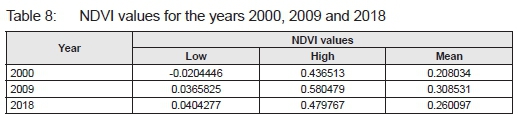
The nexus of 2000, 2009 and 2018 NDVI estimations is presented in Table 8. Theoretically, NDVI values are represented as a ratio ranging in value from -1 to +1. However, in practice, extreme negative values represent water, values around zero represent bare soil and values close to one represent dense green vegetation (Babalola & Akinsanola, 2016). Figure 3 shows the spatial distribution of NDVI in the city for the years 2000, 2009 and 2018. Visual inspection ascertained the differences of each NDVI. The highest degree of difference was observed in 2000, with the majority of NDVI values appearing to be below 0. Table 8 indicates the high and low NDVI values for the years 2000, 2009 and 2018. For the years 2000 and 2009, the NDVI value showed that the condition of the vegetation tended towards +0.5, which was an indicator of healthy vegetation. In 2018, the increased concentration of built-up areas placed a demand on vegetation cover; thus, the NDVI value for the year decreased.
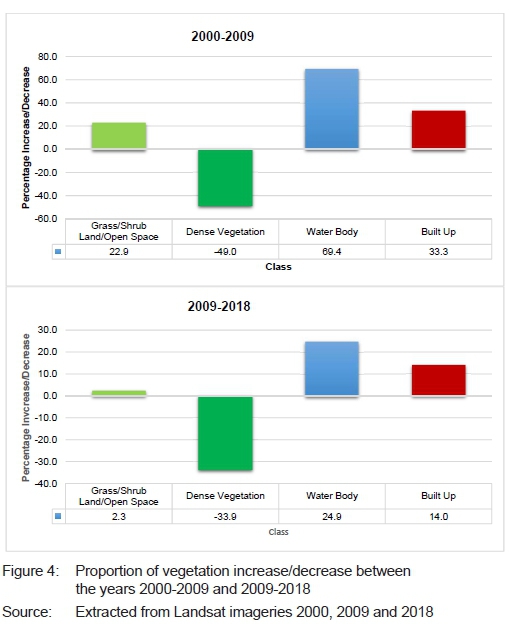
4.3 Proportion of vegetation
Figure 4 represents the exposed proportion of green, non-green, and bare cover within each pixel for Landsat Satellite imageries for the years 2000, 2009 and 2018. The formula used in calculating the proportion of vegetation was expressed in Equation 6. The outcomes were further used to analyse the Normalized Difference Built-Up Index (NDBI).
4.4 Normalized Difference Built-Up Index
The Normalized Difference Built-Up Index (NDBI) is also considered an important factor and indicator of land surface emissivity and temperature (Grover & Singh, 2015: 135-137). Xiong, Huang, Chen, Ye, Wang and Zhu (2012) observe that high temperature anomalies are closely associated with built-up land, densely populated zones, and heavily industrialised districts. NDBI is sensitive to built-up land, and its values also range between -1 to +1; positive values represent highly built-up land and negative values indicate other types of land cover (Chen, Zhao, Li & Yin, 2006). Equation 7 is applied for estimating NDBI (Chen et al., 2006; Xu, 2007). Figure 5 depicts the extracted NDBI classes indicating intensity and spatial pattern of built-up and impervious land area for the year 2000. The minimum and maximum NDBI values were 0.351 and 0.531, respectively. However, in the city, especially in the core area, except for the water body areas, very high NDBI values (0.061 to 0.531) were recorded.
The extracted intensity and spatial pattern of the built-up area and impervious land area for the year 2009 minimum and maximum NDBI values were -0.434 and 0.750, respectively. The concentration of built-up area in the core of the city has the highest NDBI values (0.025 to 0.750), which includes Ibadan North, Ibadan North-East, Ibadan North-West, Ibadan SouthEast and Ibadan South-West. However, high NDBI values were recorded in various parts of Ibadan suburban areas as the town and neighbourhoods spread from the urban areas into the suburban areas. The areas covered with vegetation possessed negative NDBI values ranging from -0.434 to -0.281. The minimum and maximum NDBI values for the built-up area and impervious land areas for the year 2018 were -0.364 and 0.602, respectively. The concentration of built-up area in the core have the highest NDBI values, ranging between 0.023 and 0.602, which includes Ibadan North, Ibadan orth-East, Ibadan North-West, Ibadan South-East and Ibadan South-West. High NDBI values were also recorded in various parts of Ibadan's suburban areas as the town and neighbourhoods spread from the urban areas into the suburban areas. The areas covered with vegetation possess negative NDBI values ranging between -0.364 and -0.190.
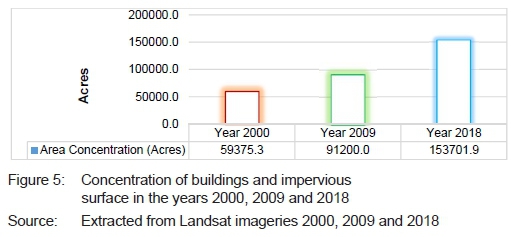
The nexus of 2000, 2009 and 2018 NDBI estimations captured in Figure 5 shows the relationship intheconce ntration of buildings and impervious surfaces across the years 2000, 2009 and 2018 values. The estimation indicated that, between 2000 and 2009, the area of concentration of impervious surface increased by approximately 31,877 acres and, between 2009 and 2018, it further increased by approximately 62,518 acres.
4.5 Estimation of land surface emissivity
The dense vegetation and grass/ shrub lands, as shown in Figure 6 for the year 2000 had the lowest minimum 0.9860 and 0.9862, while the maximum emissivity values were 0.9862 and 0.9863. This was an indication that vegetated canopy intercepts incoming short-wave solar energy. Solar heating of the earth's surface is uneven, because land absorbs heat faster than water, causing air to warm, expand and rise over land while it cools and sinks over the cooler water surfaces (National Oceanic and Atmospheric 2017). This explains the mean emissivity value for water in the year 2000 (0.9863). Surfaces that are perpendicular to the sun's ray path without any obstruction from buildings and canopy cover also emit high heat waves (National Oceanic and Atmospheric, 2017). This further explains the emissivity value for the year 2000, which is 0.9864.
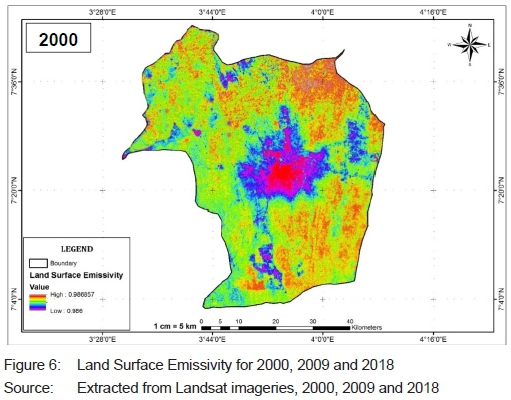
In 2009, the vegetated area had the lowest mean emissivity values of 0.9861 and 0.9862. The mean emissivity value for water and open space in the year 2009 were 0.9864 and 0.9865, respectively, and that of the built-up area in the year 2009 was 0.9867. In the year 2018, the vegetated area had the lowest maximum and minimum emissivity values of 0.9860 and 0.9861, respectively. The mean emissivity value for water and open space in the year 2000 were 0.9861 and 0.9862, respectively. The mean emissivity value for the built-up area in the year 2018 was 0.9864. This was slightly lower than the values for the years 2000 and 2009, but higher than the values for other types of land use for the year 2018, as shown in Figure 6.
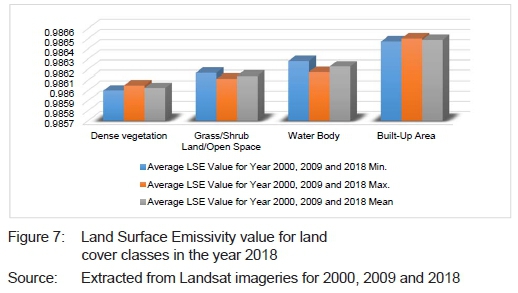
Figure 7 presents the nexus of 2000, 2009 and 2018 LSE estimations of spatial distribution of surface emissivity values, using the NDVI threshold method. The average LSE value for the years 2000, 2009 and 2018 revealed that the NDVI mean values for dense vegetation, grass/shrub land/open space, water body and built-up area were 0.9860, 0.9861, 0.9862 and 0.9864, respectively. The NDVI value indicated that the year 2000 had a reduced maximum value compared to other analysed years. This was a reflection that materials that could absorb solar radiation and convert it to internal energy were available, especially in the form of vegetation cover. In the year 2018, the minimum value ranged between 0.0404277 and -0.479767, indicating a depletion in absorbency materials.
4.6 Land Surface Temperature estimation
The mathematical algorithm in equation 9 was used to estimate the land surface temperature (LST). The mean estimated dry bulb temperature for Ibadan city obtained from the Nigerian Meteorological Agency for the years 2000, 2009 and 2018 were 27.2°C, 27.4°C and 27.5°C, respectively. At the micro-level of the analysis, Figure 8 shows the LST values for each of the classes of land use for the years 2000, 2009 and 2018. In the year 2000, the dense vegetation (22.5°C) and grass/shrub land/open space (24.5°C) indicated that surface temperature decreased towards the periphery and was directly related to land use and land cover types. From the analyses, waterbody, with relatively high heat storage and transfer capacity, had a mean surface temperature of 26°C. The highest temperature, 33.5°C, was recorded in the core area of the city where the built-up area was concentrated. The outcome was influenced by multiple factors such as impervious surface, LULC, surface roughness, and materials used for construction (Aakriti & Ram, 2014). The lowest surface temperature recorded for the year 2000 was 21°C, while the highest was 39°C.
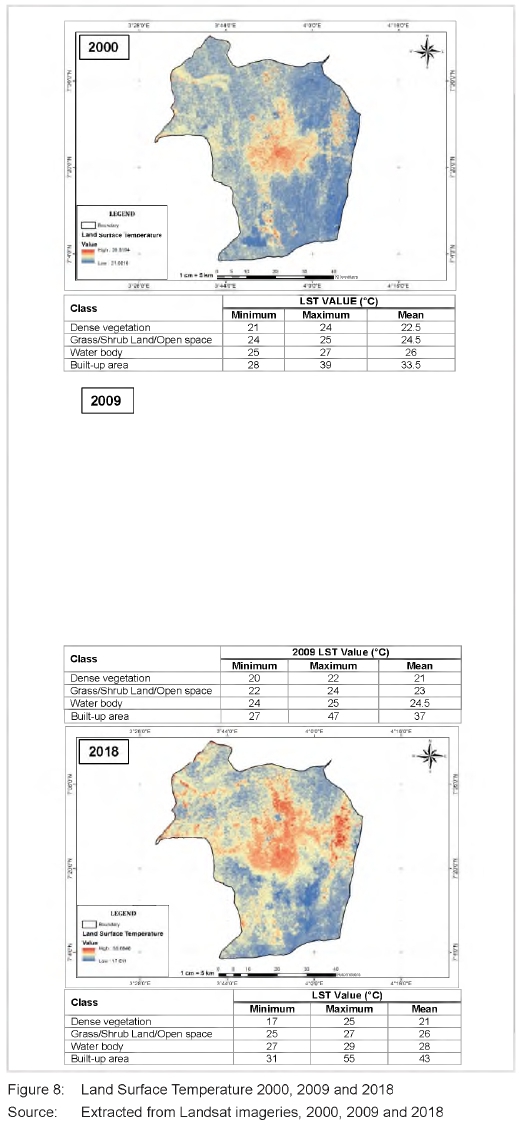
The visual representation and values of LST for each of the classes of land use in 2009 indicate that surface temperature for dense vegetation was 21°C and for grass/shrub land, 23°C. The water body mean surface temperature was recorded at 24.5°C. The highest temperature (37°C) was recorded in the core area of Ibadan. However, in some pockets of areas/locations, the LST value was also recorded as 37°C. The lowest surface temperature value for the year 2009 was 20°C and the highest was 47°C. In 2018, as shown in Figure 8, dense vegetation and grass/shrub land/open space had a mean surface temperature of 21°C and 26°C, respectively. Water body mean surface temperature was 28°C. The highest temperature (43°C) was recorded in the core area of Ibadan. The lowest surface temperature for the year 2018 was 17°C, while the highest was 55°C.
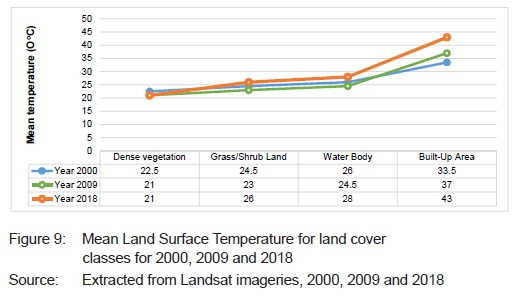
The nexus of the 2000, 2009 and 2018 LST estimations, as shown in Figure 9, indicate that surface temperature increased from year 2000 to 2018. This is attributable to human activities that change the natural composition of the land cover in the city. Therefore, construction materials used such as impervious concrete, asphalt and building materials; LULC and surface roughness from the built-up areas contributed to the increase in temperature of Ibadan's urban areas.
5. DISCUSSION
Among the pertinent issues in urban centres is the increasing in temperature of the land surface, owing to changes in land use and land cover, particularly the conversion of pervious surfaces to impervious surfaces This study analysed the spatio-temporal trend and nexus of LULC change and emissivity in the years 2000, 2009 and 2018. The goal was to determine LULC, NDVI, NDBI, LSE, LST and the driver of LULC and LSE in Ibadan, using meteorological data and Landsat data. This study also examined the perception of the people (in all the local government areas in the city) on the changes of LULC and LST.
The increased temperature associated with land surface emissivity have been documented as having major negative environmental impacts, not only on urban environments, but also on rural areas, by contributing to climate change (Arrau & Pena, 2010: online; Kasim et al., 2018: 806; NIMET, 2018). Data obtained from NIMET documented the mean dry bulb temperature for the city in the years 2000, 2009 and 2018 to be 27.2oC, 27.4oC and 27.5oC, respectively. The increase in temperature, as evident in residents' response, remains an environmental challenge that affects the inhabitants of the city. This corroborates the findings of Aizebeokhai (2009: 875-876) who reports that the earth's surface has warmed significantly in the last century. The increase in temperature in Ibadan city has placed a demand on energy consumption by using air-conditioning systems to cope with the harsh environmental condition (Kasim et al., 2018: 809). This has implications for the limited energy capacity of the country that manifests in incessant electrical power outages that aggravates the heat-induced discomfort. As observed by Popoola and Alli (2015: 85) thermal discomfort in Ibadan has been attributed to the effect of the increase in temperature that manifests in headache, high body temperature, and excessive sweating.
According to Abegunde and Oluwatobi (2015: 245-246), increase in temperature is one of the resultant effects of changes in land use land cover. As vital as this information is, the vast majority (62.2%) of the respondents were unaware of the implications of land use change on the environment. This outcome can be changed with effective public awareness programmes, using the available mass media. However, Arimah and Adeagbo (2000: 293) observe that most often, the issue is not simply about households not being aware of the implications of land use change in their environment, but about the compliance of households to planning regulations to avert the adverse environmental implications of land use changes. Studies by Agbola and Agbola (1997: 140-141); Jalili, (2013); Agbola et al., (2014: 45), and Guyassa, Frankl, Lanckriet, Biadgilgn, Zenebe, Zenebe, et al. (2018: 1538-1539) reported that the fastest and common land use conversion is from agricultural to residential land use. This is corroborated by the findings of this study. Other drives of land use conversions were commercial, industrial, recreational, and religious activities. Population growth and residential land use, income generation activities, and road construction are some of the pertinent issues in the conversion of vegetated surface to impervious surface (Mallick, Kant & Bharath, 2008: 137; Quattrochi et al., 2012).
Construction materials with high albedo content used, especially in the city in the conversion of land uses particularly from dense vegetation land use and grass/shrub land/ open space land use to built-up land use include building, roofing, and landscaping materials. Findings from the survey revealed that the vast majority of the respondents used concrete blocks in the construction of buildings. According to Shaik, Gorantla and Setty (2016: 499-501), concrete blocks have the best potential for heat resistivity. It was also revealed that the prominent roofing material was aluminium. Adewale (2017: online) reports that an aluminium roof has the highest thermal absorptivity when compared to stone-coated roofing sheet. The colour of a roof also contributes to temperature increase or decrease in an environment. Peters, Victor and Sanya (2017: 92) attest to this, stating that black colours absorb light, whereas white colours reflect light. However, observations showed that most (52.0%) of the roof colour in the study area is silver, while 20.6% of the respondents' roof colour is brown.
Landscaping material used in an environment has the capacity to influence the thermal environment positively or negatively (Bukola, 2011). Observations from the survey revealed that hardscape elements are predominantly used as landscaping materials, while softscape such as trees, shrubs and flowers are scarcely used. The adoption of softscape, also known as cool pavements, has a renowned ability to effectively reflect light and heat via the albedo effect, directly reducing heat gain by reflecting the sun's energy into the atmosphere and preventing direct absorption of the energy by the buildings (Global Cool Cities Alliance, 2011: online). Olaleye, Abiodun and Asonibare (20120: 194-195) observe that land use and land cover dynamics revolve around two questions, notably the causes and the impacts of land use changes and emissivity. However, determining the drivers of land use land cover dynamics and emissivity is not clear as they are debatable. But it is agreed that the two main categories of such agents of change are bio-physical and socio-economic (Mengistu & Salami, 2007: 107). The bio-physical drivers include geo-processes such as climatic variations. The socio-economic drivers comprise economic, political and institutional factors and technological change related to land use, which varies over space with time (Olaleye et al., 2009: 195). In the study, one of the major drivers of LULC is human activities in the form of uncontrolled urban expansion. To strengthen Ibadan's resilience capacity, the need to adopt physical planning interventions becomes imperative. This should be the adoption of urban consolidation to address the sprawl and enforcement of physical planning provisions on buildable space within a given plot size. For example, as stated in the Oyo state space standards, roughly 55% of a plot area should be for erecting buildings, while the remaining land should be dedicated to softscape such as cool pavements, green development, and urban forest regeneration.
It has been documented that changes in land use land cover cause other environmental issues such as deforestation and flooding (Jha, 2011; Pravitasari, 2015). For example, perennial flooding occurences in the city have been attributed to LULC change and reduction in pervious surfaces, owing to urban expansion and the adoption of hardscale elements, leading to reduction in rainfall percolation and increasing run-off (Agbola, Ajayi, Taiwo & Wahab, 2012: 213-215; Adewole et al., 2015: 200). From the spatial data and Landsat imageries for the years 2000, 2009 and 2018, the built-up area's land cover and water body, land cover has been on the increase, while dense vegetation was found to be decreasing. The impervious land cover which was on the increase was attributed to the increase in human activities such as construction of buildings, roads and infrastructure, which also resulted in a loss of approximately 41.8% (1337km2) of dense vegetation. The visual inspection of the differences of each NDVI revealed the high values that were observed in the year 2000 in communities in the rural LGAs (Akinyele, Egbeda, Ido, Lagelu, Ona-Ara & Oluyole) while low values were obtained in urban LGAs of the city. In the year 2018, the NDVI values showed that the condition of the vegetation tends towards +0.5, an indication of decreasing vegetation cover in the rural LGAs such as Ido and Ona-Ara. In addition, the NDBI values revealed that the concentration of built-up area in the core area of the city had the highest NDBI (0.023-0.602). The core areas are Ibadan North, Ibadan NorthEast, Ibadan North-West, Ibadan South-East, and Ibadan South-West, as well as some parts of Ibadan's suburban areas with increasing urban encroachment, especially housing construction, to accommodate the growing population. This shows that the concentration of buildings and impervious surfaces over the years has been on the increase; the more the concentration of building and impervious surfaces, the higher the emissivity and temperature in the environment (Grover & Singh, 2015: 135).
Thermal analysis to estimate the LSE and the LST for the years 2000, 2009 and 2018 revealed that dense vegetation and grass/shrub lands had the lowest maximum and minimum emissivity values of 0.9861 and 0.9862, respectively. The vegetation canopy has been documented to intercept incoming short-wave solar radiation, absorb it for the process of photosynthesis, and release excess energy in the process of evapotranspiration (Zaharaddeen et al., 2016: 38-39). However, surfaces that are perpendicular to the sun's ray path, without any obstruction, peak the heat wave length (National Oceanic and Atmospheric 2017). This is particularly associated with built-up land cover. The direct impact of sun's ray path is responsible for the high emissivity values of elements of the built-up areas. The estimations of LST further revealed that the vegetated areas and water bodies have, over the years, been relatively cooler because of the evapotranspiration process and the water body having the capacity to absorb heatwaves during the day and providing a cooling effect on the environment. The built-up area in the core of the city recorded the highest mean surface temperature at 33.5°C, 37°C and 43°C in the years 2000, 2009 and 2018, respectively. This is higher than the values provided by NIMET and the outcome is also in tandem with Adelekan (2012) who ascertains that Ibadan is exposed to heat stress and incidences of dehydration.
6. CONCLUSION
With the increase in urbanisation, human activities have generated intense and sometimes excess heat from buildings, transportation, industrial and residential areas in Ibadan, leading to the changing energy balance of the environment. In a world facing rapid urbanisation and a changing climate, it is becoming increasingly important to understand the nexus of LULC change and LSE. Such knowledge gained can be used for environmental education and public awareness to influence policies and strategies to curb the adverse effects of surface emissivity in Ibadan and build the city's resilience to respond to climate change-induced challenges. Hence, planners and resource managers use the reliable mechanism provided by analysis of LULC change and LST and emissivity to assess the consequence of changes imposed on natural resources, in order to detect, monitor and analyse LULC change, LST and emissivity efficiently. The actions human beings take or fail to take and the path that human beings choose to follow in curbing LSE will either break or make the earth. Human activities on the earth have resulted in increased land surface temperature. Human beings have the capacity to reduce increase in temperature and its impact by means of appropriate actions. Physical planning interventions, which include adherence to plot size building ratio, urban consolidation, tree planting and other cool approaches to planning, should be adopted, in order to adapt to climate change and build the city's natural resilience capacity. Therefore, owing to heat reduction components of natural vegetation, as shown in the study, it will be cost effective to adopt plant-a-tree-per-building strategy. This may be extended as urban forestry, which is an integrated, citywide approach to the planting, care and management of trees, in order to secure multiple environmental and social benefits for urban dwellers, build resilience, and entrench sustainable development. However, not taking action to build capacity by reducing or stabilising the emissivity of surface materials would mean more greenhouse gases in the atmosphere, more turbulent weather, and more heat-related diseases. In a world facing rapid urbanisation and changing climate, it is becoming increasingly important to understand the nexus of LULC change and LSE. Such knowledge gained can be used for environmental education and public awareness to influence policies and strategies to curb the adverse effects of surface emissivity in Ibadan and build the city's resilience to respond to climate change-induced challenges.
7. ACKNOWLEDGEMENTS
The authors are grateful to the anonymous reviewers for their enlightening, constructive, and useful comments on the manuscript.
REFERENCES
AAKRITI, G. & RAM, S.G. 2014. Analysis of Urban Heat Island (UHI) in relation to Normalized Difference Vegetation Index (NDVI): A comparative study of Delhi and Mumbai. Environments, vol. 2, pp. 125-138. https://doi.org/10.3390/environments2020125 [ Links ]
ABEGUNDE, L. & OLUWATOBI, A. 2015. Impact of land use change on surface temperature in Ibadan, Nigeria. World Academy of Science, Engineering and Technology. International Journal of Environmental and Ecological Engineering, 9(3), pp. 235-241. [ Links ]
ADELEKAN, I.O. 2012. Effects of urbanization and climatic changes on UPA in Ibadan, Nigeria. Paper presented at the 3rd Global Forum on Urban Resilience & Adaptation, 12-15 May, Bonn, Nordrhein-Westfalen, Germany. [ Links ]
ADEWALE, A.S. 2017. Comparative study of thermal properties of some common roofing materials in Nigeria. [Online]. Available at: <https://iproject.com.ng/physics/comparative-study-of-thermal-properties-of-some-common-rooflng-matenals-in-nigeria/index.html> [Accessed: 14 November 2018]. [ Links ]
AGBOLA, T. 2013. The quest for a master plan for (the City of) Ibadan. Adegoke Adelabu Memorial Lecture on the Theme "Masterplan for Ibadan". An Ibadan Foundation Project. [ Links ]
AGBOLA, T. & AGBOLA, E.O. 1997. The development of urban and regional planning legislation and their impact on the morphology of Nigerian cities. The Nigerian Journal of Economic and Social Studies, 39(1), pp. 123-144. [ Links ]
AGBOLA, S.B, KASIM, O.F. & COKER, M.O. 2014. Dynamics of land use and land cover change in Ibadan Region, Nigeria. In: Bicík, I., Himiyama, Y., Feranec, J. & Kupková, L. (Eds). Land use/Cover changes in selected regions in the world: Volume IX. IGU/LUCC, Faculty of Science, Charles University, Prague, and Hokkaido University of Education, Asahikawa, pp. 43-48. [ Links ]
AGBOLA, S.B., AJAYI, O., TAIWO, O.J. & WAHAB, B.W. 2012. The August 2011 flood in Ibadan, Nigeria: Anthropogenic causes and consequences. International Journal of Disaster Risk Science, vol. 3, pp. 207-217. https://doi.org/10.1007/s13753-012-0021-3 [ Links ]
AIZEBEOKHAI, A.P. 2009. Global warming and climate change: Realities, uncertainties and measures. International Journal of Physical Sciences, 4(13), pp. 868-879. [ Links ]
ALVI, M.H. 2016. A manual for selecting sampling techniques in research. Pakistan: University of Karachi, Iqra University. [ Links ]
ARIMAH, B.C. & ADEAGBO, D. 2000. Compliance with urban development and planning regulations in Ibadan, Nigeria. Habitat International, 24(3), pp. 279-294. https://doi.org/10.1016/S0197-3975(99)00043-0 [ Links ]
ARRAU, C.P. & PENA, M.A. 2010. The Urban Heat Island (UHI) effect. [Online]. Available at: <http://www.urbanheatislands.com> [Accessed: 24 April 2019]. [ Links ]
AUDU, M.O. & ISIKWUE, B.C. 2015. Survey of the reflectivity of the earth's atmosphere over some selected cities in Nigeria. International Research Journal of Pure and Applied Physics, 3(1), pp. 57-66. [ Links ]
AUDU, M.O., ISIKWUE, B.C. & EWEH, E.J. 2015. Evaluation of seasonal and annual variations of evapotranspiration with climatic parameters in Ibadan, Nigeria. Journal of Earth Sciences and Geotechnical Engineering, 5(2), pp. 69-79. [ Links ]
BABALOLA, O.S. & AKINSANOLA, A.A. 2016. Change detection in Land Surface Temperature and Land Use Land Cover over Lagos Metropolis, Nigeria. Journal of Remote Sensing and GIS, 5(3), pp. 2469-4134. https://doi.org/10.4172/2469-4134.1000171 [ Links ]
BROVELLI, M.A., MINGHINI, M. & VALENTINI, L. 2011. Web services and historical cadastral maps: The first step in the implementation of the Web C.A.R.T.E. system. In: Ruas, A. (Ed.). Advances in Cartography and GIScience. Volume 2. Lecture Notes in Geoinformation and Cartography, vol 6. Berlin, Heidelberg: Springer, pp. 147-161. https://doi.org/10.1007/978-3-642-19214-2_10 [ Links ]
BRUCE, C.M. & HILBERT, D.W. 2006. Pre-processing methodology for application to Landsat TM/ETM+ Imagery of the wet tropics. Australia, Clayton: Commonwealth Scientific and Industrial Research Organisation (CSIRO) Tropical Forest Research Centre and Rainforest CRC. [ Links ]
BUKOLA, S.A. 2011. The impact of soft landscaping on the microclimate of a typical bungalow in Akure. Unpublished term paper. Akure: Federal University of Technology. [ Links ]
CHEN, X.L., ZHAO, H.M., LI, P.X. & YIN, Z.Y. 2006. Remote sensing image-based analysis of the relationship between urban heat island and land use/cover changes. Remote Sensing of Environment, 104(2), pp. 133-146. https://doi.org/10.1016Zj.rse.2005.11.016 [ Links ]
CRESWELL, J.W. 2014. Research design: Qualitative, quantitative and mixed methods approaches. 4th edition. Thousand Oaks, CA: Sage Publications. [ Links ]
ELERT, G. 2018. Blackbody radiation, the Physics Hypertextbook. [Online]. Available at: <https://physics.info/radiation>/ [Accessed: 17 June 2018]. [ Links ]
ENARUVBE, G.O. 2018. A systematic assessment of plantation expansion in Okomu Forest Reserve, Edo State. Southern Nigeria. Nigerian Research Journal of Engineering and Environmental Science, 3(1), pp. 39-47. [ Links ]
ENARUVBE, G.O. & PONTIUS JR, R.G. 2015. Influence of classification errors on intensity analysis of land change in Southern Nigeria. International Journal of Remote Sensing, 36(1), pp. 244-261. https://doi.org/10.1080/01431161.2014.994721 [ Links ]
EC (EUROPEAN COMMISSION). 2000. Manual of concepts on land cover and land use information system. Luxembourg: European Communities. [ Links ]
FABIYI, O.O. 2006. Urban land use change analysis of a traditional city from remote sensing data: The case of Ibadan metropolitan area, Nigeria. Humanity and Social Science Journal, 1(1), pp. 42-64. [ Links ]
FOLORUNSHO, A.F., BALOGUN, A., ADEDIJI, A.T., OLUMIDE, A. & ABDULKAREEM, S.B. 2017. Assessment of urban heat island over Ibadan Metropolis using Landsat and Modis. International Journal of Environment and Bioenergy, 12(1), pp. 62-87. [ Links ]
GLASS, C.E. 2013. Interpreting aerial photographs to identify natural hazards. Tuscan: Elsevier. https://doi.org/10.1016/B978-0-12-420018-0.00013-0 [ Links ]
GLOBAL COOL CITIES ALLIANCE., 2011. GCCA overview. [Online]. Available at: < https://coolroofs.org/documents/GCCAOverview_May2011.pdf> [Accessed: 11 March 2018]. [ Links ]
GROVER, A. & SINGH, R.B. 2015. Analysis of Urban Heat Island (UHI) in relation to Normalized Difference Vegetation Index (NDVI): A comparative study of Delhi and Mumbai. Environments, 2(2), pp. 125-138. https://doi.org/10.3390/environments2020125 [ Links ]
GUYASSA, E., FRANKL, A., LANCKRIET, S., BIADGILGN, D., ZENEBE, G. & ZENEBE, A., et al. 2018. Changes in land use/cover mapped over 80 years in the Highlands of Northern Ethiopia. Journal of Geographical Sciences, 28(10), pp. 1538-1563. https://doi.org/10.1007/s11442-018-1560-3 [ Links ]
HAMZAH, N.O.B. 2015. Land use/ Land cover classification and change analysis by Multi-temporal Remote Sensing Data. B.Sc. Project, University of Malaysia, Pahang, Malaysia. [ Links ]
IM, J. & JENSEN, J.R. 2005. A change detection model based on neighborhood correlation image analysis and decision tree classification. Remote Sensing of Environment, 99(3), pp. 326-340. https://doi.org/10.1016/j.rse.2005.09.008 [ Links ]
IPCC (INTERGOVERNMENTAL PANEL ON CLIMATE CHANGE). 2007. Climate change 2007: The physical science basis. Contribution of Working Group I to the 4th Assessment Report. [IPCC's Fourth Assessment Report (AR4)]. Brussels: Intergovernmental Panel on Climate Change. [ Links ]
JALILI, S.Y. 2013. The effect of land use on land surface temperature in The Netherlands. Unpublished Ms. thesis. Physical Geography and Ecosystem Science, Lund University, The Netherlands. [ Links ]
JHA, A. 2011. Urban flood risk management for the 21st century. Geneva: World Health Organization. [ Links ]
JIN, M. & LIANG, S. 2006. An improved land surface emissivity parameter for land surface models using global remote sensing observations. Journal of Climate, vol. 19, pp. 2867-2869. https://doi.org/101175/JCLI3720.1 [ Links ]
KASIM, O.F. 2018. Wellness and illness: The aftermath of mass housing in Lagos, Nigeria. Development in Practice, 28(7), pp. 952-963. https://doi.org/10.1080/09614524.2018.1487385 [ Links ]
KASIM, O.F., ABSHARE, M. & AGBOLA, S.B. 2018. Analysis of air quality in Dire Dawa, Ethiopia. Journal of the Air and Waste Management Association, 68(8), pp. 801-811. DOI: 10.1080/10962247.2017.1413020 [ Links ]
KASIM, O.F., WAHAB, B. & OLAYIDE, O.E. 2021. Assessing urban liveability in Africa: Challenges and interventions. In: Leal Filho, W., Azul, A.M., Brandli, L., Lange Salvia, A. & Wall, T. (Eds). Industry, innovation and infrastructure. Encyclopedia of the UN Sustainable Development Goals. Cham, Switzerland: Springer, forthcoming. https://doi.org/10.1007/978-3-319-71059-4_70-1 [ Links ]
KREJCIE, R.V. & MORGAN, D.W. 1970. Determining sample size for research activities. Educational and Psychological Measurement, vol. 30, pp. 607-610. https://doi.org/10.1177/001316447003000308 [ Links ]
LANDSAT PROJECT SCIENCE OFFICE. 2002. Landsat 7 Science Data User's Handbook. Goddard Space Flight Center, NASA: Washington, DC. [ Links ]
LANDSAT PROJECT SCIENCE OFFICE. 2018. Landsat 7 Science Data User's Handbook. Goddard Space Flight Center, NASA: Washington, DC. [ Links ]
LO, C.P. & QUATTROCHI, D.A. 2003. Land-use and land cover change, urban heat island phenomenon, and health implications: A remote sensing approach. Photogrammetric Engineering and Remote Sensing, vol. 9, pp. 69-81. https://doi.org/10.14358/PERS.69.9.1053 [ Links ]
MALLICK, J., KANT, Y. & BHARATH, B.D. 2008. Estimation of land surface temperature over Delhi using Landsat-7 ETM+. Indian Geophysical Union, 12(3), pp. 131-140. [ Links ]
MENGISTU, D.A. & SALAMI, A.T. 2007. Application of remote sensing and GIS inland use/land cover mapping and change detection in a part of South Western Nigeria. African Journal of Environmental Science and Technology, vol. 1, pp. 99-109. [ Links ]
MESSAH, O.B. & KIGIGE, A.M. 2011. Factors influencing real estate property prices: A survey of real estates in Meru Municipality, Kenya. Journal of Economics and Sustainable Development, 2(4), pp. 34-54. [ Links ]
MORABITO, M., CRISCI, A., MESSERI, A., ORLANDINI, A., RASCHI, A., MARACCHI, G. & MUNAFO, M. 2016. The impact of built-up surfaces on land surface temperatures in Italian urban areas. Science Total Environment, 551-552(1), pp. 317-326. https://doi.org/10.1016/j.scitotenv.2016.02.029 [ Links ]
NATIONAL OCEANIC AND ATMOSPHERIC. 2017. Global Climate Report. Annual Report, North Carolina: National Oceanic and Atmospheric. [ Links ]
NATIONAL POPULATION COMMISSION. 2006 Nigeria population and housing census report. [Online]. Available at: <https://catalog.ihsn.org/index.php/catalog/3340> [Accessed: 11 March 2018]. [ Links ]
NAOUM, S.G. 2013. Dissertation research and writing for construction students. 3rd edition. Oxford: Butterworth-Heinemann. https://doi.org/10.4324/9780203720561. [ Links ]
NIMET (NIGERIAN METEOROLOGICAL AGENCY). 2018. Nigerian Meteorological Agency. [Online]. Available at: <http://www.nimet.gov.ng/aggregator/sources/1> [Accessed: 11 March 2018]. [ Links ]
NZOIWU, C.P., AGULUE, E.I., MBAH, S. & IGBOANUGO, C.P. 2017. Impact of land use/land cover change on surface temperature condition of Awka Town, Nigeria. Journal of Geographic Information System, 9(6), pp. 763-776. https://doi.org/10.4236/jgis.2017.96047 [ Links ]
OLADELE, B.M. & OLADIMEJI, B.H. 2011. Dynamics of urban land use changes with remote sensing: Case of Ibadan, Nigeria. Journal of Geography and Regional Planning, 4(11), pp. 632-643. [ Links ]
OLALEYE, J.B., ABIODUN, O.E. & ASONIBARE, R.O. 2012. Land-use and land cover analysis of Ilorin Emirate between 1986 and 2006 using Landsat imageries. African Journal of Environmental Science and Technology, 6(4), pp.189-198. https://doi.org/10.5897/AJEST11.145 [ Links ]
OLOMO, R.O. 2003. The current trend of mapping in Nigeria. Cartography, 32(1), pp. 39-51. DOI: 10.1080/00690805.2003.9714233 [ Links ]
PETERS, O.R, VICTOR, M. & SANYA, A.O. 2017. Effects of roof colors on the environment. International Journal of Scientific Research and Innovative Technology, 4(6), pp. 85-95. [ Links ]
POPOOLA, A.A & ALLI, O.I. 2015. Peoples' perception on the effect of climate variability on human physiological comfort in Ibadan North Local Government Area, Ibadan. Africa: Journal of Contemporary Issues, 13(3), pp. 71-87. [ Links ]
PRAVITASARI, A.E. 2015. Study on impact of urbanization and rapid urban expansion in Java and Jabodetabek Megacity, Jakarta, Indonesia. Unpublished PhD thesis. Kyoto University, Indonesia. https://doi.org/10.14989/doctor.k19347 [ Links ]
QUATTROCHI, D.A., JEDLOVEC, G. & MEYER, P. 2012. Remote sensing of urban land cover/land use change, surface thermal responses, and potential meteorological and climate change impacts. NASA Marshall Space Flight Center, Earth Science Office, Huntsville. [Online]. Available at: <https://ntrs.nasa.gov/archive/nasa/casi.ntrs.nasa.gov/20120003138.pdf> [Accessed: 9 March 2018]. [ Links ]
RAMANATHAN, V. & CARMICHAEL, G. 2008. Global and regional climate changes due to black carbon. Nature Geoscience, 1(4), pp. 221-227. https://doi.org/10.1038/ngeo156 [ Links ]
RAMANATHAN, V. & FENG, Y. 2009. Air pollution, greenhouse gases and climate change: Global and regional perspectives. Atmospheric Environment, 43(1), pp. 37-50. https://doi.org/10.1016/j.atmosenv.2008.09.063 [ Links ]
SHAIK, S., GORANTLA, K. & SETTY, T.P. 2016. Investigations of building walls exposed to periodic heat transfer conditions for green and energy efficient building construction. Procedia Technology, vol. 23, pp. 496-503. https://doi.org/10.1016/j.protcy.2016.03.055 [ Links ]
SKIVINGTON, D. 2012. Urban research methods and spatial analysis: Short report on research methods-case study. [Online]. Available at: <http://deanskivington.wordpress.com/2012/03/19/urban-research-methods-andspatial-analysis/> [Accessed: 10 October 2018]. [ Links ]
SWADES, P. & ZIAUL, S.K. 2017. Detection of land use and land cover change and land surface temperature in English Bazar urban centre. The Egyptian Journal of Remote Sensing and Space Sciences, vol. 20, pp. 125-139. https://doi.org/10.1016/j.ejrs.2016.11.003 [ Links ]
TARAWALLY, M., XU, W., HOU, W. & MUSHORE, T.D. 2018. Comparative analysis of responses of land surface temperature to long-term land use/ cover changes between a coastal and inland city: A case of Freetown and Bo Town in Sierra Leone. Remote Sensing, vol. 10, pp. 112-125. https://doi.org/10.3390/rs10010112 [ Links ]
TERN. 2017. Fractional cover -Landsat, JRSRP algorithm. [Online]. Available at: <http://www.auscover.org.au/datasets/fractional_cover/> [Accessed: 11 January 2018]. [ Links ]
THERMOWORKS. 2019. Emissivity Table. [Online]. Available at: <www.thermoworks.com> [Accessed: 14 January 2019]. [ Links ]
UNITED NATIONS DEPARTMENT OF ECONOMIC AND SOCIAL AFFAIRS POPULATION DYNAMICS. 2018. World Urbanisation Prospects 2018. [Online]. Available at: <https://population.un.org/wup/Download/> [Accessed: 17 November 2020]. [ Links ]
VALENTINI 2011 (Please provide full bibliographical details) [ Links ]
WAHAB, B. & AGBOLA, S.B. 2017. The place of informality and illegality in planning education in Nigeria. Planning Practice and Research, 32(2), pp. 212-225. https://doi.org/10.1080/02697459.2016.1198565 [ Links ]
WAHAB, B. & POPOOLA, A. 2019. Urban farmers' perceptions and adaptation strategies to climate variability in Ibadan, Nigeria. In: Cobbinah, P.B. & Addaney, M. (Eds). The geography of climate change adaptation in urban Africa. Cham: Palgrave Macmillan, pp. 123-154. https://doi.org/10.1007/978-3-030-04873-0_5 [ Links ]
XIONG, Y., HUANG, S., CHEN, F., YE, H., WANG, C. & ZHU, C. 2012. The impacts of rapid urbanization on the thermal environment: A remote sensing study of Guangzhou, South China. Remote Sensing, vol. 4, pp 2033-2056. https://doi.org/10.3390/rs4072033 [ Links ]
XU, H. 2007 Extraction of urban built-up land features from Landsat imagery using a thematic oriented index combination technique. Photogrammetric Engineering and Remote Sensing, 73(12), pp. 1381-1391. https://doi.org/10.14358/PERS.73.12.1381 [ Links ]
YANG, J. 2003. Remote sensing modeling of land surface temperature. Unpublished PhD thesis. College of the Environment and Life Sciences, University of Rhode Island, Kingston, RI, USA. [ Links ]
YUAN, F. & BAUER, M. 2007. Comparison of impervious surface area and normalized difference vegetation index as indicators of surface urban heat island effects in Landsat imagery. Remote Sensing of Environment, vol. 106, pp. 375-386. https://doi.org/10.1016/j.rse.2006.09.003 [ Links ]
ZAHARADDEEN, I., BABA, I. & AYUBA, Z. 2016. Estimation of land surface temperature of Kaduna Metropolis, Nigeria, using Landsat images. Science World Journal, 11(3), pp. 36-42. [ Links ]
Peer reviewed and revised November 2020
Published December 2020
*The authors declared no conflict of interest for this title or article

