


Serviços Personalizados
Artigo
 Inglês (pdf)
 Artigo em XML
 Referências do artigo
Indicadores

Links relacionados
-
 Citado por Google
 -
 Similares em Google
Compartilhar

 Permalink
Town and Regional Planning
versão On-line ISSN 2415-0495
versão impressa ISSN 1012-280X
Town reg. plan. (Online) vol.77 Bloemfontein 2020
http://dx.doi.org/10.18820/2415-0495/trp77i1.1
ARTICLES
Regional resilience in peripheral South Africa: The Northern Cape case
Streeksveerkragtigheid in perifere Suid-Afrika: die Noord-Kaap
Tsitsiso ea tikoloho e meeling ea Afrika Boroa: temohiso ea Napa Leboea
Mariske van AswegenI, *; Francois Pieter RetiefII; Ernst DrewesIII
IUnit for Environmental Science and Management, Private Bag X6001, North-West University, Potchefstroom, South Africa. Phone: +27 72 6266 758/+27 18 299 2543, email: <mariske.vanaswegen@nwu.ac.za>, ORCID: https://orcid.org/0000-0002-3817-2380. * (corresponding author)
IIUnit for Environmental Science and Management, Private Bag X6001, North-West University, Potchefstroom, South Africa. Phone: +27 18 299 2543, email: <francois.retief@nwu.ac.za>
IIIDepartment of Town and Regional Planning, North-West University, Potchefstroom, South Africa. Phone: +27 18 299 2543, email: <ernst.drewes@nwu.ac.za>, ORCID: https://orcid.org/0000-00034094-4922
ABSTRACT
The role of regional policy mechanisms towards increased regional resilience is widely recognised, but limited consideration is given to the impact of these mechanisms in, specifically, the peripheral region. In reaction hereto, this article explores the role of three key mechanisms, i.e. economic sectoral composition, innovation and knowledge networks, as well as government institutions as policy tools towards increased regional resilience in a peripheral region in South Africa. The role of each of these mechanisms is quantified and measured by specified indices such as the GVA, the Tress Index and the ICT Access Index, and government indicators such as audit outcomes and service delivery data in five planning regions of the Northern Cape province. This article highlights that a state of dynamic stability and resilience is more feasible through policy intervention focused on these three mechanisms, coupled with detailed regional socio-economic analysis. It also emphasises that a knowledge-rich region will be less dependent on single sector development, pushing itself into a new development stage of secondary and tertiary sector focus through economic diversification, lessening its vulnerability to external shocks and disturbances, and impeding regional lock-in. In support hereto, collective institutional action by a responsive and accountable local and regional government, operating beyond their functional limits, will reinforce and amplify development in the peripheral region.
Keywords: Economic sectoral structure, innovation and knowledge networks, government institutions, regional resilience, peripheral region, regional development, policy mechanisms, South Africa
OPSOMMING
Die rol van streeksbeleidsmeganismes vir verhoogde streeksveerkragtigheid word wyd erken, maar beperkte oorweging word gewy aan die impak van hierdie mega-nismes in spesifiek die periferiese streek. In reaksie hierop ondersoek hierdie artikel die rol van drie sleutelmeganismes, naamlik ekonomiese sektorale samestelling, innovasie- en kennisnetwerke, sowel as regeringsinstellings as beleidsinstrumente vir verhoogde streeksweerstand in 'n periferiese streek in Suid-Afrika. Die rol van elk van hierdie meganismes word gekwantifiseer en gemeet teen gespesifiseerde indekse soos die GVA, die Tress-indeks en die ICT-toegangsindeks, en regeringsaanwysers soos oudituitkomste en diensleweringsdata in vyf beplan-ningsstreke van die Noord-Kaap provinsie. Hierdie artikel beklemtoon dat 'n toestand van dinamiese stabiliteit en veerkragtigheid meer haalbaar is deur beleidsinmenging gefokus op hierdie drie meganismes, tesame met gedetaill eerde streeksanalise. Die artikel beklemtoon ook dat 'n kennisryke streek minder afhanklik sal wees van 'n enkele sektor deur 'n fokus op ekonomiese diversifikasie. Hierdeur kan 'n streek in 'n nuwe ontwikkelingsfase van sekondêre en tersiêre sektorfokus inbeweeg. Die kwesbaarheid van die streek vir eksterne skokke en versteurings sal verminder en streekuitsluiting word voorkom. Ter ondersteuning hiertoe, sal institu-sionele kollektiewe optrede deur 'n reaktiewe en verantwoordbare plaaslike en streeksregering wat buite hul funk-sionele perke werk, die ontwikkeling van die periferiese streek versterk en kwesbaarheid vir eksterne skokke verminder.
Sleutelwoorde: Beleidsmeganismes, ekonomiese sektorale struktuur, inno-vasie- en kennisnetwerke, periferiese streek, regeringsinstellings, streeks-ontwikkeling, streeksveerkragtigheid, Suid-Afrika
SA BONAHALENG
Boikaraelo ba maano a tikoloho mabapi le kholo ea botsitso ba tikoloho bo ananeloa hohle, empa boinahano holima tsusumetso ea maano ena, haholo-holo, tikolohong e meeling ea naha, e ea fokola. E le ho arabela hona, sengoloa sena se hlahloba mekhoa e meraro ea mantlha, eleng sebopeho sa lekala la moruo, boqapi le marang-rang a tsebo, hammoho le litsi tsa mmuso e le lisebelisoa tsa maano bakeng sa ho eketsa botsitso ba tikoloho meeling ea naha ea Afrika Boroa. Karolo e 'ngoe le e' ngoe ea mekhoa ena e lekantsoe le ho lekanyetsoa ka lits'oants'o tse boletsoeng joalo ka GVA, Tress Index le ICT Access Index, le lits'oants'o tsa mmuso tse kang liphetho tsa tlhahlobo ea libuka le tlhaiso-leseling ea phano ea litsebeletso libakeng tse hlano tsa meralo ea profinse ea Kapa Leboea. Sengoliloeng sena se totobatsa hore ho matlafatsa boemo ba botsitso ba tikoloho ho ka khonahala ka ho sebelisa maano a tsepamisitseng maikutlo mekhoeng ena e meraro, hammoho le tlhaiso-leseling ea moruo oa tikoloho. Se boetse se totobatsa hore sebaka se ruileng tsebo ha sea itsetleha nts'etsopeleng ea lekala le le leng la moruo, empa se ikitlaetsa nts'etsopeleng ea moruo ka makala a 'maloa, mekhahlelong e fapaneng, ele ho fokotsa litsisinyeho le litsitiso tse tsoang kantle. Ho ts'ehetsa sena, khato e nkiloeng ka kopanelo ke mmuso mmoho le mafapha a mang ele ho hatiselletsa boikarabello le ts'ebetso ea puso ea libaka le lebatooa, o tla matlafatsa le ho holisa nts'etsopele tikolohong e mathokong a naha.
1. INTRODUCTION
The relevance of this article lies within the regional study area of the Northern Cape province in South Africa, classified as a peripheral region in a downward transitional spiral (see Figure 3). This study originated from the current economic crisis experienced by the peripheral region of the Northern Cape province, due to various mine closures and retrenchments over the past few years, which can mainly be ascribed to world economic recession and plummeting commodity prices (Department Economic Development and Tourism, Northern Cape, 2017: 3). This crisis is heightened by the continued drought affecting the agricultural sector (AgriSA, 2019). This inevitably infers a twofold issue within this region, i.e. resource dependence and frontier locality within the larger space economy of South Africa (see Figure 4). This implies a region that is currently undergoing stagnation and even decline in its economic base (see section 4), a decline in its resources base, as well as poor or lacking infrastructure (Department Economic Development and Tourism, 2017: 9-11). In order to revitalise this economy, an imminent need for diversification regarding the various economic sectors was identified (Department Economic Development and Tourism, 2017: 3; Northern Cape Government, 2019: 36). As is the case of many peripheral regions, this decline has led to a shrinking population and ever-dwindling income for the local inhabitants (Harrison & Todes, 2013: 18; Northern Cape Government, 2019: 76-79). This region could potentially benefit greatly from a regional resilience strategy, to ensure that the region will be able to rebound, adapt to, and recover from future setbacks. At present, no such strategy or policy exists.

This article, therefore, proposes an integrated developmental policy approach towards a more resilient Northern Cape province. The proposals are based on three mechanisms of regional resilience, i.e. sectoral composition, innovation and knowledge networks, as well as government institutions. To develop a strategy or policy for more resilient planning regions in the Northern Cape province, this article measures the impact of each of the identified mechanisms of resilience within the study area by means of specified indices and indicators. Based on the measurement outcome, recommendations are formulated on how the five planning regions (PRs) can utilise regional policy to unlock their potential in the peripheral regions that are currently not flourishing.
2. CONCEPTUAL FRAMEWORK
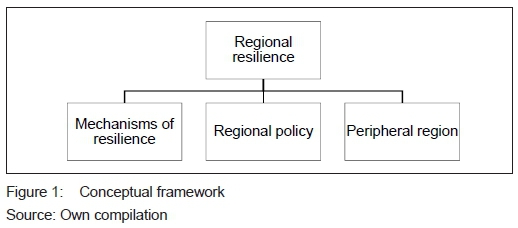
To understand how strategy and policy can be used to unlock regional resilience in peripheral South Africa, it is important to introduce the current theory on regional resilience included in this article. The existing theory focuses on the concepts of regional resilience, regional policy, the peripheral region, and mechanisms associated with regional resilience. The conceptual framework focuses on an unexplored theme of regional policy specifically designed for peripheral regions (see Figure 1).
2.1 Resilience on regional level
During the maturing of the regional resilience concept, various studies have been conducted and resilience on a regional level approached from various angles. The most recognised is the 'evolutionary approach' to regional resilience (Christopherson, Mitchie & Tyler, 2010: 8; Pike, Dawley & Tomaney, 2010: 4; Boschma, 2015: 744). This approach advocates that both adaptation (variations within predetermined paths) and adaptability (departing or altering from the present path) are essential for the region to react in a resilient manner (Christopherson et al., 2010: 6; Pike et al., 2010: 4; Bristow & Healy, 2014: 94) and to surmount negative lock-in (Boschma & Lambooy, 1999). Regional lock-in refers to the negative effects of geographical clustering of industries on innovativeness and renewal (Hassink, 2010: 452). For instance, a region can become too dependent on its initial core economic sector, i.e. primary sector, which renders such a region too focused on a single economic sector (Grabher, 1993: 261; Saviotti & Frenken, 2008: 208). Various types of lock-in are identified, i.e. functional, political, and cognitive. They describe a region that becomes reliant on previous growth paths, due to ossification of institutional outlooks, relationships, and configurations, which inhibit adaptability (Grabher, 1993: 260-264; Hasssink, 2010: 452; Crespo, Suire & Vicente, 2014: 6). Lock-ins are often found to overlap and are self-reinforcing, causing the region to be more vulnerable to shocks and slow-burn processes. Majoor (2015: 261) notes that, if the focus is primarily on adaptation, there is a risk of a 'performance trap' or even eventual stagnation, due to inflexibility and lack of innovation. A predominant emphasis on adaptability, in turn, could lead to a 'failure trap', due to a multitude of underdeveloped ideas and slow (or no) progress (Simsek, Heavey, Veiga & Souder, 2009: 867). Martin and Sunley (2006: 121-123) identify various 'de-locking' mechanisms to provide a basis to move towards a state of stability between adaptation and adaptability. This includes, for example, diversification of the economic structure, arranging technological advances, introducing and entrenching external resources, and generating innovation. This suggests that regions can enhance their adaptability if strategies and policies are in place to prevent lock-in and enhance the region's ability to absorb these shocks. A resilient system allows for continuous growth on an existing path (adaptation) and a simultaneous shifting (transformation) of other components to adjust the growth path into a new direction, in order to ensure future resistance to shocks (De Weijer, 2013; Turok, 2014). This 'dynamic stability' is regarded as a key to empower a system to be in a more defensible and viable position against shocks (Grabher, 1993; Grabher & Stark, 1997; Miller, Osbahr, Boyd, Thomalla, Bharwani, Ziervogel, Walker, Birkmann, Van der Leeuw, Rockstrom, Hinkel, Downing, Folke & Nelson, 2010; Pike et al., 2010). Clegg, Da Cunha and Cunha (2002: 486) are of the opinion that resilient aptitude is found in practices that recognise the relationship between these contrasts and deal with this contradiction without substituting or diminishing the tensions, or "operating at the edge of chaos" (Pascale, 1999: 92).
2.2 Resilience mechanisms
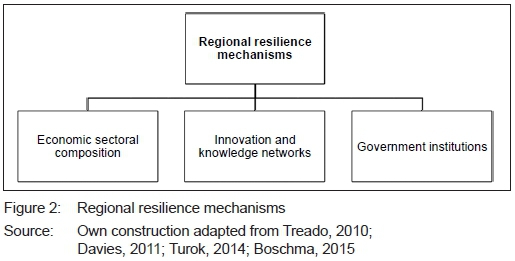
From the literature, it is evident that regional resilience is embodied, first, in the history of the economic (and industrial) sectoral composition and growth of a region (Glaeser, 2005: 151; Davies, 2011; Boschma, 2015: 736); secondly, in the dynamic interactions along networks (physical or abstract) within the region (Lawson, 1999: 162; Boschma & Frenken, 2010: 124; Crespo et al., 2014:6), and in the institutions found, and their reactions to change (Dawley, 2014: 99; Majoor, 2015: 264; Boschma, 2015: 736). Turok (2014: 753) supports this with the observation that all countries in the world have similar urban agendas, based on the three dimensions of change, i.e. economic progress, spatial integration, and responsive government. The dimensions of change directly correspond to the types of lock-in experienced by regions and could be regarded as an approach to prevent lock-in or stagnation (see section 2.1). Figure 2 indicates the mechanisms of regional resilience, as emanated from literature and proposed as crucial and pivotal to the regional resilience concept.
Each of these mechanisms is introduced based on the premise of balancing adaptation and adaptability within the evolutionary regional resilience as the shock absorbers (Boschma, 2015: 736) that counteract the potential negative impacts on a region.
2.2.1 Economic sectoral composition
The role of the economic sectoral composition of a region has been extensively emphasised in literature on resilience, with a strong focus on the negative impact of external shocks to a specific sector, for instance a fall in demand (Davies, 2011; Groot, Mohlmann, Garretsen & De Groot, 2011). Consequently, it is perceived that regions with a higher rate of specialisation are less vulnerable to a sector-specific shock. If, however, a shock strikes the dominant sector, the impact will be greater on the regional economy. Specialised regions are accordingly regarded as having high levels of adaptation, but low levels of adaptability (Grabher, 1993: 265; Neffke, Henning & Boschma, 2011: 240). In more diversified regions, the chances of experiencing a sector-specific shock are higher, but a shock to a single sector will have less damaging impact than in the sole-sector economy (Dissart, 2003: 442; Essletzbichler, 2007: 205; Davies & Tonts, 2010: 224; Desrochers & Leppala, 2011: 846). Literature highlights that related variety could potentially lead to a more acceptable level of balance between adaptation and adaptability, and ultimately ensure long-term capacity of a region to timeously push itself onto a new growth path (Glaeser, 2005: 151; Frenken, Van Oort & Verburg, 2007: 695; Belussi & Sedita, 2009: 509; Treado, 2010: 108; Neffke et al., 2011: 240). A region with high levels of related variety is regardedas one withawide range of related industries, which shows potential for inter-industry learning and allows for a recombination of industries to follow a new growth path (Martin & Sunley, 2006: 593; Frenken et al. 2007: 688; Pike et al., 2010: 5). Accordingly, related variety will not only guarantee adaptation, but also enhance adaptability.
2.2.2 Innovation and knowledge networks
The role of innovation and knowledge networks in regional resilience is introduced on the premises that it influences the sensitivity of regions to shocks, as there is a constant conflict between connectedness and resilience (Simmie & Martin, 2010: 33). Knowledge networks or relationships are viewed as the interactions that lead to knowledge gain or exchange between local role players and those outside the region (Lawson, 1999: 162). Adaptation in the case of knowledge networks is high when the local network structures are well developed and focused on the local region's needs. Well-developed and inward-looking network structures are observed to enhance information flow and better coordination (Crespo et al., 2014: 205). This could, however, lead to low adaptability as excessive 'cognitive proximity', and a closed mindset makes renewal almost impossible (Grabher, 1993: 271; Boschma & Frenken, 2010: 124). Fleming, Mingo and Chen (2007: 446) propose that this sensitive balance between adaptation and adaptability can be overcome by a 'knowledge network structure', similar to the core-periphery structure (Friedmann, 1966: 36). The core is found within the presence of higher education, post-school education, training centres, and so on within close proximity to one another. He argues, and is supported by Balland, Suire and Vicente (2013: 61), that the strong core of the innovation network structure will lead to intensification of new ideas and increase adaptability. This intensification of ideas will spread through the network structure to the periphery by means of knowledge transfer. The periphery in the network structure will be responsible for the coordination and circulation of ideas and knowledge. This will prevent full regional lock-out, due to high levels of connections between the core and the periphery, while diffusion of explorative behaviour will be more prevalent, due to the ability of key nodes to enhance the existing circulation of ideas (Crespo et al., 2014: 12).
2.2.3 Government institutions
The role of government institutions in regional resilience has received significant attention in the evolutionary approach to resilience. It is acknowledged that institutions are closely intertwined with the economic structure of the region and the accompanying knowledge networks. The institutional structure within a region is also subject to various shocks (i.e. social capital expenditure, economic policy influence), which will directly impact on a region's ability to develop and follow a new growth path (Dawley, 2014: 99; Boschma, 2015: 736). The institutional capacity and prowess within a region can greatly influence how the region's resources are allocated, how the region reacts to shocks, and how open-minded the region is to exogenous interaction and technological innovation. Institutions are largely linked to managing the trade-off between adaptability and adaptation (Boschma, 2015: 741). Therefore, the institutions involved should be equipped to cope with these paradoxical tensions (Majoor, 2015: 264). Accordingly, the role of institutions in regional resilience can be divided into three subgroups, i.e. institutional leadership; institutional arrangement, and institutional adaptive capacity. It is evident that a combination of strong institutional leadership and polycentric and multi-layered institutions ultimately relates to enhanced institutional resilience (Stimson, Stough & Roberts, 2009: 34; Pike et al., 2010: 10, Boschma, 2015: 742).
2.3 Regional policy approach
Regional policy, in context, is defined as an attempt to induce a more effective spatial pattern through restructuring and modernising the productive base of an economy, all while being conscious and careful to fit in with national goals for growth and development (Friedmann, 1966: 18), employment, and social equity. It aims to either slow down certain negative aspects of growth and development to promote more balanced development across a region, or is strongly focused on furthering the mobility of capital and the mobility of labour (Kuklinksi, 1970: 272). More recently, it is supported by an aim of regional competitiveness (Capello, 2007: 205; Feiock, 2007: 363; OECD, 2010). Regional policy is more pronounced in developing countries, with a strong emphasis on the geographical or spatial impact it will have (Johnson, Gregory & Smith, 1986; Armstrong & Taylor, 2000). Internationally, regional policy has shifted from a short-term, single region approach, to a long-term context-specific approach, which no longer has a broad approach implemented by central government (OECD, 2010: 13). It recognises that a more sector-specific and area-specific approach renders better results when implemented in a multi-level and mixed investment manner, such as the proposals made in section 6. Instruments of regional policy aim to discourage and smooth out any frictions that may have been caused, due to uneven resource allocation, regional disequilibrium and underdevelopment, such as is the case in the Northern Cape (see section 5). Instruments associated with the various goals of regional policy differ for the level on which policy is designed for, i.e. interregional or intra-regional (Kuklinski, 1970: 270). For instance, short-term economic growth can be stimulated by allocating investment in stronger core regions, which will yield quick results. But, for longer term growth, it will be necessary to focus on breaking barriers (Lall, 2011:53) on spatial integration on an interregional scale.
Four main types of policy actions can be essentially recognised (Richardson, 1983: 276), i.e. laissez-faire approach; slowing down primate city growth; policy focused on small and intermediate towns, and rural development policy. These policy actions can be used complementarily, each with its own focus. The policy options of rural development and slowing down primate city growth remain the main focus for a more spatially balanced region (Drewes, 2009: 63). Two typical instruments for the implementation of these approaches in developing countries (Glasson & Marshall, 2007: 1516) include growth centres and corridor development, or a hybrid approach. First, the growth centre approach stems from the classical growth-pole theory of Perroux; it focuses efforts on the centres of potential within a region, in an attempt to generate economic spillover benefits and innovation diffusion to the surrounding region (Hansen, Higgins & Savoie, 1990: 285). The growth centres are made practical through establishing countermagnets (Richardson, 1983: 283), intermediate-sized cities (Richardson, 1981: 275), capital city focus (Richardson, 1981), and local economic development initiatives (Birch, 1996: 442).
Corridor development aims to connect centres within a region with one another. It is argued that two growth centres will continue to mutually reinforce one another if connected through a development axis (Richardson, 1987: 217). The interaction along the identified corridor has the potential to further develop and stimulate economic activity along decentralised corridors (Hall, 1987: 245). In prioritising the connection between a core region and the adjacent intermediate-sized towns/cities, a more functional and reinforcing hierarchical system is created (Bos, 1990: 191). The four main types of policy actions are also often utilised in conjunction with one another to fortify the effectiveness of the instruments. The practical application of the instruments is found within the following key elements, namely investment in social and physical infrastructure (Maggi & Nijkamp, 1992: 29; Andrew & Feiock, 2010: 498); grants, loans and tax incentives in support of sectoral development (Krugman, 1991; Hall, Hall & Pfeiffer, 2000: 150; European Commission, 2020), and restrictions on certain economic sectors (Hall, 1975 126), as well as sites of strategic investment through zones of regeneration, innovation hubs, and science and technology parks (Lall, 2011: 46).
2.4 Peripheral region
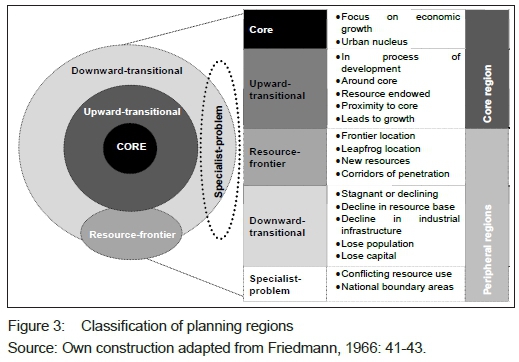
The peripheral region is classified as a subtype of planning region (Friedmann, 1966: 41; Kuklinski, 1970: 272; Stilwell, 1972), which Glasson (1978: 22) describes as "geographical regions suitable for the designing and implementing of development plans for dealing with the regional problems". The peripheral region is, in turn, comprised of the resource-frontier region, the downward-transitional region, and the specialist problem region (UN, 1967: 281). A second group of planning regions is referred to as the "core region" of a given national space and includes a core and an upward-transitional subgrouping (see Figure 3).
Figure 3 highlights the typical c aracteristics associated with the peripheral region in general.
In terms of the resilience concept (see section 2.1), it can be deduced that the typical peripheral region is associated with poor resilience. The economic growth and development in these regions are often found to be stagnant or declining, and this could be ascribed to a dependence on a declining natural resources base and poor infrastructure. These regions are also associated with outmigration and a general brain-drain of the working population, clearly visible in the Northern Cape (see section 3) and associated to regional lock-in.
The National Government (Department Planning, Monitoring and Evaluation, 2017) classified the South African municipalities into five types of regions based on their economic centrality (see Figure 4). Accordingly, the inner core areas refer to the urban agglomerations focused around metropolitan centres and secondary cities and, in some instances, refer to a cluster of medium-sized economic nodes forming a large urban centre. The outer core refers to large towns with strong service functions; medium-sized mining economies; areas of high population density in close proximity to urban core areas; most of the former homeland1 areas, and large, dense population clusters around former homeland capitals.
The periphery of South Africa is classified into the semi-periphery, the periphery, and the deep periphery. South Africa's semi-periphery has been defined in terms of three categories of settlements, i.e. municipalities centred around medium-sized towns with an established service function (annual GVA of roughly R1 billion to R2 billion a year); municipalities that fall mainly in former Bantustan areas (GVA over R1 billion per annum), and secondary mining outlier towns. In the semi-periphery, modest economic growth is prevalent (2.36% per annum) and population growth is slow (0.94% per annum) (Department Planning, Monitoring and Evaluation, 2014: 23). The peripheral municipalities refer to those focused around small service centres (annual GVA of roughly R0.4 billion to R1 billion); former Bantustan economies with a similar size of economy and with generally moderate population densities, and small mining economies (Department Planning, Monitoring and Evaluation, 2014: 23). The periphery is further characterised by slow economic growth (1.63% per annum) and a very slow annual population growth rate (0.69%). The deep periphery comprises very marginal municipal economies growing at roughly 1.9% per annum and population change of 0.64% per annum, with the natural population increase barely compensating for outmigration (Department Planning, Monitoring and Evaluation, 2014: 24). Municipalities in the deep periphery fall into two categories: municipalities centred around very small and generally scattered service centres, with GVA of less than R0.4 billion, and marginal municipalities in former Bantustans, with generally low population densities and GVA of less than R0.4 billion (Department Planning, Monitoring and Evaluation, 2014: 24). The poor performance of these areas is mainly ascribed to the depressed agricultural economy and the negative impact of declining population on the service centres (Harrison & Todes, 2013: 23; Department Planning, Monitoring and Evaluation, 2017) associated with poor resilience.
3. STUDY AREA
The Northern Cape province consists of Ave District Municipalities and 27 Local Municipalities (see Figure 4). The Northern Cape province extends over 30.5% of the total land surface of South Africa, bordering both Namibia and Botswana, rendering this a strategic province for cross-border interaction and -policy application. The province is considered a rural province, made up of smaller urban- and service-type settlements. The total population of the province is 1,175,780, at a density of 3.2 persons per km2, in relation to an average density of 45 persons per km2 in South Africa (Demarcation Board, 2019). It is recognised that especially the smaller settlements in the Northern Cape have undergone a myriad of changes, due to the impact of an ever-changing global economy, especially due to the province's main dependence on the manufacturing, agricultural and mining sectors (Nel, 2005; Department Economic Development and Tourism, Northern Cape, 2017; Northern Cape Government, 2019). The primary sector in the Northern Cape accounts for 64.5% of the economy. The collapse of once prosperous mining settlements, the decline in agricultural output, the displacement of the roles of smaller service centres, due to advances in transport infrastructure, the dependence on state welfare, and the loss of local government status, resulting from various amalgamations, are put forward as some of the main issues facing the province (Northern Cape Government, 2019). These characteristics are associated with poor resilience. The Northern Cape Provincial Spatial Development Framework2 (Northern Cape Government, 2019) recognises poverty as the most significant issue facing the province, accompanied by the various societal challenges, due to the effects thereof. The region exhibits long travelling distances and remote localities, due to the focus on natural resources, resulting in a dependence on infrastructure for export purposes and reaching national and international markets.
Although the region is characterised as both rural and peripheral, it is constitutionally obliged to have a capital city as one of nine South African provinces. In terms of the spatial context, the various spheres of growth centres, as defined in the Draft National Spatial Development Framework (Department of Rural Development and Land Reform, 2018) applicable to the Northern Cape, include a single urban region focused around Kimberley in PR3, and five regional growth centres (see Figure 5). Kimberley is located on the region's eastern border and, in general, represents the only non-rural/peripheral area in the study area and is classified as part of the urban core. This region supports the national network of urban core regions and provides a link to national and international competitive advantages. Other regional growth centres as identified refer to areas/towns of significance in terms of scale, location, impact, diversity and agglomeration of function, which have a significant impact on the Northern Cape as a whole. These include:

a. Upington (including the subregions of Kakamas, Keimoes and Groblershoop) falls within PR1.
b. Springbok (including the subregions of Steinkopf, Okiep and smaller settlements within close proximity) and Calivinia within PR5.
c. Kuruman (including the sub-growth centres of Kathu and Olifantsfontein) within PR2.
d. De Aar in PR4.
4. RESEARCH METHODOLOGY
This study measures the impact of three mechanisms of regional resilience in the peripheral region in the Northern Cape province of South Africa. The study uses the pragmatic paradigm focused on the mixed methods research approach, in which qualitative and quantitative data are collected in parallel, analysed separately, and then merged (Creswell, 2014). It is important to realise that qualitative and quantitative approaches should not be viewed as opposites, but that they represent different ends of a continuum, i.e. a study tends to be more qualitative than quantitative, or vice versa (Du Toit, 2015: 65).
As a research paradigm, pragmatism orients itself toward solving practical problems in the real world (Shannon Baker, 2016: 325). It also allows for descriptive analysis (Naoum, 2013: 104). In this study, service delivery and municipal audit records were used to build the theory on regional resilience, predicting that a regional resilience strategy or policy can be used to unlock regional resilience in peripheral South Africa. Socio-economic indices were used to measure the comparative advantage and level of information communication technology access of a planning region. The reason for collecting both quantitative and qualitative data is to elaborate on specific findings from the breakdown of the service delivery and municipal audit records, such as similar indicators showing the lack of regional resilience from the socio-economic indices (Creswell & Plano-Clark, 2007).
4.1 Data collection
Data on the resilience mechanism, 'sectoral composition', was measured in terms of three internationally recognised indices, i.e. GVA (regional output by main industry), Tress Index, and Comparative Advantage (CA) (Wagner, 2000; Dissart, 2003). The primary source of GVA3 data on the regional level is the sectoral surveys conducted periodically by Statistics South Africa (2018), from which the data for the 5 PRs were collected.
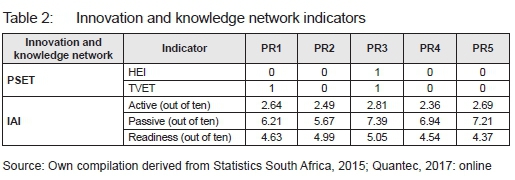
Data on the 'innovation and knowledge network' mechanism was measured by two main indicators (Godin, 2003: 673; Wagner & Leydesdorff, 2005, i.e. post-school education and training (PSET) and information communication technology (ICT) access by means of the ICT Access Index (IAI).4 Data collected for all these indicators are from the General Household Survey (GHS) and Census data collected and processed by Statistics South Africa (2015: 69). For the year in question, a total of 25,363 households formed part of the survey based on various selection criteria (Statistics South Africa, 2015) commonly utilised by Statistics South Africa since 2002 for this particular annual survey.5
The measurement of the 'institutional component' of the five PRs is informed by the annual national general audit outcome (Auditor General, 2019), as well as basic service delivery data (Van Aswegen, 2018; Demarcation Board, 2019) as indicators of institutional capacity (see section 2.1). Data collected includes general municipal audit outcomes for the five PRs; the progress made in terms of basic service provision; the presence and types of root causes for poor audit performance in each PR, and the level of assurance across seven levels of institutional role players.
The study area reflects on three types of peripheral regions (semi-periphery, periphery, and deep periphery), with a specific focus on the five district municipalities (Category C) of the Northern Cape as the most prominent peripheral region (see Figure 4). For purposes of this article, the five planning regions (PR1-PR5) correlate with the formally demarcated subregional authority (district municipality). Access to comparable quantitative data becomes challenging beyond the confines of the municipal demarcation, thus the use of district municipalities as 'planning regions'. This analysis mainly makes use of Standardised Regional Metadata, EasyData (Quantec, 2019). The data sets relate to an annual time series projected for the period 1995-2019, for 278 municipalities/ward-based regions (2011 demarcation). The data sets have been projected using various sources6 of statistical information.
4.2 Data analysis and interpretation of findings
To analyse the five planning regions (PR1-PR5) in terms of their regional resilience, descriptive statistics was used to generate and report the frequency and percentages of various resilience measurement outcomes within the three resilience mechanisms.
For the resilience mechanism 'sectoral composition', the GVA was calculated based on the internationally used formula to determine GVA, that is GVA=GDP+SP-TP, where SP represents subsidies on products, and TP represents taxes on products.
To determine the tress rating of each PR, each economic sector's contribution (as percentage) to the GGP is calculated and subsequently ranked according to contribution. The sector with the highest contribution received the highest ranking, in this instance 22 for the 22 sectors measured. A weighted value is calculated for each sector by multiplying the percentage contribution with the ranking received. The sum total of the weighted values of the sectors is calculated. To obtain an index value (0 to 100), subtract x from the total and divide by y. Where x is the lowest potential total weighted value and y is the difference between the highest and lowest potential total weighted values by 100 (DBSA, 2001: 38). An increase in the Tress Index of a region reflects an increase in the dependence of the local economy on a single or a few economic activities and is an ostensibly negative trend (DBSA, 2001: 25). To generate the comparative advantage (CA) of each PR, the percentage contribution of a sector to GGP in a specific economy is divided by the percentage contribution of the same sector to the aggregate economy. The CA of a region indicates relatively more competitive production function for a product or services in that specific economy than in the aggregate (be it provincial or national) economy. The CA indicator is utilised to determine and investigate each PR's sectoral strengths and weaknesses in relation to the economy at large, in this instance the provincial level and the national level (DBSA, 2001: 26).
Data analysis for the 'innovation and knowledge network' resilience mechanism used the IAI that combines 12 access indicators into a single benchmark measure, grouped in three sub-indices, i.e. active, passive, and readiness (Statistics South Africa, 2015: 68). The active sub-index measures the level of households' access (as a percentage value) to relatively technologically advanced ICT assets (telephone, internet, and computers). The passive sub-index measures the level of households' access to basic broadcasting services (television and radio) and mail (as a percentage value). The readiness sub-index measures households' relative skill levels and the ability and access to utilise ICT (literacy, education as a percentage value). The active sub-index attributes to 65%, the passive sub-index to 20%, and the readiness index to 15% of the IAI (Statistics South Africa, 2015: 70). The sub-index value was calculated by taking the simple sum (using equal weights) of the indicator values. The final index value was then computed by summing the weighted sub-indices (Statistics South Africa, 2015: 70). The IAI is further supported by data on the attainment of post-school education and training (PSET), which plays a substantial role in the extent and quality of the knowledge network system, as well as the region's ability to attract and attain knowledge. PSET data was obtained from the Northern Cape Department of Education (2018 10-37).
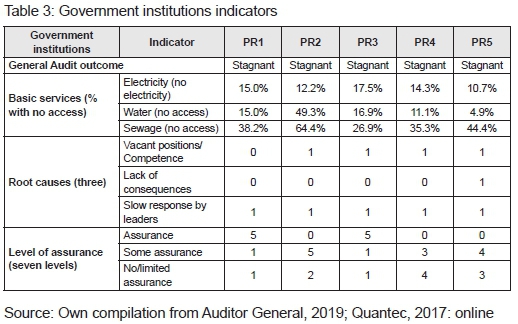
Data analysis of the 'institutional component' of the five PRs used the indicator 'general audit outcome' that was derived from the Annual Audit Report for municipalities across South Africa, which indicates a municipality as improved, stagnant or regressed from the previous year's outcome within a 5% range of change. This is based on the Auditor General's audit in six key areas, namely supply chain management; quality of performance reports; quality of financial statements; information technology controls; financial health, and resource management. The second indicator regarding service delivery indicates the percentage of households with no access to the three types of basic services (water, electricity, and sewage) based on secondary data (Demarcation Board, 2019). Thirdly, the 'root causes' indicator is represented as a binary notation of "0" or "1". The notation "1" is indicative of the presence of the specific root cause for poor audit performance, and "0" indicates that the root cause is not present in the specific PR. The Auditor General identifies these three root causes as the main contributors to poor economic and administrative performance across all 278 municipalities in South Africa (Auditor General, 2019: 5). The three root causes have been identified as key positions vacant or key officials lacking appropriate competencies; lack of consequences for poor performance and transgressions, and slow response by political leadership in addressing poor audit outcomes. The final indicator is also derived from the Auditor General's Annual Report and represents the 'level of assurance'7 provided by the identified role players within each municipality. The accountability of local government for their actions, performance, financial management, and compliance with legislation serves as a cornerstone of democratic governance in South Africa (Auditor General, 2019: 115) and is measured by means of this indicator. Various role players in the public sector contribute to the credibility of financial and performance information and compliance with legislation, by ensuring that adequate internal controls are implemented at auditees. The seven role players recorded are those directly involved with the management of the municipality (management/leadership assurance); those who perform an oversight/ governance function, either as an internal governance function or as an external monitoring function (internal independent assurance and oversight), and the independent assurance providers who provide an objective assessment of the municipality's reporting (external independent assurance and oversight). The role players include senior management; municipal manager; mayor; audit committee; internal audit committee; municipal council, and municipal public accounts committee. The level of assurance provided by the seven role players was assessed, based on the status of internal controls of municipalities and the impact of the different role players on the controls, and is indicated as a municipality providing assurance; some assurance, and no assurance, as a numerical value out of 7 (see Table 3).
An integrated analysis of the above will, in turn, be translated into policy instruments to strengthen growth potential, with an emphasis on balancing the three mechanisms of regional resilience. It is envisaged that this analysis could practically inform local spatial strategies (Local Economic Development and Spatial Development Frameworks), provincial planning policies (Provincial Growth and Development Strategy and Provincial Spatial Development Framework), and national budget allocation (Industrial Development Zones and Special Economic Zones) through regional policy instruments (see section 2.3).
4.3 Limitations
A macro policy design response, based on the characteristics of the regions in terms of resilience indicators, was proposed. A detailed policy response can be similarly deduced for each planning region and for the province as a whole -this is not the aim of this article.
5. FINDINGS AND DISCUSSION
The study area reflects the three peripheral regions, as illustrated in Figure 3, i.e. semi-periphery, periphery, and deep periphery.
Figure 4 illustrates that PR4 is by far the most peripheral of the five regions, with five of its eight municipalities classified as 'deep periphery'. PR1 has an even distribution of four of the five types of regions, whereas PR3 illustrates extremes of two 'inner core' municipalities, and two 'deep periphery' classified municipalities. PR2, PR4 and PR5 do not exhibit any form of core municipal areas.
5.1 Economic sectoral composition
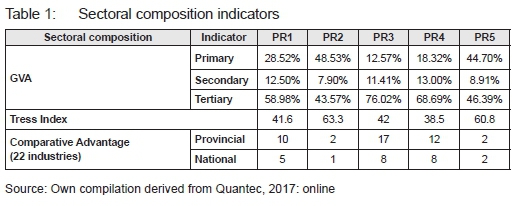
The economic sectoral composition and regional dependence on the three main sectors has been established as pivotal to regional dynamics, regional resilience, and regional policy approaches (see section 2.2). Table 1 indicates that the sectoral composition of PR1, PR3 and PR4 shows less dependence on the primary sector, ranging between 13% and 29%. PR2 and PR5 have a very high dependence on the primary sector as largest contributor to the regional GVA at 49% and 45%, as measured by GVA. As highlighted in the literature, such a strong dependence on a single sector will have a negative impact on the resilience of a region.
The increase of the Tress Index of a region reflects an increase in the dependence of the local economy on a single or a few economic activities. It can be inferred that the closer the PR's economies are to 100, the less resilient they are to economic sector-specific shocks. From the analysis, the lack of diversification in all five PRs is clearly visible, especially PR5 and PR2 with visible single-sector domination, rendering these more vulnerable to sector-specific shocks. PR4 shows higher levels of economic diversification. The CA indicator (Table 1) illustrates that, on a provincial level, PR3 has the highest number of industries (17 out of a possible 22), in which it has an advantage, followed by PR2 (12) and PR1 (10). On a national level, it is highlighted that PR3 and PR4 show significant advantage in eight industries each, followed by PR1 with five industries of comparative advantage. The identification of sectors of competitive advantage will assist in policy recommendations to reinforce those industries showing economic promise and potential as growth centres.
5.2 Innovation and knowledge network
The extent of the innovation and knowledge network within the peripheral region has proved to be pivotal in the overall resilience of such region (see section 2). In terms of the post-school education indicator, PR3 is the only PR with both a Higher Education Institute (HEI) and Technical and Vocational Education and Training (TVET), with PR1 having the only other TVET. The IAI scores provided in Table 2 illustrate a composite weighted score for the sub-indices (active, passive, and readiness), to determine the relative contribution (out of a possible ten) of each of the sub-indices to the total score. All five PRs show similar low levels of active access (thus low levels of adaptation) varying between 2.36 and 2.69, whereas PR3 and PR5 have remarkably more focus on the passive access indicators (post, radio, television). The focus of the results is specifically on the 'readiness' sub-index as indicative of potential rapid absorption of new technology and initiatives towards enhanced resilience. This IAI provides a basis for policymaking to focus on maximising the opportunities in ICT in the study area. PR3 is highlighted as the PR with the highest readiness-index composition (mid to high levels of adaptability), which could be interpreted as an opportune region for intervention in terms of policy focused on heightened innovation.
5.3 Government institutions
Government institutions are pertinent throughout the research. Leadership within the institutional milieu has been highlighted as one of the main impacting factors, as well as institutional arrangement, the adaptive capacity of government, their responsiveness to demand, and cautious spending of budgets.8 In Table 3, all five of the PRs forming part of the analysis are classified as stagnant or showing too little progress in terms of the annual general audit (Auditor General, 2019). This overall regression confirms the message of poor accountability and poor leadership by mayors, municipal managers, and senior managers (Auditor General, 2019) as assurance providers. The percentage of households within each PR with no access to basic services is highlighted in the 3rdrow. PR2 has the highest aggregate lack of services (47%), followed by PR1 (25%), PR3 (24%), PR4 (22%) and PR5 (21%). The South African average pertaining to the lack of services is calculated at 40%, which indicates that only PR2 is worse off than the national average.
As highlighted in section 2.3, the delivery of infrastructure and social services is considered an instrument of regional policy that could assist in increasing institutional resilience. In an attempt to identify the issues within each PR relating to institutional accountability, the presence of a specific root cause within the PR is illustrated as a binary notation of "1", or "0", if the specific cause for concern is not present. PR1 is the only PR indicated as having progressed in terms of this indicator and only one root cause concern to be addressed, being the slow response by leaders.
PR5 is indicated as demonstrating all three of the root causes of poor audit outcomes, thus needing immediate intervention. PR2 and PR3 show instability of vacancies in key positions, as well as slow response in improving internal controls as main causes for the lack of performance. PR4 has vacant positions and a lack of consequences to blame for its poor operation. This highlights areas for potential policy intervention to increase the institutional capacity of the various PRs. The 'levels of assurance' indicator refers to the assurance put in each role player to effectively address the causes identified within the audit report (see section 4.2). Within each PR, seven role players are identified as responsible entities, i.e. senior management, municipal manager, mayor, internal auditor, audit committee, municipal council, and municipal public accounts committee. Within PR1 and PR3, five role players in each were observed as providing assurance to be able to address the six key areas of concern identified by the Auditor General (see section 4.2) within the PR. PR4 and PR5 both exhibit poor levels of assurance, with three levels of actors not providing assurance to the public. PR2 did not fare well, with only five levels providing some assurance, and two levels not providing any assurance. This highlights a need to establish more effective, responsible and accountable actors within the institutional environment, as well as the exact level of governance, in this instance the Municipal Council and the Municipal Public Accounts Committee, where intervention is most urgently needed.
Based on the findings, PR1 is acknowledged as the most stable and resilient of the five PRs. It has been established to have comparative advantage in ten provincial and five national economic sectors and is the PR with the highest institutional assurance levels on five of the seven levels of institutional role players. One of two PSET institutions is found within PR1, which provides a basis to strengthen the innovation and knowledge network mechanism. PR1 is mostly dependent on the tertiary sector (59.98%), which is not as vulnerable to economic shocks and fluctuating commodity prices. Basic service provision is overall acceptable, but the provision of sewage services needs attention.
PR2 is highlighted as the only PR experiencing an economic downturn during the economic recession, which was ascribed to the high dependence on the primary sector
(63.3 Tress). This renders the region more vulnerable to external shocks in terms of primary sector dependence. The region exhibits limited comparative advantage and an overall stagnant institutional environment, with only some assurance in most of the institutional role players. Relative low levels of active ICT access are visible, supported by high levels of readiness for innovation. PR2 exhibits the worst levels of non-compliance in both water and sewage services.
Within PR3, a strong dependence on the tertiary sector is highlighted, and the sectoral composition exhibits strong national (eight industries) and provincial (17 industries) comparative advantage. The innovation indicators are the highest of the PRs, but a very large passive access is visible, which inhibits knowledge gain and transfer.
Within PR4, a similar national comparative advantage in eight industries is experienced as in PR3 and 12 industries on provincial level. PR3 exhibits mostly large passive access to technology, and low levels of active access. The readiness indicator is, however, high and provides the opportunity to focus on strengthening the innovation and knowledge network mechanisms, especially since two PSET institutions are present in this PR. PR3 also illustrates higher levels of assurance in most of the institutional role players.
PR4 exhibits national comparative advantage in eight industries, as well as 12 industries on the provincial level. This PR has a Tress Index of 38.5, with a strong focus on the tertiary sector. PR4 is highlighted as the best-faring in terms of basic service delivery. PR4 exhibits a worrying level of zero assurance (four out of seven) in the government institutions and exhibits two out of three of the root cause concerns identified for poor performance. The root cause concerns include vacant key positions as well as slow response by leaders within the PR. Similar levels of access to ICT are observed in PR4, with the overwhelming focus on passive access to ICT.
PR5 illustrates a very high dependence on the primary and tertiary sectors with a Tress Index of 60.8. Similar to PR2, very few industries illustrate an economic comparative advantage. PR5 exhibits all three root cause concerns as identified by the Auditor General and three of the institutional role players provide no assurance. In terms of basic service provision, the lack of sewage infrastructure is highlighted as concerning. Similar to the other PRs, the levels of active access to ICT are low, and PR5 exhibits the lowest level of readiness towards enhanced access.
6. POLICY PROPOSALS
Based on the conceptual framework and findings in Tables 1 to 3, a practical approach is proposed that includes broad policy and detailed strategic instruments, focusing on de-locking each PR into an inclusive more resilient peripheral region.
Policy instruments to prevent further regional lock-in (see section 2) are crucial to the success of these instruments to develop and adjust policy in an innovative manner to localised needs and unique challenges. It is proposed that the resilience mechanisms of peripheral regions, in general, be measured to first determine the most vulnerable resilience mechanism. In focusing attention on the weakest mechanism, the entire region's strength and robustness will be enhanced and become more balanced (Van Aswegen, 2018). The stability of all three mechanisms-is key to enhanced resilience. The main policy proposals regarding the three resilience mechanisms are informed by the contents of the conceptual framework (see section 2) and adapted to fit with the findings of the study area analysis (see section 5), and illustrated in Figure 6.
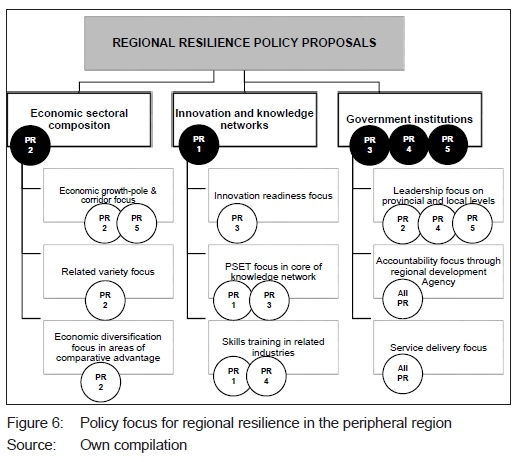
In terms of economic sectoral composition, it is proposed that peripheral regions focus on the identification of industries emphasising the region's specific competitive advantage. This will entail spatial place-based actions to establish and support propulsive industries in selected growth poles (see section 2.3). More specifically, the policy proposals on economic sectoral composition of the 5 PRs are focused on enhancing regional economic growth poles as identified in the analysis to establish a strong regional core; focusing on establishing and enhancing existing related variety between industries, and the diversification of the economic sectors with comparative advantage on a regional, but more specifically, a national level (see Table 1).
The proposals on the innovation and knowledge networks mechanism are focused on regions with a proven readiness for innovation (see Table 2), establishing a well-developed knowledge-network structure with a typical core-periphery structure focused on PSET, and a focus on skills training in related industries, as identified in the comparative advantage analysis, in order to enhance related variety.
Proposals focused on the government institutions mechanism (see Table 3) are proposed to establish a government headed by strong leaders equipped to manage the intricate trade-offs between adaptation and adaptability; focused on accountability through a reimagined institutional arrangement across regional borders in the form of a Regional Development Agency (RDA), and focused on basic service delivery across all settlements. In an attempt to deconcentrate national responsibilities to the regional level, regional development agencies (RDAs) have been used successfully across various countries (Ribot, 2003; Sayer, Elliott, Barrow, Gretzinger, Maginnis, McShane & Shepherd, 2004; European Commission, 2020) to instate and organise the delivery of policies within specific target areas as a vertical integration tool between national and local government. According to the OECD (2016), these RDAs are typically held accountable by the regional level of government; act separately from the traditional spheres of government, and often focus on a specialised field of business development or innovation in a place-based approach.
RDAs are often found not to be focused on a specific functional region, but on interregional partnerships and spillovers, as would typically be needed in the study area.
To illustrate these policy proposals on a PR level, the following more localised proposals are made. The analysis of PR1 established the innovation and knowledge networks mechanism as the focus of resilience policy in the region. This is proposed to be by means of enhancing the active access to ICT through improved internet connections and access to technology. PR1 has a national comparative advantage in five economic sectors.
The focus should be on strengthening those within the secondary sector in an attempt to focus more on local economic development and establishing a related variety focus. As the only PR with a TVET centre, skills training in the secondary sector with established related variety, is proposed. Investment in basic service delivery is proposed, especially with regard to sewage services.
The economic sectoral composition of the PRs shows that PR2 needs immediate focus on this mechanism, due to the high dependence on the primary sector (especially mining) and lack of diversification. A hybrid approach is proposed with the strengthening of the growth centre (see section 2.2) in Kuruman as well as corridor focus on the N14 passing through the proposed growth centre. PR2 should focus on establishing and supporting sectors of related variety to the strong mining sector, in which PR2 has a national competitive advantage. The main focus should be on establishing a stronger secondary sector in the region through establishing manufacturing industries, rather than only exporting the raw material. Kuruman is further recognised as a regional growth pole (NSDF, 2018) and, therefore, financial support from national and provincial government can be expected. PR2 also exhibits a high readiness to ICT access (see Table 2), which provides an opportunity to focus on strengthening the innovation and knowledge networks mechanism. As example, the focus will typically be on training in industries related to the mining and related manufacturing industry by means of establishing a skills training centre within the region. This will further solidify the role of the region and enhance the focus on its national comparative advantage. PR2 is highlighted as having very poor levels of service delivery, especially in terms of water and sewage services. Investment in these infrastructure services will assist in strengthening the mechanism and highlight a more accountable government.
PR3 has been established as the only region with non-peripheral regions within its boundaries. The region is more economically established and is overall regarded as the most resilient of the five PRs. PR3's weakest resilience mechanism is the government institution, and a service delivery focus is proposed. The strong innovation and knowledge networks mechanism should be further enhanced with a focus on PSET in sectors of national comparative advantage.
PR4 is the region with the least resilient institutional sector, illustrated through poor assurance from the government institutions. It is proposed that PR4 should focus on skills training and capacity-building in the institutional environment, as well as on investment in basic infrastructure.
In PR5, a stronger focus is proposed on the industries with national advantage in especially the secondary sector. This should take place in the existing growth centres (Springbok and Calvinia), in order to strengthen these rural centres. PR5 further exhibits a strong dependence on passive ICT, which should be addressed through the investment in active ICT access. As with the other four PRs, the institutional mechanism needs immediate attention, especially in terms of providing accountable and capable leadership. Investment in basic infrastructure service delivery with a focus on sewage services is proposed to further enhance this mechanism.
7. CONCLUSION
In recognition of evolutionary regional resilience, three mechanisms were highlighted as influencing the balancing act between adaptation and adaptability, i.e. economic sectoral composition, innovation and knowledge networks, and government institutions. It is recognised that, for a state of efficient balance between adaptation and adaptability, the tension between each of the mechanisms also needs to be in simultaneous equilibrium with one another, in effect "operating at the edge of chaos" in this balancing act (Pascale, 1999: 92). This will prevent both regional lock-in and regional stagnation.
The quantitative analysis provided insight into the unique challenges of each PR, as identified within peripheral South Africa. The analysis of indicators of the resilience mechanisms allows for a more specific and practical policy approach to strengthening the single mechanisms of each PR into an inclusive, more robust peripheral region.
The aim of this article was to determine and propose a developmental policy approach towards a more resilient peripheral Northern Cape province by means of three identified mechanisms of regional resilience. A regional developmental approach through spatial targeting within growth centres and along development corridors, and through a continuous strive towards a dynamic stability between the three mechanisms, will establish a more integrated regional system of core- and periphery-interaction. Through a process of decentralised concentration (utilising the policy instruments) in both regional growth centres (regional level) and growth points (subregional level), the resilience capacity of the peripheral region will be enriched. The focus on decentralised concentration in an allocative and innovative manner, will potentially yield a peripheral region with a dynamic relationship between unbalanced spatial development and inclusive socioeconomic development. In support hereto, institutional collective action by a responsive and accountable local and regional government, operating beyond their functional limits, will reinforce and amplify development in the peripheral region.
REFERENCES
AGRISA. 2019. Agriculture Drought Report 2018-19. Agri SA Centre of Excellence (CoE): Economics and Trade. [Online]. Available at: <https://www.agrisa.co.za/download/hr6Ar27BjkE6g5ikb7y2mneqi6RzJy8WGfPR9kfI.pdf> [Accessed: 10 August 2020]. [ Links ]
ANDREW, S.A. & FEIOCK, R.C. 2010. Core-peripheral structure and regional governance: Implications of Paul Krugman's new economic geography for public administration. Public Administration Review, May/ June, pp. 494-499. https://doi.org/10.1111/j.1540-6210.2010.02163.x [ Links ]
ARMSTRONG, H.W. & TAYLOR, J. 2000. Regional economics and policy. Oxford: Blackwell. [ Links ]
AUDITOR GENERAL. 2019. Consolidated general report on the local government audit outcomes. [Online]. Available at: <https://www.agsa.co.za/reporting.aspx> [Accessed: 18 November 2019]. [ Links ]
BALLAND, P.A., SUIRE, R. & VICENTE, J. 2013. Structural and geographical patterns of knowledge networks in emerging technological standards: Evidence from the European GNSS industry. Economics of Innovation and New Technology, 22(1), pp. 47-72. https://doi.org/10.1080/10438599.2012.699773 [ Links ]
BELUSSI, F. & SEDITA, S.R. 2009. Life cycle versus multiple path dependency in industrial cities. European Planning Studies, 17(4), pp. 505-528. https://doi.org/10.1080/09654310802682065 [ Links ]
BIRCH, E.L. 1996. Planning in a world city. Journal of the American Planning Association, 62(4), pp. 442-459. https://doi.org/10.1080/01944369608975711 [ Links ]
BOS, D.J. 1990. Die rol en ontwikkeling van intermediare stede as deel van 'n verstedelikingstrategie vir Suid-Afrika. Unpublished D.Phil dissertation. Potchefstroom: PU vir CHO. [ Links ]
BOSCHMA, R. 2015. Towards an evolutionary perspective on regional resilience. Regional Studies, 49(5), pp. 733-751. https://doi.org/10.1080/00343404.2014.959481 [ Links ]
BOSCHMA, R. & LAMBOOY, J. 1999. The prospects of an adjustment policy based on collective learning in old industrial regions. Geojournal, 49(4), pp. 391-399. https://doi.org/10.1023/A:1007144414006 [ Links ]
BOSCHMA, R. & FRENKEN, K. 2010. The spatial evolution of innovation networks: A proximity perspective. In: Boschma, R.A. & Martin, R. (Eds). The handbook of evolutionary economic geography. Cheltenham: Edward Elgar Publishing, pp. 120-135. [ Links ]
BRISTOW, G. & HEALY, A. 2014. Building resilient regions: Complex adaptive systems and the role of policy intervention. Raumforsch Raumordn, 72, pp. 93-102. https://doi.org/10.1007/s13147-014-0280-0 [ Links ]
CAPELLO, R. 2007. Regional economics. London: Routledge. [ Links ]
CHRISTOPHERSON, S., MITCHIE, J. & TYLER, P. 2010. Regional resilience: Theoretical and empirical perspective. Cambridge Journal of Regions, Economy and Society, 3(1), pp. 3-10. https://doi.org/10.1093/cjres/rsq004 [ Links ]
CLEGG, S.R., DA CUNHA, J.V. & CUNHA, M.P. 2002. Management paradoxes: A relational view. Human Relations, 55(5), pp. 483-503. https://doi.org/10.1177/0018726702555001 [ Links ]
CRESPO, J., SUIRE, R. & VICENTE, J. 2014. Lock-in or lock-out? How structural properties of knowledge networks affect regional resilience. Journal of Economic Geography, 14(1), pp. 199-219. https://doi.org/10.1093/jeg/lbt006 [ Links ]
CRESWELL, J.W. 2014. Research design: Qualitative, quantitative and mixed methods approaches. 4th edition. Thousand Oaks, CA: Sage Publications. [ Links ]
CRESWELL, J.W. & PLANO-CLARK, V.L. 2007. Designing and conducting mixed methods research. Thousand Oaks, CA: Sage Publications. [ Links ]
DAVIES, A. & TONTS, M. 2010. Economic diversity and regional socio-economic performance. Geographical Research, 48(3), pp. 223-234. https://doi.org/10.1111/j.1745-5871.2009.00627.x [ Links ]
DAVIES, S. 2011. Regional resilience in the 2008-2010 downturn: Comparative evidence from European countries. Cambridge Journal of Regions, Economy and Society, 4(3), pp. 369-382. https://doi.org/10.1093/cjres/rsr019 [ Links ]
DAWLEY, S. 2014. Creating new paths? Offshore wind, policy activism, and peripheral region development. Economic Geography, 90(1), pp. 91112. https://doi.org/10.1111/ecge.12028 [ Links ]
DBSA (DEVELOPMENT BANK OF SOUTHERN AFRICA). 2001. Guidelines to regional socioeconomic analysis. [Online]. Available at: <https://www.dbsa.org/EN/About-Us/Publications/Documents/GuidelinestoRegionalAnalysis.pdf> [Accessed: 18 November 2019]. [ Links ]
DEMARCATION BOARD. 2019. Municipal demarcation. [Online]. Available at: <http://www.demarcation.org.za/site/> [Accessed: 20 November 2019]. [ Links ]
DEPARTMENT ECONOMIC DEVELOPMENT AND TOURISM, NORTHERN CAPE. 2017. Diversification of a resource-based economy: Northern Cape perspective. Research and Development Unit. [Online]. Available at: <http://www.northern-cape.gov.za> [Accessed: 3 February 2020]. [ Links ]
DEPARTMENT PLANNING, MONITORING AND EVALUATION. 2014. Twenty-year review: South Africa 1994-2014. Pretoria: The Presidency. [ Links ]
DEPARTMENT PLANNING, MONITORING AND EVALUATION. 2017. National Planning Commission. [Online]. Available at: <http://www.nationalplanningcommission.org.za> [Accessed: 12 February 2020]. [ Links ]
DEPARTMENT OF RURAL DEVELOPMENT AND LAND REFORM. 2019. Draft National Spatial Development Framework. [Online]. Available at: <https://www.drdlr.gov.za/sites/Internet/ResourceCenter/DRDLR%20Document%20Centre/Annexures_Draft_NSDF27Jan2020.pdf> [Accessed: 18 November 2019]. [ Links ]
DESROCHERS, P. & LEPPALA, S. 2011. Opening up the 'Jacobs spillovers' black box: Local diversity, creativity and the processes underlying new combinations. Journal of Economic Geography, 11(5), pp. 843-863. https://doi.org/10.1093/jeg/lbq028 [ Links ]
DE WEIJER, F. 2013. Resilience: A Trojan horse or a new way of thinking? Maastricht: European Centre for Development Policy Management. [ Links ]
DISSART, J.C. 2003. Regional economic diversity and regional economic stability: Research results and agenda. International Regional Science Review, 26(4), pp. 423-446. https://doi.org/10.1177/0160017603259083 [ Links ]
DREWES, J.E. 2009. The influence of differential urbanisation on regional policy. Lambert Academic Publishing. [ Links ]
DU TOIT, J. 2015. Research design. In: Silva, E., Healey, P., Harris, R. & Van den Broeck, P. (Eds). The Routledge handbook of planning research methods. London: Routledge, pp. 61-73. [ Links ]
ESSLETZBICHLER, J. 2007. Diversity, stability and regional growth in the United States, 1975-2002. In: Frenken, K. (Ed.). Applied evolutionary economics and economic geography. Cheltenham: Edward Elgar Publishing, pp. 203-299. [ Links ]
EUROPEAN COMMISSION. 2020. Regional policy. [Online]. Available at: <https://ec.europa.eu/regional_policy/en/policy/what/investment-policy/> [Accessed: 13 August 2020]. [ Links ]
FEIOCK, R.C. 2007. Regional choice and regional governance. Journal of Urban Affairs, 29(1), pp. 49-65. https://doi.org/10.1111/j.1467-9906.2007.00322.x [ Links ]
FLEMING, L., MINGO, S. & CHEN, D. 2007. Collaborative brokerage, generative creativity and creative success. Administrative Science Quarterly, 52(3), pp. 443-475. https://doi.org/10.2189/asqu.52.3.443 [ Links ]
FRENKEN, K., VAN OORT, F.G. & VERBURG, T. 2007. Related variety, unrelated variety and regional economic growth. Regional Studies, 41(5), pp. 685-697. https://doi.org/10.1080/00343400601120296 [ Links ]
FRIEDMANN, J. 1966. Regional development policy: A case study of Venezuela. London: MIT Press. [ Links ]
GLAESER, E.L. 2005. Reinventing Boston: 1630-2003. Journal of Economic Geography, 5(2), pp. 119-153. https://doi.org/10.1093/jnlecg/lbh058 [ Links ]
GLASSON, J. 1978. An introduction to regional planning. London: Hutchinson & Co. https://doi.org/10.4324/9780203938935 [ Links ]
GLASSON, J. & MARSHALL, T. 2007. Regional planning. Oxfordshire: Routledge. [ Links ]
GODIN, B. 2003. The emergence of S&T indicators: Why did governments supplement statistics with indicators? Research Policy, 32(4), pp. 679-691. https://doi.org/10.1016/S0048-7333(02)00032-X [ Links ]
GRABHER, G. 1993. The weakness of strong ties: The lock-in of regional development in the Ruhr area. In: Grabher, G. (Ed.). The embedded firm. London: Routledge, pp. 255-277. [ Links ]
GRABHER, G. & STARK, D. 1997. Organising diversity: Evolutionary theory, network analysis and post socialism. Regional Studies, 31(5), pp. 533-544. https://doi.org/10.1080/00343409750132315 [ Links ]
GROOT, S., MOHLMANN, J.L., GARRETSEN, J.H. & DE GROOT, H.L. 2011. The crisis sensitivity of European countries and regions: Stylised facts and spatial heterogeneity. Cambridge Journal of Regions, Economy and Society, 4(3), pp. 437-456. https://doi.org/10.1093/cjres/rsr024 [ Links ]
HALL, P. 1975. Urban and regional planning. New York: Routledge. [ Links ]
HALL, P. 1987. Metropolitan settlement strategies. In: Rodwin, L. (Ed.). Shelter, settlement and development. Boston: Allen, pp. 236-259. [ Links ]
HALL, P.G., HALL, P. & PFEIFFER, U. 2000. Urban future 21: A global agenda for twenty-first century cities. London: Taylor & Francis. [ Links ]
HANSEN, N.M., HIGGINS, B. & SAVOIE, D.J. 1990. Regional policy in a changing world. New York: Plenum Press. https://doi.org/10.1007/978-1-4899-2079-9 [ Links ]
HASSINK, R. 2010. Regional resilience: A promising concept to explain differences in regional economic adaptability? Cambridge Journal of Regions, Economy and Society, 3(1), pp. 45-58. https://doi.org/10.1093/cjres/rsp033 [ Links ]
HARRISON, P. & TODES, A. 2013. Spatial considerations in the development of urban policy in South Africa: Background paper. Pretoria: Ministry Cooperative Governance and Traditional Affairs. [ Links ]
JOHNSON, R., GREGORY, D. & SMITH, D. 1986. The dictionary of human geography. Oxford: Blackwell. [ Links ]
KRUGMAN, P.R. 1991. Geography and trade. Cambridge, MA: MIT Press. [ Links ]
KUKLINSKI, A.R. 1970. Regional development, regional policies and regional planning: Problems and issues. Regional Studies, 4(3), pp. 269-278. https://doi.org/10.1080/09595237000185291 [ Links ]
LALL, S.V. 2011. Regional policy: What works and what doesn't. In: Richardson, H.W., Bae, C.H.C. & Choe, S.C. (Eds). Reshaping regional policy. Cheltenham: Edward Elgar Publishing, pp. 41-56. [ Links ]
LAWSON, C. 1999. Towards a competence theory of the region. Cambridge Journal of Economics, 23(2), pp. 151-166. https://doi.org/10.1093/cje/23.2.151 [ Links ]
MAGGI, R. & NIJKAMP, P. 1992. Missing networks and regional development in Europe. In: Vasko, T. (Ed.). Problems of economic transition: Regional development in Central and Eastern Europe. Brookfield, WI: Avebury, pp. 30-49. [ Links ]
MAJOOR, S. 2015. Resilient practices: A paradox-oriented approach for large-scale development projects. Town Planning Review, 86(3), pp. 257-277. https://doi.org/10.3828/tpr.2015.17 [ Links ]
MARTIN, R. & SUNLEY, P. 2006. Path dependence and regional economic revolution. Journal of Economic Geography, 6(4), pp. 395-437. https://doi.org/10.1093/jeg/lbl012 [ Links ]
MILLER, F., OSBAHR, H., BOYD, E., THOMALLA, F., BHARWANI, S., ZIERVOGEL, G., WALKER, B., BIRKMANN, J., VAN DER LEEUW, S., ROCKSTRÖM, J., HINKEL, J., DOWNING, T., FOLKE, C. & NELSON, D. 2010. Resilience and vulnerability: Complementary or conflicting concepts? Ecology and Society, 15(3), pp. 1-25. https://doi.org/10.5751/ES-03378-150311 [ Links ]
NEFFKE, F., HENNING, M. & BOSCHMA, R. 2011. How do regions diversify over time? Industry relatedness and the development of new growth paths in regions. Economic Geography, 87(3), pp. 237-265. https://doi.org/10.1111/j.1944-8287.2011.01121.x [ Links ]
NEL, E. 2005. Local economic development in South African small towns. In: Nel, E. & Rogerson, C.M. (Eds). Local economic development in the developing world: The experience of Southern Africa. New Brunswick: Transaction Press, pp. 253-265. [ Links ]
NORTHERN CAPE DEPARTMENT OF EDUCATION. 2018. Northern Cape Department of Education Annual Report 2016/2017. [Online]. Available at: <http://ncdoe.ncpg.gov.za/Images/Media/Administration/Annual_Report/Dept%20of%20Education%20AR%202017-2018.pdf> [Accessed: 18 November 2019]. [ Links ]
NORTHERN CAPE GOVERNMENT. 2019. Provincial Spatial Development Framework. [Online]. Available at: <http://app.spisys.gov.za> [Accessed: 3 February 2020]. [ Links ]
NAOUM, S.G. 2013. Dissertation research and writing for construction students. 3rd edition. Oxford: Butterworth-Heinemann. https://doi.org/10.4324/9780203720561 [ Links ]
OECD (ORGANISATION FOR ECONOMIC COOPERATION AND DEVELOPMENT). 2010. Regional development policies in OECD countries. Paris: OECD Publishing. [ Links ]
OECD (ORGANISATION FOR ECONOMIC COOPERATION AND DEVELOPMENT). 2016. OECD Regional outlook 2016: Productive regions for inclusive societies. Paris: OECD Publishing. [ Links ]
PASCALE, R.T. 1999. Surfing the edge of chaos. Sloan Management Review, 40(3), pp. 83-94. [ Links ]
PIKE, A., DAWLEY, S. & TOMANEY, J. 2010. Resilience, adaptation and adaptability. Cambridge Journal of Regions, Economy and Society, 3(1), pp. 59-70. https://doi.org/10.1093/cjres/rsq001 [ Links ]
QUANTEC. 2017. Easydata: Regional Explorer. [Online]. Available at: <www.easydata.co.za> [Accessed: 7 November 2019]. [ Links ]
QUANTEC. 2019. Easydata: Regional Explorer. [Online]. Available at: <www.easydata.co.za> [Accessed: 12 November 2019]. [ Links ]
RICHARDSON, H.W. 1981. National urban development strategies in developing countries. Urban Studies, 18(3), pp. 267-283. https://doi.org/10.1080/00420988120080591 [ Links ]
RICHARDSON, H.W. 1983. Population distribution policies. Population Bulletin of the United Nations, 15, pp. 35-49. [ Links ]
RICHARDSON, H.W. 1987. The goals of national urban policy: The case of Indonesia. In: Fuchs, R.J., Jones, W.J. & Pernia, E.M. (Eds). Urbanization and urban policies in pacific Asia. London: Westview, pp. 277-300. https://doi.org/10.4324/9780429266898-14 [ Links ]
RIBOT, J.C. 2003. Democratic decentralisation of natural resources: Institutional choice and discretionary power transfers in Sub-Saharan Africa. Public Administration and Development, 23(1), pp. 53-65. https://doi.org/10.1002/pad.259 [ Links ]
SAVIOTTI, P.P. & FRENKEN, K. 2008. Export variety and the economic performance of countries. Journal of Evolutionary Economics, 18(2), pp. 201-218. https://doi.org/10.1007/s00191-007-0081-5 [ Links ]
SAYER, J., ELLIOTT, C., BARROW, E., GRETZINGER, S., MAGINNIS, S., MCSHANE, T. & SHEPHERD, G. 2004. The Implications for biodiversity conservation of decentralised forest resources management paper, prepared on behalf of IUCN and WWF for the UNFF Inter-sessional workshop on Decentralisation, Interlaken, Switzerland, May 2004. [ Links ]
SHANNON-BAKER, P. 2016. Making paradigms meaningful in mixed methods research. Journal of Mixed Methods Research, 10(4), pp. 319-334. https://doi.org/10.1177/1558689815575861 [ Links ]
SIMMIE, J. & MARTIN, R.L. 2010. The economic resilience of regions: Towards an evolutionary approach. Cambridge Journal of Regions, Economy and Society, 3(1), pp. 27-43. https://doi.org/10.1093/cjres/rsp029 [ Links ]
SIMSEK, Z., HEAVEY, C., VEIGA, J.F. & SOUDER, D. 2009. A typology for aligning organizational ambidexterity's conceptualizations, antecedents, and outcomes. Journal of Management Studies, 46(5), pp. 864-894. https://doi.org/10.1111/j.1467-6486.2009.00841.x [ Links ]
STATISTICS SOUTH AFRICA. 2015. Information and Communication Technologies (ICT). In-depth analysis of the General Household Survey data. Pretoria: Statistics South Africa. [ Links ]
STATISTICS SOUTH AFRICA. 2018. Statistical release: Gross domestic product, Fourth quarter 2018. Pretoria: Statistics South Africa. [ Links ]
STILWELL, F.J. 1972. Regional economic policy. London: Macmillan. https://doi.org/10.1007/978-1-349-01366-1 [ Links ]
STIMSON, R., STOUGH, R. & ROBERTS, B. 2009. Leadership and institutions in regional endogenous development. Cheltenham: Edward Elgar Publishing. https://doi.org/10.4337/9781848449435 [ Links ]
TREADO, C.D. 2010. Pittsburgh's evolving steel legacy and the steel technology cluster. Cambridge Journal of Regions, Economy and Society, 3(1), pp. 105-120. https://doi.org/10.1093/cjres/rsp027 [ Links ]
TUROK, I. 2014. The resilience of South African cities a decade after local democracy. Environment and Planning, 46(4), pp. 749-769. https://doi.org/10.1068/a4697 [ Links ]
UN (UNITED NATIONS). 1967. Criteria for location of industrial plants (changes and problems). New York: United Nations. [ Links ]
VAN ASWEGEN, M. 2018. Planning for a resilient peripheral region: A regional policy approach. Unpublished PhD dissertation. North-West University, Potchefstroom, South Africa. [ Links ]
WAGNER, J.E. 2000. Regional economic diversity: Action, concept, or state of confusion. The Journal of Regional Analysis and Policy, 30(2), pp.1-22. [ Links ]
WAGNER, C. & LEYDESDORFF, L. 2005. Network structure, self-organization and the growth of international collaboration in science. Research Policy, 34(10), pp. 16081618. https://doi.org/10.1016/j.respol.2005.08.002 [ Links ]
Peer reviewed and revised July 2020
Published December 2020
* The authors declared no conflict of interest for this title or article
1 Homeland or Bantustan areas refer to territory that the National Party administration set aside for Black inhabitants as part of its policy of apartheid.
2 A Spatial Development Framework (SDF) seeks to guide overall spatial distribution of current and desirable land uses within a municipality, in order to give effect to the vision, goals and objectives of the municipal Integrated Development Plan.
3 GVA is the output of the country less than the intermediate consumption, which is the difference between gross output and net output (DBSA, 2001: 33). GVA can also be used to see how much value is added (or lost) from a particular region or province (DBSA, 2001: 33).
4 Statistics South Africa developed the ICT Access Index (IAI) based on a composite international index (ICT Development Index (IDI)) developed by the International Telecommunications Union (ITU) but adapted to the availability of input variables in South Africa. Although the IAI is loosely based on the IDI, the two indices are also very different. The IDI, for instance, uses fixed and mobile broadband subscriptions per 100 inhabitants to measure internet access, while the IAI only considers the percentage of households with access to the internet (Statistics South Africa, 2015: 70).
5 The GHS has been conducted since 2002 by Stats SA and was specifically designed to measure the multiple facets of the living conditions of South African households. It covers six broad areas, namely education, health and social development, housing, household access to services and facilities, food security, and agriculture.
6 Including, but not limited to Population Census time series; Community Survey Data; Household Survey Data; Labour Force Survey; Department Education Annual Data; Health Systems Trust; SARS International Trade (Quantec, 2019).
7 Internationally accepted standard for the audit of public and private institutions, as defined by ISO/IEC 29115 Standard.
8 The article does not aspire to include the muddled and complex politics within the country or the study area. It has an apolitical focus on comparative and available statistics with regard to institutional leadership, adaptive capacity, service delivery, and assurance to the public.

