


Services on Demand
Article
 English (pdf)
 Article in xml format
 Article references
Indicators

Related links
-
 Cited by Google
 -
 Similars in Google
Share

 Permalink
Town and Regional Planning
On-line version ISSN 2415-0495
Print version ISSN 1012-280X
Town reg. plan. (Online) vol.76 Bloemfontein 2020
http://dx.doi.org/10.18820/2415-0495/trp76i1.5
ARTICLES
A multisensory approach to measure public space quality in the city of Bulawayo, Zimbabwe
'N multisensoriese benadering tot die meet van die kwaliteit van openbare ruimtes in die stad Bulawayo, Zimbabwe
Mokhoa oa ho lekanya boleng ba lirapa tsa sechaba toropong ea Bulawayo, Zimbabwe
Nicholas MuleyaI; Maléne CampbellII
IDepartment of Rural and Urban Development, Great Zimbabwe University, PO Box 1235, Masvingo, Zimbabwe. Phone: +263 77 345 7423, Email: <nicholasmuleya@gmail.com>
IIAssociate Professor, Department of Urban and Regional Planning, PO Box 339, University of the Free State, Bloemfontein 9300, South Africa. Phone: +27 51 4013575, Email: <campbemm@ufs.ac.za> https://orcid.org/0000-0002-7045-5946
ABSTRACT
The measurement of the quality of public space is important in spatial planning as a first step towards improved urban quality. It would seem as if city builders sometimes use their subjective judgements of place quality through incomprehensive sensory tools and not the users' sensory experience and aspirations. Based on the multisensory experiences and aspirations of users as they interact with the streetscapes and public parks in Bulawayo, the purpose of this article was to develop and test the utility of a new public space quality measuring tool. A public space quality assessment was undertaken that employed a quantitative design where 400 participants were recruited through systematic sampling and data collected by means of a multisensory public space quality measurement tool. The tool and the 'Sensory Public Space Quality Framework' were developed to guide city planners in providing for people-centred public spaces clothed with good sensory qualities.
Keywords: Public space, multisensory principles, quality assessment, sensory quality
OPSOMMING
Die meting van die kwaliteit van openbare ruimtes is belangrik in ruimtelike beplanning as 'n eerste stap in die rigting vir verbeterde stedelike gehalte. Dit blyk asof stadsbeplanners hul subjektiewe beoordelings van plekgehalte soms gebruik deur onbegryplike sensoriese instrumente en nie die sensoriese ervarings en ambisie van die gebruikers nie. Die doel van hierdie artikel was om die nut van 'n nuwe meetinstrument vir openbare ruimtekwaliteit te ontwikkel en te toets op grond van die multisensoriese ervarings en aspirasies van gebruikers as hulle met die strate en openbare parke in Bulawayo omgaan. 'n Kwaliteitevaluering van openbare ruimtes is uitgevoer met 'n kwantitatiewe ontwerp waar 400 deelnemers gewerf is deur stelselmatige proefneming en data versamel is deur middel van 'n multisensoriese meetinstrument vir openbare ruimtekwaliteit. Die instrument en die 'Sensory Public Space Quality Framework is ontwikkel om stadsbeplanners te help in die voorsiening van mens-gesentreerde openbare ruimtes beklee met goeie sensoriese eienskappe.
Sleutelwoorde: Openbare ruimte, kwaliteitsmeting, multisensoriese beginsels, sensoriese kwaliteit
TUMELO
Tekanyo ea boleng ba libaka tsa sechaba ele mohato oa pele ntlafatsong ea litoropo e bohlokoa therong ea libaka. Ho bonahala baahi ba litoropo ba tloaetse ho lekanya boleng ba libaka ka lisebelisoa tse sa utloisiseheng, mme ba ipapisitse le litabatabelo tsa bona eseng maikutlo le litabatabelo tsa basebelisi ba libaka tsena. Boithuto bona bo ipapisitse le boiphihlelo, maikutlo le litabatabelo tsa basebelisi ba lirapa tsa sechaba Bulawayo, ele ho lekola sesebelisoa se secha sa ho lekanya boleng ba libaka tsa sechaba. Ho ile ha etsoa tlhahlobo ea boleng ba sebaka sa sechaba moo basebelisi ba 400 ba ileng ba khethoa ele karolo ea boithuto. Qetellong, boithuto bo ile ba bopa sesebelisoa le moralo oa boleng ba libaka tsa sechaba ele ho tataisa ba thero ea litoropo ho fana ka libaka tse eteletsoeng pele ke tshebeliso batho, mme tse ntlafatsang maikutlo a bona.
1. INTRODUCTION
'Public space' refers to the external component of any built environment that is accessible by the public; for example, streets, public parks and any land lying between private landholdings (Harvey, 2009: 3; Carmona, Tiesdel & Heath, 2010: 139; Tonnelat, 2010: 2; UN-Habitat, 2016: 131). It refers "not only to the spaces between buildings but also the objects and art[e]facts therein, and the building edges that help define the physical boundaries of the spaces" (Mehta, 2014a: 53). Public space plays a pivotal role in urban structure, character and the attractiveness of the townscape (New Master Planning Limited, 2008: 11; Project for Public Spaces, 2012: 1; Wojnarowska, 2016: 8), thus allowing cities to compete (Rio, 2004: 38; Trip, 2007: 502).
It can potentially reposition, reimage and market a city, thereby improving the city's tourism potential (Harvey, 2009: 4). Public space is the "lifeblood of the city" (Carmona et al., 2010: 137) that gives a city its image and sense of place (Gillespies, 2007: 4; Harvey, 2009: 4).
In addition, 'quality' refers to the "degree of excellence by which we satisfy the needs of the customers" (Malek, Mariapan, Shariff & Aziz, 2010: 6). Since it encompasses the capacity to satisfy needs or suitability for its intended purpose (Cafuta, 2015; Malek et al., 2010), it is, therefore, user based (Malek, Mariapan & Shariff, 2012). It is consequently measured by its ability to meet the needs and desires of the users (Malek et al. 2010).
Public space quality, therefore, means that a good public space can be characterised and measured according to its ability to satisfy user needs and desires (Mehta, 2007: 1). Arguing for the human dimension of public space, Carr, Francis, Rivlin and Stone (1992: 85) blame the popular tendency by designers to emphasise the physical qualities of a site only, while neglecting the human perspective. This results in designs based on satisfying the goal of the designers and not that of the users. Quality "must be centred on the interaction of people and places" and public space quality must be dependent on human experiences and aspirations (Willemse & Donaldson, 2012: 226). Public spaces that fail to meet people's expectations and desires cannot attract and retain people and are, therefore, abandoned or underutilised (Carr et al., 1992: 92; Gehl, 1989: 15).
In her book The death and life of American cities, Jacobs (1961) advocated the human perspective on public space quality. Drawing from her experience and observation of human interaction with the street, her book covers most of the aspects of life in the public space that are indirectly multisensory by nature; for example, how safety can be maintained on the sidewalk through natural surveillance by human beings (Jacobs, 1961: 38-39). The book is however biased towards the visual sensory mode, with minimal direct reference to other senses that can equally contribute to the quality of public space (Jacobs, 1961: 372-391).
Urban planners and designers often fail to satisfy fundamental human needs and preferences in terms of creating sustainable, inclusive and liveable places that are also experienced by users as valuable and recognisable (Perdikogianni, 2007: i; Polat, 2009: 90; Healey, 2010: 2). Apparently, the users' needs remain unattended and not fully appreciated by or known to the designers (Snyder & Catanese, 1979: 48; Moughtin, 2003: 3, 11; Mehta, 2014b: 107). Settlement makers are under attack 'from all sides' because of the gulf that exists between the settlements they, as professionals, create and the taste and expectations of the clients who live in and use the cities (Moughtin, 2003: 3, 11).
Urban designers and planners are faced with the challenge of "how to make public spaces usable for different types of users who come to use these spaces for diverse purposes and attach different meanings to them" (Mehta, 2007: 1). In order to do so, the diversity of the type of public space users needs to be measured, based on socio-demographic variables such as age group, gender, income, race, and level of education, as well as other variables such as household composition, residential location, and physical mobility (Mehta, 2007: 6). Different public space users groups, such as, for example, the 'ethnically disadvantaged groups' contest for public space, to the extent that "certain groups are discouraging others" (Willemse & Donaldson, 2012: 223; Mehta, 2014a: 54); yet it is supposed to be a meeting place for different social groups. Therefore, "publicness of any place must thus be assumed in terms of it being more public for more publics" (Varna & Tiesdell, 2010: 578). Jacobs (1961: 36) points out that "everyone must use the streets", the main type of public space; therefore, everyone must use the public space. A high-quality public space must therefore satisfy the needs and desires of the majority, if not of all the users.
To guide city planners in providing for people-centred public spaces clothed with good sensory qualities, this article developed a multisensory public space quality assessment tool. In this article, the tool, based on six sensory modes, was tested by measuring public space quality in the City of Bulawayo, and subsequently develop assessment procedures. With the tool, demographic groups were categorised, and their respective perceptions of the quality of public space, were compared to present sensory public space principles and develop the Sensory Public Space Quality Framework.
2. LITERATURE REVIEW
In order to develop a quality space measurement tool, it is important to introduce the theory on quality measurement of public spaces included in this article. The existing theory focuses on public space quality measurement, and multisensoriality.
2.1 Public space quality measurement
According to Jacobs (1961: 376), the public space and its interaction with its occupants is complex and multidimensional. Public place quality assessment should, therefore, be based on an understanding of the preferences, needs and usage patterns of the public space users, and thus can be measured by its ability to meet the needs and desires of the users (Malek et al., 2010: 7). Bergner, Memmel and Raslan et al. (2013: 407) concur that, in order to capture people's experiences and reactions in urban settlements, "there is [a] need to develop new methods for measuring people's feelings with specific indicators and parameters". Sholihah and Heath (2016: 245) argue that there is a "need for appropriate benchmark standards" to guide planners, designers and managers in evaluating design options and thus optimise quality public spaces. In order to best design public space spaces that manage and satisfy human needs and expectations, Francis' (1989: 147) "robust tools" should be developed to measure public space quality (Mehta 2007: 6).
Different authorities have advanced various models, methods or tools to measure public space quality. The Star model by Varna and Tiesdell (2010) is one example that is based on Ave dimensions of publicness, namely ownership, control, civility, physical configuration, and animation. Using an analytical star and multiple perceptional stars, appropriate indicators were identified for each dimension and a rating was assigned (Varna & Tiesdell, 2010: 588, 589, 592). One advantage of the star model is that it captures perceptions of different groups through the perceptual stars, which is important for inclusivity. The other advantage is that it can be used not only to determine the quality of a given public space, but also for comparison purposes and provides a pictorial presentation that can be readily understood; comparing different public spaces or comparing one public space overtime. However, the expert evaluator does the major evaluation role, with the users having minimal or no contribution. It is, therefore, subjective and biased towards the experts and not the representative of the users, a problem raised by Carr et al. (1992: 85). The model seems to be biased towards the use of the visual sensory mode at the expense of the other senses through the use of terms, visual access, visual permeability, visual connections, and visual enhancements.
Mehta (2007; 2014a) made two attempts towards the formulation of a public space quality measurement tool. In the first attempt, he used six measuring instruments, namely intensity of use, intensity of social use, duration of stay, temporal diversity of use, variety of use, and diversity of users (Mehta, 2007: 1). Siregar (2014: 12-15) used the same six measures through the Good Public Space Index (GPSI) method. The tool uses structured and unstructured direct observations with the strength that it captures perceptions on gender and different age groups. Its major limitation is that it does not classify and record users by race, economic class, and level of education, the variables of which "play a significant role in shaping perceptions that affect the use of public space" (Mehta, 2007: 6). The second attempt, the Public Space Index (PSI), is used to assess public space by empirically evaluating five dimensions of public space: "inclusiveness, meaningfulness, safety, comfort, and pleasurability" (Mehta, 2014a: 53). It is interesting to note how the measures used by the two models (the Star model and the PSI) differ, and even more interesting to note that the measures of one author differ (Mehta 2007; 2014a). One explanation is that there is no definite and comprehensive tool and, therefore, improvements continue to happen. The PSI uses structured and semi-structured observation (researcher input), interviews, and surveys with space users (user input) (Mehta, 2014a: 70). The five measures are each divided into several variables that are weighted and rated from 0 to 3 by both the researchers and the users. The index was tested on four public spaces in Tampa and the results are displayed in a pictorial pentagon. Just like the Star model, the PSI caters for group differences (Mehta, 2014a: 83), but, in this case, users participated during the assessment. The smaller number of variables used by the users (13) compared to those used by experts (32) (Mehta 2014a:70) means that the overall result on the quality of public space is skewed towards the latter. It is necessary to point out that 'sensory complexity', one of the subcomponents of the 'pleasurability dimension', is of direct interest to this article. It is pleasure derived from sensory experience of the public space, depending on the various stimuli perceived from the environment (Mehta, 2014a: 69).
One of the latest models invented by Wojnarowska (2016: 94-105) comprises three methods, namely the graphical valorisation, checklist valorisation, and interview method. While this is a good three-legged assessment criterium, the limitation is that the professional experts give ratings on two main methods (graphical and checklist), while the users fill the gaps through the interview method. Given that the rating from the three methods is averaged and similar to Mehta's (2014a) approach, the final rating is definitely biased towards expert opinion and thus not a representation of the quality of a place as expressed by the users. In addition, biased questioning of the users is possible, because the questions are based on the sole professionals' initial findings. The article did not attempt to single out specific group differences of perception of public space and such an approach puts out of sight the specific experiences and preferences by specific user groups. This whole range of weaknesses is inconsistent with the contemporary subjective approach to landscape quality; in particular, Rad and Ngah's (2014: 337) assertion that "judgement of the local users is valuable because they constantly interact in the public space". The experts may not always experience the places and some may be visiting the places for the first and last time during the study on serious duty.
It is clear that good work towards the production of public space quality literature and tools is ongoing. However, standing concerns include the users' minimal contribution towards the quality of their places; the non-consideration of different user groups by some researcher, and the bias towards the visual sensory quality.
2.2 Public space quality and multisensoriality
The modernist design of public space is biased towards the "hegemony of the eye" and disguises the importance of other senses (Carmona et al., 2010: 169; Herssens & Heylighen, 2008: 2). Pallasmaa (2005: 19) highlights that this dominance of the visual sensory mode has pushed people into "detachment, isolation and exteriority", with the world resulting in environmental sensory deprivation. This approach has resulted in "the body and other senses homeless" in the inhumane spaces whose design is dictated by the visual mode only. This means that people are reduced to mere spectators in the public space. Pallasmaa (2005: 24) argues that "vision separates the people from the world whereas other senses unite them with it".
The visual city is "one of distance and exteriority", while the haptic city is "one of interiority and nearness" (Pallasmaa, 2005: 23). The haptic city allows for users to participate actively in their public space. Some scholars argue that the higher senses (vision and hearing) are the focal point at the neglect of the lower senses of taste, touch, and smell as well as the internal senses (Freeland, 2012: 399; Howes, 2005: 75). Disturbingly, the higher senses, to which attention is paid, are 'distal' senses that do not directly interact with the human body, while the neglected low senses are the 'proximal senses' that allow for direct interaction between the users and the environment. The classification of the sensory system is based on Gibson's two broad categories, namely near space senses referring to the proximal senses (intimate sensing) and far senses referring to the distal senses (remote sensing) (quoted by Daly, Farahani, Hollingsbee & Ocampo, 2016).
The importance of the multisensory approach is that this approach is a move from visualising the city to sensing the city through multiple sensory modalities, thus avoiding the challenges resulting from ocularcentrism. According to Ellen Lupton (quoted by AIGA DC, 2018: online), design for the senses is human-centred and embodied, and thus gives one a complete physical experience. The approach is driven by inclusive design, because multisensory design caters for all those with "disabilities and neurological differences" and for people "who have lost or have reduced functionality of a sense or set of senses - something everyone is likely to face as part of the ageing process" (UK Climate Impacts Programme, 2016: 5). It thus allows for the design of life-course public spaces for all spaces that are age friendly and inclusive of the sensory impaired. It is through multisensory design that a "sense of belonging and integration" may be achieved successfully (Pallasmaa, 2005a: 1). According to White (1999: 198),
[a] successful place is sensual. All our senses are awakened, invited to take the site in, to touch the space in many ways. To be there is a multi-dimensional experience.
Views, sounds, scents, textures, tastes, movement time all create individual impressions and combine into holistic memories ... We appreciate the space experimentally, with our bodies, not just with our minds.
Given that the environment is apprehended interactively through an interconnected system of senses (Carmona et al., 2010 169; Freeland, 2012: 399; Grahn & Stigsdotter, 2010: 265;
Howes, 2005: 75; Lynch, 1960: 2); that human existence and pleasure is through all the senses; that the public space is wholly consumed through multiple senses, and that the approach caters for the sensory disabled, this article argues that a multisensory public space informed by desires for all the users and all relevant societal groups is certain to be of high quality.
Although it was generally believed that people have five senses, psychologists now agree that the exact number remains disputable, but it is more than five (Wade & Tavris, 2012: 182). The traditional five senses are vision (sight), audition (hearing), gustation (taste), olfaction (smell), and tactile (touch). The vestibular and kinaesthetic senses are two other additional senses collectively known as body or internal senses (Kasschau, 2003: 208).
According to Palmer, Schloss and Sammartino (2013: 17.1), the visual sub-modalities include colours (single colours, colour combinations, and colour harmony), spatial structure (low-level spatial properties, shape properties, and spatial composition within a frame) and their combinations. The auditory sensory mode entails sounds that may be classified in terms of taxons: sound source (sonic essence) and sound type (physical essence) (Lindborg, 2016: 300). The tactile sense encompasses sub-modalities such as pressure, temperature, itch, and pain (McGlone, Wessberg & Olausson, 2014: 737), movement, joint position, and muscle sense, which are all important in everyday life (Gallace, 2012: 896). The olfactory mode is based on Castro, Ramanathan and Chenubotla's (2013: 9) ten basic categories for smells, namely fragrant, woody (resinous), fruity (other than citrus), citrus, mint (peppermint), sweet, chemical, lemon as well as two types of sickening, pungent and decayed. Gustation is based on the five commonly accepted basic sensations or taste qualities, namely sour, bitter, sweet, salty, and umami (Breslin, 2013: 5; Corbin, 2006: 5). In relation to Roe, Herlin and Speak (2016: 757, 758, 767), definition of 'foodscapes' - food environments, the geographies of food, location of food outlets, and the relationship between people and food - the gustatory sense is expanded beyond taste to include food, its sources, and food-provision facilities. Based on the understanding that food, water and associated facilities to get rid of excreta are basic physiological needs, the provision of public toilets and litter bins is considered a gustatory issue. Eating environments are to be referred to, in this instance, as a 'gustatory setting'. The two internal senses of vestibular and kinaesthetic tell people about the environment within; they are all about the movement of our bodies and experiencing the physical body in the environment. The internal senses are expanded to include all human movement such as walking, jogging, playing, and climbing, among others. Issues to do with accessibility, permeability and navigability fall under the same bracket.
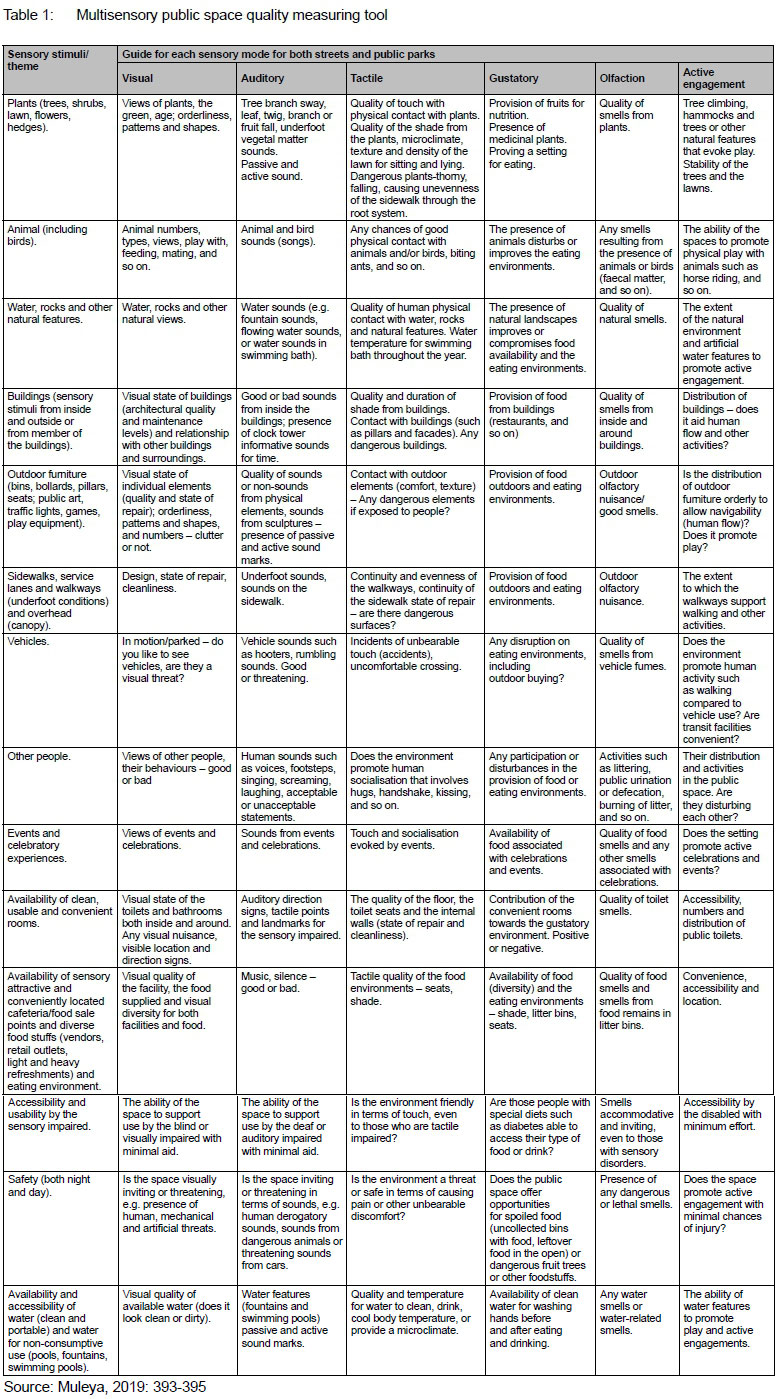
2.3 The new public space multisensory quality measuring tool
For purposes of this article, the six senses (Wade & Tavris, 2012: 182; Kasschau, 2003: 208) - the five traditional senses and the internal senses - are considered for the measuring tool and inclusion in the Sensory Public Space Quality Framework. Subsequently, six sensory quality principles are built, namely visual, auditory, gustatory, olfactory, tactile and vestibular-kinaesthetic quality. Table 1 shows the new measuring tool built for measuring sensory public space quality tested in this study.
3. STUDY AREA
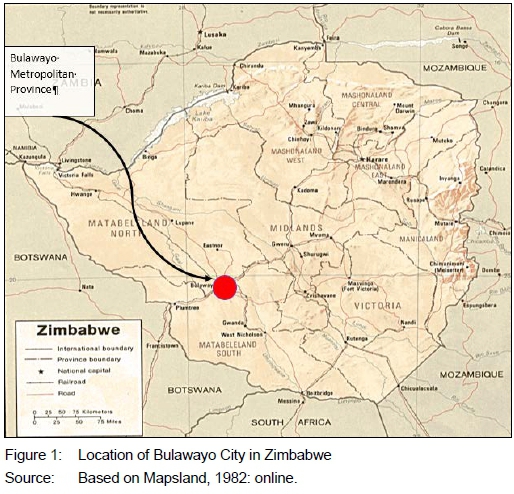
The City of Bulawayo (Figure 1), also known as the 'City of Kings', because it is the ancient capital of King Lobengula, is a secondary city of Zimbabwe after the capital city, Harare. In 1893, the British South Africa Company invaded and colonised Bulawayo. This company developed the settlement into a municipality in 1897 and it acquired city status on 4 November 1943 through the City of Bulawayo (Private) Act of 1943 (Chapter 29:02). The city had a total population of 653 337 in 2012 (Zimbabwe National Statistics Agency, 2012: 12). The city's population growth rate has been on the decline over the past five decades: 5.9% in the 1970s; 4.5% between 1982 and 1992, and 2% in the post-2000 period (Mbiba & Ndubiwa, 2009: 92). Between 2002 and 2012, the City of Bulawayo showed a slight decrease in population growth rate of -0.3% (Zimbabwe National Statistics Agency, 2015: 9), which makes it the only province in the country with a negative population growth rate. The population decline can be explained by the unfavourable macro-economic situation and devastated sociopolitical condition in Zimbabwe, in particular the mass closure of industries in Bulawayo, which led to high levels of unemployment and subsequently emigration.
3.1 Rationale for selecting the study area
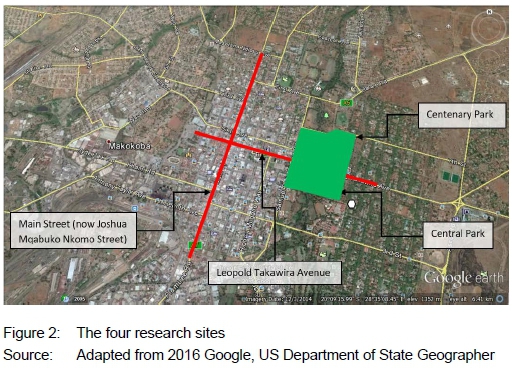
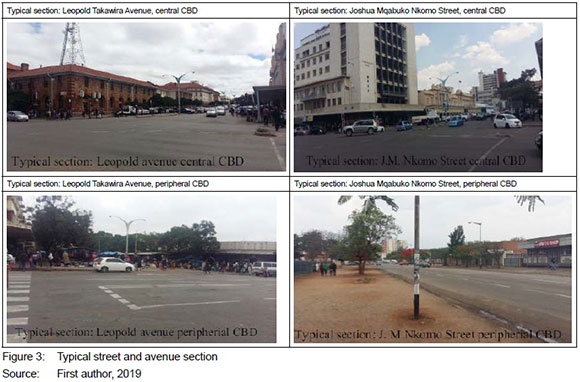
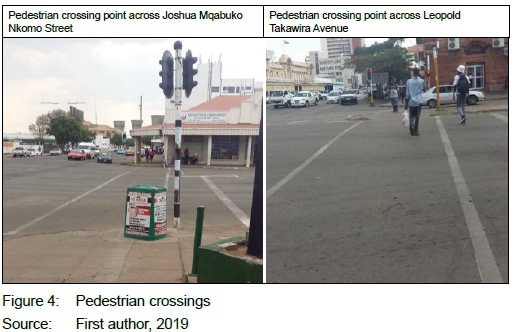
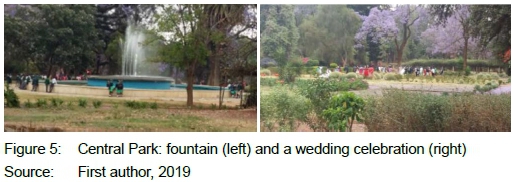
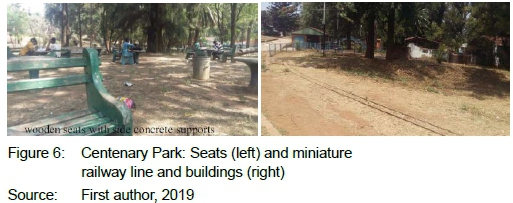
The City of Bulawayo was selected for the study, because it is the best-planned and best-managed city in Zimbabwe. It is attractive and harmonious, geared to serve humanity, and a centre of tourism (Mbiba & Ndubiwa, 2009: 91, 93). Its popular wide streets, an established street system, and considerable open spaces made it a relevant case study. The gridiron layout for the city's central business district (CBD) is similar to almost all Zimbabwean cities (Munzwa & Wellington, 2010: 137) and those of European cities (Ndlovu, 2015: 24, 26). This study focused on four major parts of the public space in Bulawayo, namely the Leopold Takawira Avenue, the Main Street (recently renamed to Joshua Mqabuko Nkomo Street), the Central Park (south of Leopold Takawira Avenue), and the Centenary Park (north of Leopold Takawira Avenue), as shown in Figure 2. The two types of public space, namely streets and public parks, were also selected for the study, due to their locational relationships with the CBD and the subsequent high level of 'publicness' to both visitors and residents, all important to the character and image of the city (see Figures 3-6). This selection is in alignment with Wojnarowska's (2016: 86) explanation that "[p]ublic space located in the town centre is the most representative of its identity and image, and also serves multiple functions and activities". This study is all about people and thus interested in the most populous parts of the outdoor space.
4. RESEARCH APPROACH
This study develops and tests the utility of a new public space quality measuring tool (Table 1) on four major parts of public space in Bulawayo, Zimbabwe, to propose a new 'Sensory Public Space Quality Framework' for measuring public space quality.
A mixed methods research approach, including qualitative and quantitative research methods, was used (Creswell, 2014). Qualitative data were collected through walk-by and drive-by observations of the four case study areas (Yin, 2014), in order to identify the main elements that shape and constitute the streetscape and parks, namely buildings, surfaces, plants, outdoor furniture, people, and vehicles, among others (see Figures 3 to 6) and to observe the interaction of users with these places. The interviews helped identify important public space quality aspects. The reason for collecting both quantitative and qualitative data is to elaborate on specific findings from the case study observations on the multisensory quality aspects of the buildings, surfaces, plants, outdoor furniture, people, and vehicles, such as similar public space multisensory quality aspects suggested from interview respondents' groups (Creswell & Plano-Clark, 2011).
4.1 Sampling method and size
Systematic sampling was employed to select both the physical setting (segments for assessment) and the study participants. This is a technique where a "sampling frame is ordered according to some criteria and elements selected at regular intervals through an ordered list" (Bhattacherjee, 2012: 67).
4.1.1 Physical setting segments
The public parks were each divided into five segments, making up a total of 10 segments for both parks (segments 1 to 10). Given the aerial nature of the parks, all ten segments were selected for assessment. Leopold Takawira Avenue was divided into ten segments (segments 11 to 20) and Joshua Mqabuko Nkomo Street was divided into 15 segments (segments 21 to 35) in line with the street-avenue intersections. Through systematic sampling, five street segments were selected from Leopold Takawira Avenue and five from Joshua Mqabuko Nkomo Street.
For example, in the case of Joshua Mqabuko Nkomo Street, the natural segments from Connaught Avenue to 15th Avenue were considered in their existing physical order and named segments 21 to 35. Given the total population of 15 segments, a sample of five segments was selected using a sample interval of three. As expected, the starting point was randomly chosen from within the first three segments in the list and three was selected representing the third segment. Therefore, segments 23, 26, 29, 32 and 35 were subsequently selected. The same process was followed for Leopold Takawira Avenue, leading to the selection of the 12th, 14th, 16th, 18th and 20th avenues.
4.1.2 Participants
To determine the estimated population of daily users for each study area, systematic hourly pedestrian counts, per day, per segment, over weekends and weekdays (outside rainy days and functions) was done, resulting in an estimated daily public space user population of 263 974. Israel (1992: 3) highlighted that a sample size of 400 is adequate for any population size greater than 100 000.
Four hundred participants were selected from the four study sites, in particular from the 20 segments selected for assessment. Systematic sampling, with fixed sample intervals, was used for streets and an interval for parks based on the estimated daily user population. With an estimated daily public space user population of 263 974 and a desired sample of 400 participants, the sample interval was 660. This sample interval was too big to use for public parks, where the daily population is small. Therefore the sample interval for 660 was applied to the street and avenue, and a sample interval of 66, which is a factor of 660, was used for Central and Centenary Park.
For the street and the avenue, for example, random number tables were employed to identify the first participant from 1 to 660 inclusive; the number selected was 57. This means that the research assistants would start counting from 1 to 57 and then conduct a questionnaire with the 57th participant, the next participant was number 717 (660+57) and so on, following the sample interval.
In order to ensure that the continuity in count was not lost during the 20 minutes when the research assistant was busy interacting with participants and could not count the people, an average rate of people flow was used. For example, in streets, the average people flow rate was 1 352 people per hour, which translates to 451 people in 20 minutes. The same was done for parks. In this way, the total sample size of 400 was not affected, since the four trained research assistants continued to sample the participants systematically until they completed the 100 assessment sessions each.
In each segment, 20 participants were selected. For public parks, where there were gates in a given segment, participants were recruited on exiting or entering; where there were no gates, the pedestrians following the internal pathways were interviewed. For the street and the avenue, ten participants were selected from the sidewalks on either side of the street or avenue. Counting was done for people going in either directions on the sidewalk. Every effort was made during the recruiting of participants to ensure that a random sample is selected (Teddlie & Yu, 2007: 97).
4.2 Interview questionnaire and quality measurement
The author and the research assistants conducted interviewer-administered questionnaires with pedestrians to measure multisensory quality on four public spaces in Bulawayo from 12 to 24 March 2018.
The questionnaire consisted of two sections. The first section, on the respondents' demographic profile, obtained personal information on age, gender, race, years living in Bulawayo, residence, occupation, educational level, and religion. The second section set four tick-box questions and one Likert-scale question with 16 items on the construct 'sensory quality'. The public space quality measurement tool (Table 1) comprises six sensory quality constructs derived from six sensory modes (visual, auditory, olfactory, gustatory, tactile, and vestibular-kinaesthetic (active engagement) and 14 sensory stimuli/ themes. The 14 sensory stimuli were derived from an extensive literature review on public space quality and observations of the study areas. Participants were requested to rate their experience with sensory quality of items in the four public spaces. The results from these measurements form the items used in the descriptive analysis and to propose the Sensory Public Space Quality Framework. To reduce the respondents' bias, closed-ended questions were preferred for section two (Akintoye & Main, 2007: 601).
4.3 Quality measurement analysis and interpretation of findings
Microsoft Excel was used first to simplify the complex data involving multiple sensory stimuli and multiple constructs and to make the data compatible for easy entry into IBM SPSS Statistics 24 (Statistical Package for Social Sciences). The frequencies and percentages of responses were generated and reported, in order to analyse the respondents' profile, and the overall and individual ratings of sensory quality for streets and parks.
For the analysis of 'sensory quality', a 5-point Likert scale was used to measure how strongly respondents felt regarding the statements in the Likert-scale construct. Likert-scale rankings are effective where numbers can be used to quantify the results of measuring behaviours, attitudes, preferences, and even perceptions (Wegner, 2012: 11; Naoum, 2013: 89). For the purposes of analysis, it is important to note that the following scale measurement was used regarding mean scores (MSs), where 1 = very poor (unpleasant or annoying); 2 = poor; 3 = fair (neutral); 4 = good, and 5 = excellent (pleasant or exciting). Data was analysed using mean and standard deviation, in order to report central tendency of 'sensory quality' measurements.
Using the independent-samples t-test, the mean scores for, gender, age, qualification, number of years living in Bulawayo, marital status, economic status, and location (site) of the respondent were tested for significance with, against the six multisensory modes, namely visual, auditory, tactile, olfactory, gustatory quality, and active engagement. A t-test is a type of inferential statistic used to determine if there is a significant difference between the means of two groups (Christopher, 2016: 191). To test if the differences were significant, the P value was set at 5% (p < .05) (Dahiru, 2008: 22).
4.4 Limitations
The counting and sampling activities were complicated as the volumes and patterns of people flow vary from the time of the day, day of the week, time of the year. The findings of the study can be generalised to the four study areas.
5. FINDINGS
5.1 Demographics of respondents
Table 2 presents the profile of respondents to the interview questionnaire surveys. The Ndebele-(50.3%) and Shona- (40.8%) speaking people, the younger population (51.7%), Christians (97%), employed people (32.7%), students (30.2%), people from high-density areas (60%), single (54%), and male (58.5%) populations were dominating in the streets and parks under study.
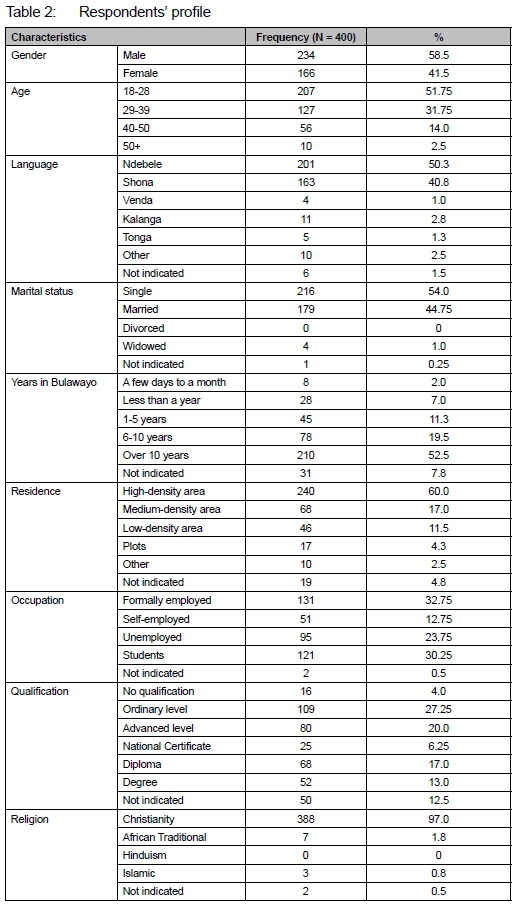
The task beforehand was not only to understand the sensory expectations of these dominant groups, but also to determine the users of the public spaces and those groups that are underrepresented, so that an attempt can be made to attract the latter to the public spaces. The findings provide the decision-makers with a background of the demographic information that may be harnessed to bring inclusivity into public space use.
5.2 Overall sensory quality of public space
Table 3 shows the MS ratings and central tendency for sensory quality of streets and parks where scores less than three indicate a bad user sensory experience and a cause of concern. It represents an unpleasant sensory experience of the public space.
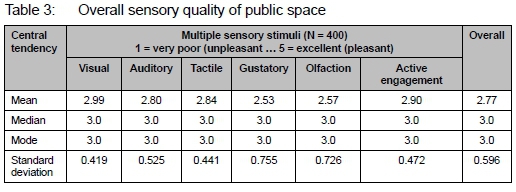
With an overall MS of 2.77, results in Table 3 show that the sensory quality of streets and parks is below the mean value of 3.00 (fair). Based on the mean scores and standard deviation (higher score, spread away from average of 3.00), respondents perceived the quality of public space as poor, especially for the gustatory quality (MS=2.53; SD=0.755), the olfactory quality (MS=2.57; SD=0.726), and the auditory quality (MS=2.80, SD=0.525). Visual quality (MS=2.99; SD=0.419), tactile quality (MS=2.84; SD=0.441), and active engagement (MS=2.90; SD=0.472) were perceived slightly more positive.
This finding is consistent with the general assertion that design has always been driven by the hegemony of the eye, which is both a problem and one justification of this study which sought to bring a multisensory dimension with reference to the quality of public space.
5.3 Overall sensory quality rating of streets and parks
Table 4 shows the overall sensory rating for parks and streets. Of the public space users, 295 (73.75%) rated the overall sensory quality for parks and streets as 'fair', while 24% of the users (96 respondents) rated it as poor, and only two (0.5%) rated it as very poor. Of the participants, 65 (16.25%) rated the parks as poor and very poor, while a smaller number 33 (8.25%) rated the same for streets. More participants, 163 (40.75%), rated streets as fair, compared to 132 (33%) who reported the same for parks.
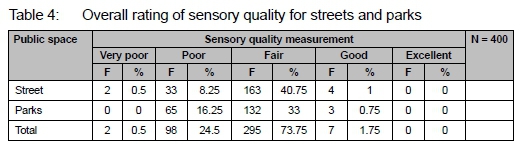
Only four (1%) rated the streets as good, compared to three participants (0.75%) who rated the same for parks. No user rated any sensory category to be excellent for both parks and streets. Drawing from these findings, the general sensory quality of the streets was regarded as better than that of the public parks. While the quality of both streets and parks needs improvement, more attention must be paid to the parks.
5.4 Individual sensory quality rating of streets and parks
Table 5 shows the quality ratings for individual sensory modes of street and parks. Generally, the 'fair' rating dominated throughout all the sensory modes for parks and streets, followed by the 'poor' rating, and lastly the 'good' rating.
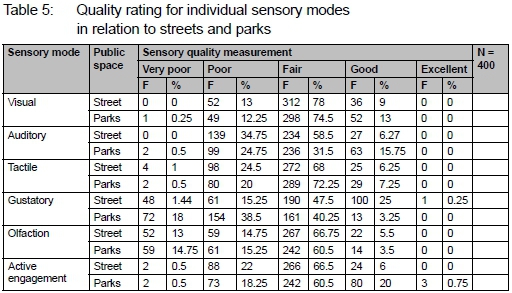
There were exceptional scenarios where the rating for 'good' dominated the 'poor' rating; for example, the active engagement in parks (good, 20%; poor, 18.25%); gustatory quality in streets (good, 25%; poor, 15.25%), and visual quality in the parks (good, 13%; poor, 12.25%). On the 'very poor' rating, the gustatory category in the parks presents the least-performing sensory mode (highest number of complainants, 18%) and the same on the 'poor' rating (highest number of complainants, 38.5%). On the 'good' rating, the gustatory mode in the streets was labelled as the best (highest percentage of 25%). While the gustatory quality was generally the worst of all the sensory modes, it was better for the streets compared to that of the parks. The absence of sale points, where diverse and fresh products were sold, the number and distribution of bins and toilets, and poor eating environments, among other factors, may have led to the lower gustatory quality of parks compared to the streets. The visual quality of the streets had the highest rating under 'fair' (78%).
5.5 Inferential statistics: Comparing groups of respondents
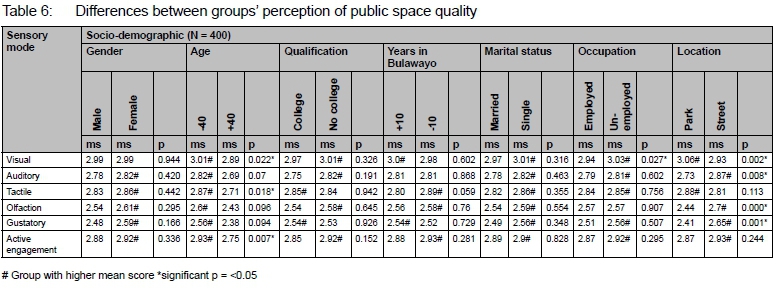
The independent-samples t-test was used to show the difference on the perception of the sensory quality of the public space between groups of respondents at the time of the interviews.
Table 6 shows that there was a significant difference between the perceptions of participants from streets and parks regarding auditory (Ms=2.87, p=0.008), olfactory (Ms=2.70, p=0.000), and gustatory (Ms=2.65, p=0.001) quality. This shows that the participants interviewed from the street or avenue generally found the sensory quality of the streets and public parks to be better, compared to those interviewed from the public parks. One explanation is that the quality of the street environment that participants would have experienced at the time of the interviews was better, thus influencing the positive rating, while the worse environment at the parks influenced a negative rating. Participants interviewed from the public parks were happier than those interviewed at the street or avenue only in terms of the visual quality of the public space (public parks, Ms=3.06; street and avenue, Ms=2.93) and tactile quality of the public space (public parks, Ms=2.88; street and avenue, Ms=2.81). However, participants from both the parks and the streets found the overall sensory quality of the public space to be displeasing (poor to fair).
There was a significant difference between the perceptions of the older and younger participants regarding visual quality (Ms=3.01, p=0.022), tactile quality (Ms=2.87, p=0.018), and active engagement (Ms=2.93, p=0.007). Overall, the older age group was less satisfied about the quality of the public space under study, compared to their younger counterparts. The younger age group found the visual quality of public space to be slightly above fair (Ms=3.01), while the older age group found it to be less than fair (Ms=2.89). One explanation is based on the past experience of the older generation when the Bulawayo public space was previously in a better state and how it has deteriorated in their opinion.
Besides visual quality, the females experienced the sensory quality as more positive than the males. With Ms below 3.0, both males and females were not happy with the quality of the streets and parks under study. Overall, single and unemployed participants experienced public space quality as more positive than married and employed participants, but with Ms below 3.0, these participants agreed that the quality of the public space was less than fair, based on all modes, except the view of the unemployed on visual quality (Ms=3.03). Students, as part of the unemployed, spend their time in the public parks doing schoolwork, taking advantage of the favourable environment.
The differences between group perceptions on public space were expected, since they are confirmed in studies such as that of Mehta (2014: 81-83). This study not only tested and confirmed such differences scientifically, but also found a new non-demographic factor that influences the perception of place quality, namely location. The location of respondents during assessment is an outstanding factor whose effect has to be tested and understood by space managers. This demographic grouping approach was necessary in influencing policy, since it singles out the expectations and aspirations of different groups with scientific evidence and thus paves the way for inclusive public space. This approach is anchored in the assertion by Porteous (1977, in Konisranukul 2007:104) that "several studies of perception, attitudes and preferences reveal that strong generalisations can be made on a group basis".
The new public space quality measuring tool tested can thus be used to propose a new 'Sensory Public Space Quality Framework' for measuring public space quality.
6. MULTISENSORY PUBLIC SPACE QUALITY PRINCIPLES AND FRAMEWORK
In an attempt to emphasise the importance of multisensoriality, how people interact with environmental stimuli and how public space planners can pictorially display public space quality field results, this article proposed a Sensory Public Space Quality Framework comprising six aspects that constitute a multisensory public space environment (Figure 7). Conceptually, the framework can be displayed as follows: public space sensory environment - multisensory experience - the human being.
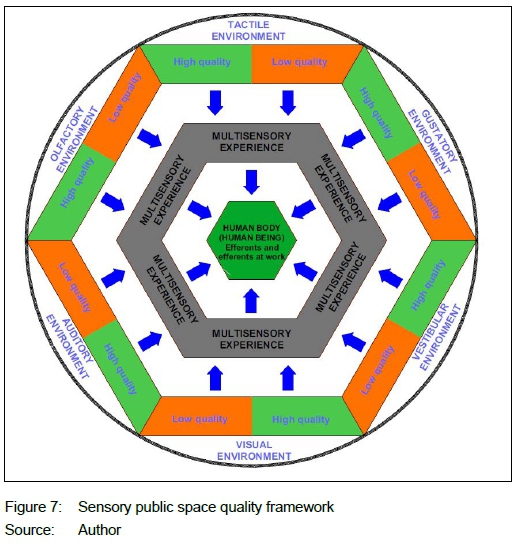
The framework shows that the consumer of space (the human being) is bombarded by various sensory experiences, both simultaneously and sequentially, as shown by the blue arrows. Figure 7 further shows that the human afferents are in operation in response to environmental stimuli. The framework shows an ideal fair public place (a mean of three on a 5-point scale), where the high quality (green colour, a mean of five) and poor quality (red colour, a mean of one) result in the neutral quality. The ideal public space quality is when the high quality dominates the low quality under each sensory environment as measured and reported by the users. A mean of five for all the sensory modes will be denoted by a continuous green band (without the orange), while a mean of one will be a continuous red band (without green). The pleasurability of the user's experience is dependent on the sensory potential and sensory detail of the environment. Where the sensory experience is a displeasure, the human suffering is inescapable from the negative bombardment.
The circumscribed multisensory hexagon shape of the public space sensory framework can be explained as follows. The six-sided shapes expose and emphasise the six aspects of public space quality and the need to satisfy them. The circular nature of the boundary shows that human beings are surrounded and cannot escape the public space environment experience exhibited by six sensory environments, because the outdoors differs from the indoors where people may choose whether to enter or not.
The proximal or near-space senses (tactile, olfactory, and gustatory) are deliberately placed at the top part of the hexagon, while the distal or far senses (auditory, visual, and vestibular) are located in the bottom part. One reason is based on the literature that the proximal senses are more intimate to the human being; yet they receive less attention compared to the distal senses. The tactile sense, which is important because its sensory receptors cover the whole body, is the topmost. This positioning is also consistent with Pallasmaa's (2005: 4, 9) emphasis on the supremacy of the haptic realm and that it is the 'mother of all senses'; all other senses are an extension to it. Hapticity gives a sense of nearness, intimacy and touch to people, but has long been suppressed at the expense of the eye. Due to the long received excessive attention at the expense of the other senses, the visual sensory mode is the bottommost. Another reason is based on the finding that the visual quality is the best in terms of performance of the Bulawayo public space, but it is not in direct contact with people, while the gustatory quality and the olfactory have been performing poorly. The poorest performance of the gustatory quality was least expected in light of Wojnarowska's (2016: 90) observation that gastronomy is a growing sector in contemporary times.
The structure of the framework was thus meant to raise awareness for attention towards the sensory modes that have received minimal attention in research, planning and design and/ or those that practically perform badly, for consideration in order to correct the existing situation that has proven to be problematic. The arrangement of the sensory principles is meant to discover the neglected senses. Based on the assessment results and the performance of individual sensory modes, cities may place the individual sensory environment at the relevant position in the hexagon. Even within one city, the position of the individual sensory environment may change over time, depending on the performance of individual senses. The flexibility allows the responsible authorities to continue checking the sensory performance of each sensory mode, without neglecting any of the senses at any given time. Similar to Varna and Tiesdell's (2010) Star Model and Mehta's (2014) Public Space Index, this framework provides a pictorial presentation that can be readily understood.
7. CONCLUSION
This article paid less attention to the results, but rather to the methodology and, in particular, the multisensory public space quality tool in line with the objectives of the article: to develop and test the tool, categorise demographics groups, and present a framework. The results are only a product of testing the tool. The conclusion is, therefore, a summary of evidence that supports the tool and provision of guidance to public space planners on how to implement the tool.
The multisensory public space quality tool (Table 1) is based on the six sensory quality principles that neatly articulate or classify public-space quality components and provides clear-cut criteria and indicators (stimuli/themes) with a sensory origin. Being sensory comprehensive, the principles can potentially satisfy the sensory experience of the whole human body and everybody, thus contributing to an inclusive public space. The six most important senses present an opportunity for an integrated understanding of the world and comprehensive design. The tool and, in particular, the 14 sensory stimuli are flexible and can be customised to suit the assessment of any public space. The tool was tested and successfully produced scientific results that were analysable through both descriptive and inferential statistics. As demonstrated in this article, the tool is usable both for quantitative research as a quantitative assessment instrument by public space users and experts, and for qualitative research as an observation guide and interview guide for the same public space or a separate qualitative study (Cresswell, 2014).
In summary of the procedures followed in the implementation of the tool, public space planners, given the task to assess public space and after defining the study area, will start with a qualitative pilot survey. The pilot survey allows the planners to appreciate the study area, its users and their activities and thus identify the quality aspects that must inform the tool - whether to add, subtract sensory stimuli/themes or use them as is. The counting is done in a systematic manner, since it is the basis for scientific sampling. The third stage is systematic sampling for study sites and participants. The fourth stage is conducting the assessment with the users, using the tool in a scientific manner, the guidance of which engrained within the tool. The next stage is the analysis of data and presentation in the form of descriptive and inferential statistics, and, overall, in the form of a Sensory Public Space Quality Framework, through which meanings, conclusion and actions about the public space quality can be derived. The same tool can also be used to carry out a qualitative study to enrich and explain quantitative findings, which may be the sixth stage.
The methodology and, in particular, the scientific tool, the principles and the framework can be useful tools to assess and measure the sensory performance of existing and new public space policies; design proposals; post-occupancy evaluation of public parks, streets, squares, the outdoors of shopping and pedestrian malls, and precincts; the evaluating of other professionals' work, preparation of master, local and layout plans, and day-to-day management of public space. Given the scientific nature of the processes and results, built environment professionals can now base their decisions on objective judgements of place quality through a sensory comprehensive approach, without bias, on both the visual sensory mode and expert opinion, but guided by the full users' sensory experience and aspirations. The approach can be used to determine the quality of a given public space, compare the quality of different spaces (street and street or parks and streets), and compare the quality of a given public space over time. Through this approach, information on the different social groups of users was used as a criterion for analysing survey results through scientific tests of psychological claims, which was not the case with the existing approaches. This approach made the study rare, as it was scientifically embedded through a link between the built environment and psychology. By testing if what is said for people in social sciences is also true in the context of the built environment. The findings of the study can be generalizable to the four study areas.
The article has enriched the academic research process for environmental behaviour studies by undertaking systematic sampling, following its scientific laws, despite the elusive and unknown public space population. The major contribution of this article has to do with improvements of the Central Park Conservancy in New York's (2011) approach to include the estimation of the number of daily users of public space and fixed sampling intervals. In comparison to prior quality measuring tools, this approach ensures that the users of the public space dominate the assessment both in terms of their numbers and in terms of influencing the quality factors to be used for measurement during the pilot stage, with experts merely facilitating the process - values of the experts were suppressed by all means possible, although they cannot be totally taken away. The comprehensive nature of the multisensory approach is sure to cater for most of the quality dimensions and needs in public space suggested by prior literature and measurement tools. For example, non-physical components of public space such as 'safety' is one of the themes incorporated directly into the tool, while other dimensions can still be incorporated; 'comfort', 'publicness', and 'animation', among others, are included indirectly within the tool, and sensory complexity is actually extended to encompass almost all the public space needs and dimensions. 'Inclusiveness', for example, was presented through the results by comparing groups of respondents. The physical components of public space such as buildings and outdoor elements are captured and can each be tested for multisensoriality using the tool and, in particular, the six quality components.
8. FUTURE RESEARCH
Future research is required to test this tool in different environments to refine and sharpen the tool in order to improve public space quality. A study that involves the assessment of public space quality using this tool for both users and experts and the qualitative assessment using the same tool is likely to provide interesting results.
REFERENCES
AIGA DC. 2018. Talking with Ellen Lupton about tactile design. [Online]. Available at: <https://dc.aiga.org/talking-with-ellen-lupton-about-tactile-design/> [Accessed: 1 September 2019]. [ Links ]
AKINTOYE, A. & MAIN, J. 2007. Collaborative relationships in construction: The UK contractor's perception. Engineering, Construction and Architectural Management, 14(6), pp. 597-617. http://dx.doi.org/10.1108/09699980710829049 [ Links ]
BERGNER, S., BERGNER, J-P.E., MEMMEL, M., RASLAN, R., TAHA, D., TALAL, M. & ZEILE, P. 2013. Human sensory assessment methods in urban planning - A case study in Alexandria. In: Schrenk, M. Popovich, V.V., Zeile, P. & Elisei, P. (Eds.), Proceedings REAL CORP 2013 Tagungsband, 20-23 May 2013, Rome, Italy, pp. 407-417. [ Links ]
BHATTACHERJEE, A. 2012. Social science research: Principles, methods and practices. 3rd edition. University of South Florida, Tampa, Florida, USA. [ Links ]
BRESLIN, P.A.S. 2013. An evolutionary perspective on food and human taste. Current Biology, 23(9), pp. 409-418. https://doi.org/10.1016/j.cub.2013.04.010. [ Links ]
CAFUTA, M.R. 2015. Open space evaluation methodology and three dimensional evaluation model as a base for sustainable development tracking. Sustainability, 7(10), pp.13690-13712. https://doi.org/10.3390/su71013690. [ Links ]
CARMONA, M., TIESDEL, S., HEATH, T. & OC, T. 2010. Public places - urban spaces: The dimensions of urban design. 2nd edition. Oxford: Elsevier. [ Links ]
CARR, S., FRANCIS, M., RIVLIN, L.G. & STONE, A.M. 1992. Public Space. Environment and behviour series. Cambridge, University Press. [ Links ]
CASTRO, J.B., RAMANATHAN, A. & CHENUBOTLA, C.S. 2013. Categorical dimensions of human odor descriptor space revealed by non-negative matrix factorisation. PLos ONE (8), p. 9. https://doi.org/10.1371/journal.pone.0073289. [ Links ]
CENTRAL PARK CONSERVANCY, INC. 2011. Report on the public use of Central Park. New York. [ Links ]
CORBIN, C. 2006. Sex differences in taste preferences in humans. A critical literature review submitted in partial fulfilment of the requirements for senior research thesis. Spartanburg, South Carolina: Wofford College. [ Links ]
CRESWELL, J.W. 2014. Research design: Qualitative, quantitative and mixed methods approaches. 4th edition. London: Sage. [ Links ]
CHRISTOPHER, A.N. 2016. Interpreting and using statistics in psychological research. SAGE Publications. [ Links ]
CRESWELL, J.W. & PLANO-CLARK, V.L. 2011. Designing and conducting mixed methods research. 2nd edition. Thousand Oaks, California: Sage Publication. [ Links ]
DAHIRU, T. 2008. P-value, a true test of statistical significance? A cautionary note. Annals of Ibadan Postgraduate Medicine, 6(1), pp. 21-26. [ Links ]
DALY, L., FARAHANI, M., HOLLINGSBEE, T. & OCAMPO, R. 2016. Measuring human experiences of public spaces: A methodology in the making. Conscious Cities Journal, vol.1, pp.1-12. [ Links ]
FRANCIS, M. 1989. Control as a dimension of public space quality. In: Alterman, I. & Zube, E.H. (Eds). Public places and spaces. Plenum Press, New York, pp. 147-172. https://doi.org/10.1007/978-1-4684-5601-1_7. [ Links ]
FREELAND, C. 2012. Aesthetics and the senses: Introduction. Essays in Philosophy, 13(2), pp. 399-404. https://doi.org/10.7710/1526-0569.1427. [ Links ]
GALLACE, A. 2012. Living with touch. Senses, 25(12), pp. 896-899. [ Links ]
GEHL, J. 1989. A changing street life in a changing economy. Places 6(1), pp. 8-17. [ Links ]
GILLESPIES. 2007. Places matter: Creating inspirational spaces: A guide for quality public realm in the northwest. Northwest Regional Development Agency, United Kingdom and RENEW Northwest. [ Links ]
GRAHN, P. & STIGSDOTTER, U.K. 2010. The relation between the perceived sensory dimensions of urban green space and stress restoration. Landscape and Urban Planning, 94(3-4), pp. 264-275. https://doi.org/10.1016/j.landurbplan.2009.10.012. [ Links ]
HERSSENS, J. & HEYLIGHEN, A. 2008. Haptics and vision in architecture: Designing for more senses. In: Lucas, R. & Mair, G. (Eds). Proceedings of the Conference on Sensory Urbanism, 16-18 January University of Strathclyde. Glasgow, UK: The Flaneur Press, pp. 102-112. [ Links ]
HARVEY, A. 2009. Designing and delivering public realm plans. Heritage Officers Training Seminar, Clonmel, 23 June 2009. The Heritage Council. [ Links ]
HEALEY, P. 2010. Making better places: The planning project in the twenty-first century. Hampshire: Palgrave MacMillan. https://doi.org/10.1007/978-1-137-01379-8. [ Links ]
HOWES, D. (Ed.). 2005. The aesthetics of mixing the senses. Cross-modal aesthetics. Concordia University, Montreal. [ Links ]
ISRAEL, G.D.1992. Determining sample size. Florida: University of Florida. [ Links ]
JACOBS, J. 1961. The death and life of great American cities. New York. Random House. [ Links ]
KASSCHAU, A.R. 2003. Understanding psychology. Columbus Ohio: McGraw Hill. [ Links ]
LINDBORG P. 2016. A taxonomy of sound sources in restaurants. Applied Acoustics, vol. 110, pp. 297-310. https://doi.org/10.1016/j.apacoust.2016.03.032. [ Links ]
LYNCH, K. 1960. The image of the city. Massachusetts: Institute of Technology and the President and Fellows of Harvard College. [ Links ]
MALEK, N.A., MARIAPAN, M., SHARIFF, M.K.H. & AZIZ, A. 2010. Assessing the quality of green open spaces: A review. Paper delivered but not published at the Inaugural International Healthy Parks Healthy People Congress 11-16 April 2010. Melbourne Convention and Exhibition Centre. [ Links ]
MALEK, N.A., MARIAPAN, M. & SHARIFF, M.K.M. 2012. The making of a quality neighbourhood park: A path model approach. Procedia - Social and Behavioral Sciences, vol. 49, pp. 202-214. https://doi.org/10.1016/j.sbspro.2012.07.019. [ Links ]
MAPSLAND, 1982. Detailed political and administrative map of Zimbabwe with relief, roads, railroads and major cities-1982. [Online]. Available at: <https://www.mapsland.com/africa/zimbabwe/detailed-political-and-administrative-map-of-zimbabwe-with-relief-roads-railroads-and-major-cities-1982> [Accessed: 1 September 2019]. [ Links ]
MCGLONE, F., WESSBERG, J. & OLAUSSON, H. 2014. Discriminative and affective touch: Sensing and feeling. Neuron, 82(4), pp. 737-755. https://doi.org/10.1016/j.neuron.2014.05.001. [ Links ]
MBIBA, B. & NDUBIWA, M. 2009. Decent construction and the role of local authorities: The case of Bulawayo city, Zimbabwe. Research report prepared for the Urban and Peri-Urban Research Network (Peri-NET). [ Links ]
MEHTA, V. 2007. A toolkit for performance measures of public space. Paper delivered at the 43rd ISOCARP Congress, 19-23 September Antwerp, Belgium. [ Links ]
MEHTA, V. 2014a. Everyday social behaviour as a basis for design. In: Urban design: Tools & resources for the planning practitioner. Oxford, UK: Routledge, Taylor and Francis, pp. 105-115. [ Links ]
MEHTA, V. 2014b. Evaluating public space. Journal of Urban design, 19(1), pp. 53-88. https://doi.org/10.1080/13574809.2013.854698. [ Links ]
MOUGHTIN, C. 2003. Urban design: Street and square. 3rd edition. Oxford: Butterworth Architecture. [ Links ]
MULEYA, N. 2019. Sensation and perception: An exploration of human multi-sensory experiences and preferences to enhance public space planning policy and practice in the City of Bulawayo, Zimbabwe. Unpublished thesis (PhD, Urban and Regional Planning). Bloemfontein: University of the Free State. [ Links ]
MUNZWA, K. & WELLINGTON, J. 2010. Urban development in Zimbabwe: A human settlement perspective. Theoretical and Empirical Research in Urban Management, 5(14), pp. 120-146. [ Links ]
NAOUM, S.G. 2013. Dissertation research and writing for construction students. 3rd edition. Oxford: Butterworth-Heinemann. https://doi.org/10.4324/9780203720561 [ Links ]
NDLOVU, I. 2015. Life experiences of street children in Bulawayo: Implications for policy and practice. Unpublished thesis (PhD) Milton Keynes, United Kingdom: Open University. [ Links ]
NEW MASTER PLANNING LIMITED. 2008. Public realm strategy: Stroud Town Centre. Poole, England. [ Links ]
PALMER, S.E., SCHLOSS, K.B. & SAMMARTINO, J. 2013. Visual aesthetics and human preference. Annual Review of Psychology, 64(1), pp. 77-107. https://doi.org/10.1146/annurev-psych-120710-100504. [ Links ]
PALLASMAA, J. 2005. Touching the world: Architecture, hapticity and the emancipation of the eye. Keynote address [ein Vortrag für die HfbK Hamburg, April 2004]. In Auf der Suche nach einer Theorie der Architektur, 15. [ Links ]
POLAT, E. 2009. A 'new and soft' urban planning paradigm: The strategic spatial planning. Isparta, Turkey: Suleyman Demirel University, Department of City and Regional Planning. [ Links ]
PROJECT FOR PUBLIC SPACES. 2012. Placemaking and the future of cities. UN-Habitat Sustainable Urban Development Network. [ Links ]
RAD, V.B. & NGAH, B.I. 2014. Assessment of quality of public urban spaces. Science International (Lahore), 26(1), pp. 335-338. [ Links ]
RIO, D.V. 2004. Urban design and the future of public space in Brazilian City. The Journal of Planning Practice and Education, 1(1), pp. 33-42. https://doi.org/10.15368/focus.2004v1n1.7. [ Links ]
ROE, M., HERLIN, I.S. & SPEAK, S. 2016. Identity, food and landscape character in the urban context. Landscape Research, 41(7), pp. 757-772. https://doi.org/10.1080/01426397.2016.1212324. [ Links ]
SHOLIHAH, A.B. & HEATH, T. 2016. Assessing the quality of traditional street in Indonesia: A case of Pasar Baru Street. Social and Behavioural Sciences, vol. 234, pp. 244-254. https://doi.org/10.1016/j.sbspro.2016.10.240. [ Links ]
SIREGAR, J.P. 2014. Assessment of public space quality using good public space index (case study of Merjosari sub district, Municipality of Malang, Indonesia). Procedia - Social and Behavioral Sciences, vol. 135, pp.10-17. https://doi.org/10.1016/j.sbspro.2014.07.318. [ Links ]
SNYDER, J.C. & CATANESE, A.J. 1979. Introduction to architecture. New York: McGraw Hill. [ Links ]
TEDDLIE, C. & YU, F. 2007. Mixed methods sampling: A typology with examples. Journal of Mixed Methods Research, 1(1), pp. 77-100. https://doi.org/10.1177/1558689806292430. [ Links ]
TONNELAT, S. 2010. The sociology of urban public space. In: Wang, N., Savy, M. & Zhai, G. (Eds). Territorial evolution and planning solutions: Experiences from China and France. Proceedings of the first Sino-French Urban, Regional and Planning Symposium. Paris: Atlantis Press, pp. 1-10. [ Links ]
TRIP, J.J. 2007. Assessing quality of place: A comparative analysis of Amsterdam and Rotterdam. Journal of Urban Affairs, 29(5), pp. 501-517. https://doi.org/10.1111/j.1467-9906.2007.00362.x. [ Links ]
UK CLIMATE IMPACTS PROGRAMME. 2016. (Ed. Turner, B.D.) Multi-sensory design - creating healthier public spaces. Feeling good in public spaces dialogue series. UKCIP, University of Oxford. [ Links ]
UN-HABITAT (United Nations Human Settlements Programme). 2016. Urbanisation and development: Emerging futures. World Cities Report 2016. Nairobi, Kenya: UN-Habitat. [ Links ]
VARNA, G. & TIESDELL, S. 2010. Assessing publicness of public space: The star model of publicness. Journal of Urban Design, 15(4), pp. 575-598. https://doi.org/10.1080/13574809.2010.502350. [ Links ]
WADE, C. & TAVRIS, C. 2012. Invitation to psychology. 5th edition. Boston: Prentice Hall. [ Links ]
WEGNER, T. 2012. Applied business statistics methods and excel-based applications solutions manual. 4th edition. Cape Town, South Africa: Juta. [ Links ]
WHITE, E. 1999. Path-portal-place. In: Carmona, M. & Tiesdel, L. (Eds.), Urban design reader. Oxford: Elsevier. [ Links ]
WILLEMSE, L. & DONALDSON, R. 2012. Community Neighbourhood Park (CNP) Use in Cape Town's Townships. Urban Forum vol. 23, pp. 221-231. https://doi.org/10.1007/s12132-012-9151-3. [ Links ]
WOJNAROWSKA, A. 2016. Model for assessment of public space quality in town centres. European Spatial Research and Policy, 23(1), pp. 81-109. https://doi.org/10.1515/esrp-2016-0005. [ Links ]
YIN, R. 2014. Case study research: Design and methods. 5th edition. Thousand Oaks, CA: SAGE Publications. [ Links ]
ZIMBABWE NATIONAL STATISTICS AGENCY 2012. Zimbabwe in maps: A census atlas. Harare: Government of Zimbabwe. [ Links ]
ZIMBABWE NATIONAL STATISTICS AGENCY 2015. Compendium of statistics. Government of Zimbabwe. [ Links ]
Peer reviewed and revised February 2020
Published June 2020
The authors declared no conflict of interest for this title or article

