


Services on Demand
Article
 English (pdf)
 Article in xml format
 Article references
Indicators

Related links
-
 Cited by Google
 -
 Similars in Google
Share

 Permalink
Town and Regional Planning
On-line version ISSN 2415-0495
Print version ISSN 1012-280X
Town reg. plan. (Online) vol.73 Bloemfontein 2018
http://dx.doi.org/10.18820/2415-0495/trp73.4
ARTICLES
Sun, shade and natural daylight in South African town planning, with emphasis on Pretoria
Son, skaduwee en natuurlike daglig in Suid-Afrikaanse stadsbeplanning, met klem op Pretoria
Letsatsi, moriti le tjhabo ya letsatsi e tlwaelehileng Afrika Borwa bakeng sa moralo wa toropo, re itshetlehile hodima tshwane (Pretoria)
Dirk Conradie
Ph.D., Senior Researcher, Building, Science and Technology, CSIR Built Environment Unit, PO Box 395, Pretoria. 0001. Phone: (012) 841 2551, Mobile: 072 203 7960, Email: <dconradi@csir.co.za>
ABSTRACT
A bioclimatic analysis of different South African towns and cities indicates that, if the correct mix of passive design principles is used, they all have a significant passive design potential. Of all such measures, solar protection and shading is the single most important passive design measure to reduce energy usage and to improve internal comfort for buildings in all South African climatic regions. The correct design of public open spaces and streets facilitates, to a great extent, energy-efficient buildings, whilst at the same time providing functional and comfortable urban open spaces and streets. Passive solar buildings aim to maintain interior thermal comfort throughout the sun's diurnal and annual cycles, whilst reducing the requirement for active heating and cooling systems. The aim of this article is to investigate the effect of climate zones on passive design potential, of which shading design is an integral part, using Pretoria as a case study. This includes the effect of street width, building height, street layout, orientation, and the amount of sunlight available for trees and plants in the urban environment. The Spatial Planning and Land Management Act (2013), City of Tshwane Land Use Management By-law (2016) and the Tshwane Town-Planning Scheme 2008 (Revised 2014) were used as regulatory framework. To support the research, an Early Design Phase (EDP) experimental research platform was used to investigate the amount of sunlight on building facades with different orientations. This method enables the calculation of shading angles where there is a balance between the hot periods (requiring cooling) and cool periods (requiring heating) from the urban and building perspective. This has been achieved by means of the development of analytical software that uses weather files as one of the inputs to calculate critical solar angles. Over and above the calculation of current building solar protection angles, this method also facilitates the calculation of the increase in solar protection that will be required with climate change such as with the expected A2 climate change scenario (business-as-usual scenario) for South Africa. To support the EDP analysis, detailed simulations were also undertaken by means of Ecotect v5.60.
Keywords: Cities, climate change, natural daylight, shade, sun, South Africa
ABSTRAK
'n Bioklimatologiese analise van verskillende Suid-Afrikaanse stede en dorpe toon aan dat, indien die korrekte kombinasie van passiewe ontwerpbeginsels gebruik word, hulle almal 'n aansienlike passiewe ontwerp potensiaal het. Van al hierdie maatreëls is sonbeskerming en skaduwee een van die belangrikste passiewe ontwerpmaatreëls om energieverbruik en interne gerief in geboue te verbeter in alle Suid-Afrikaanse klimaatstreke. Die korrekte ontwerp van publieke oopruimtes en strate kan die bereiking van energie-effektiewe geboue bevorder en terselfdertyd funksionele en gerieflike stedelike oopruimtes en strate voorsien. Passiewe songeboue streef daarna om interne termiese gerief dwarsdeur die son se daaglikse en jaarlikse siklusse te bevorder en terselfdertyd die nodigheid vir aktiewe verhittingen verkoelingstelsels te verminder. Die doel van hierdie artikel is om die effek van klimaatsones op passiewe ontwerp potensiaal te bestudeer, waarvan skaduwee ontwerp 'n integrale deel is, met Pretoria as 'n gevallestudie. Dit sluit in die effek van straatwydte, gebouhoogte, straatuitleg, oriëntasie en die hoeveelheid sonlig wat beskikbaar is vir bome en plante in die stedelike omgewing. Die wetlike raamwerk van die Spatial Planning and Land Management Act (2013), City of Tshwane Land Use Management By-law (2016) en die Tshwane Town-Planning Scheme 2008 (Revised 2014) is as regulatoriese raamwerk gebruik. Ter ondersteuning van die navorsing is 'n Vroeë Ontwerpfase (VOF) eksperimentele navorsingsplatform gebruik om die hoeveelheid sonlig op geboufasades met verskillende oriëntasies te ondersoek. Hierdie metode maak dit moontlik om skaduweehoeke te bepaal waar daar 'n balans tussen die warm (wat verkoeling benodig) en koel (wat verhitting benodig) periodes vanuit die stedelike en gebouperspektief. Dit is bereik met die ontwikkeling van analitiese programmatuur wat weerleêrs gebruik as een van die insette om kritieke sonhoeke te bepaal. Bo en behalwe die berekening van huidige sonhoeke, fasiliteer hierdie metode ook die berekening van die vermeerdering van sonbeskerming wat benodig sal word met klimaatverandering met die verwagte A2 klimaatsveranderingscenario (besigheid soos gewoonlik) vir Suid-Afrika. Die VOF analise is ondersteun met gedetaileerde simulasie met behulp van Ecotect v5.60.
Sleutelwoorde: Klimaatsverandering, natuurlike daglig, son en skaduwee, stede, Suid-Afrika
TUMELO
Tlhatlhobo ya ditoropo le metsemeholo e fapaneng ya Afrika Borwa, e etswang ka mokgwa wa tlelaemete (mohatsela/ mofuthu wa naha) ya tse phelang "bioclimate", e bontshang hore ha ho ka sebediswa motswako o nepahetseng wa melawana ya moralo wa toropo, tsena kaofela di ka ba le bokgoni bo matla ba moralo o hlokahalang. Hotswa mekgweng eo kaofela, tshireletso ya motlakase o fumanang matla letsatsing (solar) le moriti, ke wona moralo o le mong o bohlokwa ka ho fetisisa bakeng sa ho fokotsa tshebediso ya motlakasi le ho matlafatsa boiketlo bakeng sa meaho yohle diterekeng tse angwang haholo ke tlelaemete Afrika Borwa. Moralo o nepahetseng wa dibaka tse sa sebedisweng le diterata/ditsela o etella pele meaho e nang le tshebediso e nepahetseng/ntle ya motlakase, ka nako yona eo; e ntse e fana ka dibaka tsa toropo tse sa sebedisweng le diterata/ditsela tse sebetsang le tse phutholohileng. Meaho e sebedisang motlakase o fumanang matla letsatsing, e ikemiseditse ho baballa boiketlo bo kahare ba motjheso wa nakong yohle ya letsatsi le motshehare, le nakong yohle ya selemo, ka yona nako eo ba ntse ba fokotsa tlhoko ya morero o sebetsang wa ho futhumatsa le ho hatsetsa. Maikemisetso a atikele ena ke ho hlahloba tshwaetso/kgahlamelo ya mabatowa/dizounu tse angwang ke tlelaemete hodima bokgoni ba moralo, moo teng ho etsa moriti e leng karolo ya bohlokwa, ho sebediswa Tshwane (Pretoria) jwalo ka thuto ya mehlala (case study). Sena se kenyelletsa tshwaetso/kgahlamelo ya bophara ba seterata, bophahamo/botelele ba moaho, moralo wa seterata, maikemisetso le bongata ba kganya ya letsatsi e teng bakeng sa difate le dijalo tikolohong ya toropo. Molao wa Moralo wa Sepakapaka le Taolo ya Lefatshe wa 2013 (Spatial Planning and Land Management Act (2003), Molawana wa toropo ya Tshwane wa Tshebediso ya Lefatshe wa 2016 (City of Tshwane Land Use Management By-law (2016) le Morero wa Tshwane wa Moralo wa toropo wa 2008 (the Tshwane Town-Planning Scheme 2008) (O boeleditsweng ka 2014), di sebedisitswe jwalo ka moralo wa taolo. Ho tshehetsa dipatlisiso, sethala (platform) sa diteko sa Early Design Phase (EDP) se sebedisitswe ho fuputsa/hlahloba bongata ba kganya ya letsatsi hodima bokapele ba meaho e nang le maikemisetso a fapaneng. Mokgwa ona o dumella tekanyetso ya dikgutlo tsa moriti moo ho nang le tekatekano dipakeng tsa dinako tsa motjheso (moo ho hlokahalang hore ho phole) le dinako tseo ho batang ka tsona (moo ho hlokahalang motjheso) ho ya kamoo toropo le kaho di bonahalang ka teng. Sena se fumanwe ka mokgwa wa ntshetsopele ya dinolo tsa manollo (software) tse sebedisang defaele tsa boemo ba lehodimo jwalo ka e nngwe ya diphehiso bakeng sa ho bala dikgutlo/mahlakore a bohlokwa a motlakase o fumanang matla a letsatsi. Ka hodima palo ya kaho ya hajwale ya mahlakore a sireletsang motlakase o fumanang matla a letsatsi, mokgwa ona hape o etellapele ho eketseha ha tshireletso ya motlakase o fumanang matla a letsatsi e tla hlokwa phethohong ya tlelaemete, jwalo ka tebello ya ketsahalo ya phethoho ya tlelaemete ya A2 (Ketsahalo ya mosebetsi jwalo ka ka mehla) bakeng sa Afrika Borwa. Ho tshehetsa manollo ena ya EDP, ditshusumetso tse nang le dintlha le tsona di ile tsa sebediswa ka tsela ya Ecotect v5.60.
1. BACKGROUND
Cities contribute significantly to global greenhouse gas emissions and are also adversely affected by the effects of climate change caused by these emissions such as the complex problem of Urban Heat Island (UHI) effect. At present, approximately half of the world's population lives in cities. That is likely to increase to 70% by 2050. Cities use as much as 80% of all energy production worldwide (The International Bank for Reconstruction and Development & World Bank, 2010: 15). To address this situation, a range of carbon emission mitigation strategies have been developed, including:
• Use of renewable energy.
• Commercial and residential energy efficiency.
• Solar water heater subsidy.
• Limits on less efficient vehicles.
• Passenger modal shift.
• Waste management.
• Land use.
• Escalating CO2 tax (Gibberd, 2015: 12).
According to UN-Habitat (2014: 1), there are Ave principles for sustainable neighbourhood planning:
• Adequate space for streets and an efficient street network.
• High density.
• Mixed land use.
• Social mix.
• Limited land-use specialization.
From 2007 to 2009, the recorded building plans passed by South African municipalities for residential buildings, non-residential buildings and additions totalled 61,939,720 m2, with a value of R 231 250 619 000 or approximately US $33,8 billion (using January 2011 exchange rates). These amounts indicate the extent of formal growth in the South African built environment, and the increasing contribution thereof to building activity on the African continent (Laubscher, 2011: 68). A study of the various regulations below indicates that there are hardly any or limited statutory regulations that can direct built environment development towards sustainability ideals. Furthermore, there is almost no integration between the town planning side and the national building regulations.
Three levels of design intervention can be distinguished, namely building, urban, and regional. Previous research indicates that, in a hot country such as South Africa, the most important factors at building level are building orientation, solar shading and penetration at appropriate times (Conradie, 2016: 38). The general principle is that the sun should help heat buildings in winter and, therefore, be allowed to penetrate the building at this time. However, in summer, the building and especially the windows should be protected against direct solar radiation. The appropriate use of glass is closely related to the latter. Other factors such as building shape, building depth, insulation, opening areas, air tightness and correct use of mechanical systems are also important. It is also beneficial to use cool roofs and surfaces in their various forms such as green, blue and reflective cool roofs (typically white roofs). At urban and regional level, the use of plants and street trees (Stoffberg, Van Rooyen, Van der Linde & Groeneveld, 2010: 9) is a good method to reduce the UHI, due to a combination of shade and evaporative cooling (Stoffberg et al., 2010: 9).
Table 1 indicates the Heating and Cooling Degree Day category in which the various cities and towns fall. Table 1 should be read in conjunction with Figure 1. Table 1 also quantifies the number of hours that solar protection will be beneficial, currently and with an A2 climate change scenario. The latter figures were calculated by means of a bioclimatic analysis with Climate Consultant 6.0, using weather files generated by means of Meteonorm v7.2.1. The results of a detailed bioclimatic analysis are listed below in Table 8.


2. INTRODUCTION
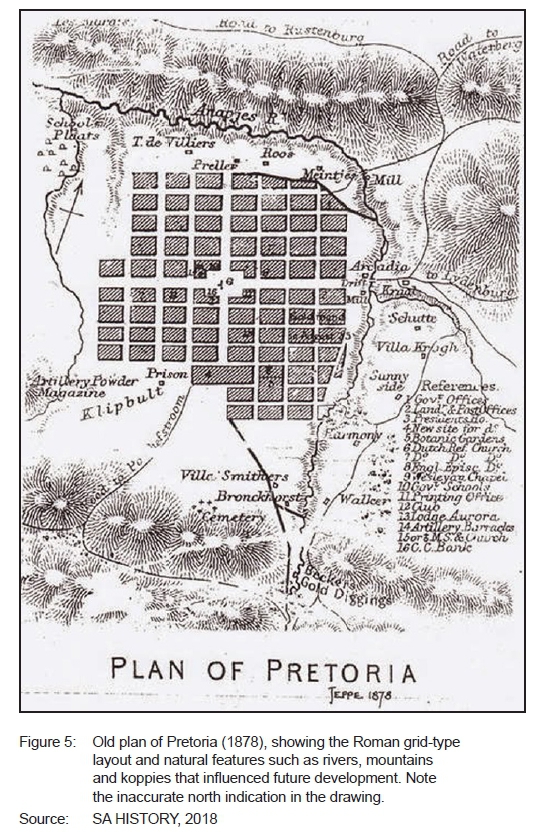
At about the same time that two prominent medieval European cities, Paris and Barcelona, were drastically transformed and improved, Pretoria was founded in 1855 by Marthinus Pretorius, who named the town after his father Andries Pretorius (Figure 5).
Any discussion of public open-space policy should start with the work of early pioneers such as Baron Georges-Eugène Haussmann, Prefect of the Seine from 1852 to 1869 during the Second Empire, the reign of Napoleon III (Barnett, 1982: 163). It included the demolition of medieval neighborhoods that were deemed overcrowded and unhealthy by officials at the time; the building of wide boulevards, new parks and squares; the construction of new sewers, fountains and aqueducts, as well as an innovative dual water supply system. Unfortunately, Haussmann's work was met with fierce opposition, and he was Anally dismissed by Napoleon III in 1870. Work on his projects continued until 1927. However, the current street plan and distinctive grand appearance of the center of Paris is, to a large extent, the result of Haussmann's renovation.
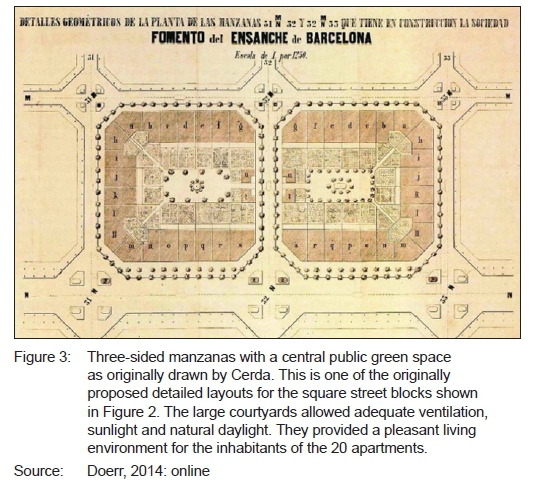
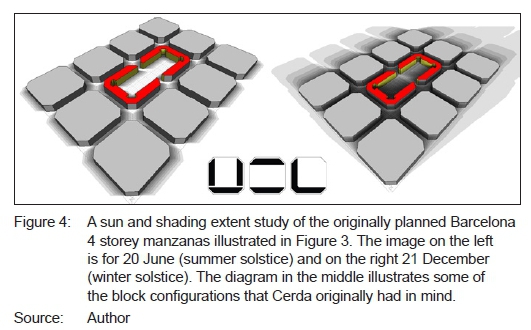
In approximately 1850, Barcelona was suffering from severe overcrowding, unsanitary conditions, a poor transportation network and heavy pollution as the entire city was confined by its medieval defensive walls in what currently remains intact as the Gothic Quarter (The Guardian, 2016; de la Pena, 2013: 45). With an unhealthy density of 856 inhabitants per ha, the city was experiencing rising mortality rates and life expectancy dropped to 36 years for the rich and 23 years for the working classes. Catalan engineer Ildefons Cerdà devised a plan to solve the problem with an ingenious grid of street blocks, nown at present as Eixample/Ensanche (meaning expansion). Cerdà avoided repeating past errors by undertaking a thorough study of how the working classes lived. He calculated the volume of atmospheric air a person would need to breathe. He documented the professions the population might follow and mapped the services they might require. Inter alia, he concluded that the narrower the city's streets, the more deaths occured. The street grid was turned at an unusual 45° from north in square block sizes of approximately 113.3 m x 113.3 m, in the vicinity of the famous Antoni Gaudi's Casa Mila building (Figures 2, 3 and 4). The corners were chamfered to allow drivers to see better at the street crossings and to increase the turning circle of the trams. An original height restriction of 20 m, four storeys, was established and coincided with the typical street width of the plan. Unfortunately, this was later increased to eight or nine storeys that impacted on the good original design (Marquet & Miralles-Guasch, 2015: 259).
Dura-Guimera (2003: 388) states that the nineteenth-century Cerda-designed expansion around the old city permitted the bourgeoisie to remain close to the centre, while the industrial workers found a place in the old city or in the surrounding villages of the county of Barcelona. Marquet & Miralles-Guasch (2015: 259) describe the current city's morphological characteristics as dominated by a continuous, compact urban area with buildings currently and generally not exceeding eight or nine floors and mixed land use, including a commercial structure marked by a small retail business. The average family income was approximately 17 900 Euros in 2006, with some significant differences in its distribution. Another characteristic of the compact city of Barcelona is the current wide-ranging system of public transport such as metro, train, tram, and bus lanes. The optimal design of street patterns, which is also a significant aspect for active transport and sustainable development, is clearly fulfilled by Cerda's Eixample, an urban planning development with a worldwide reputation (Figures 2, 3 and 4).
Fortunately, Pretoria did not follow this gradual organic morphological growth through the medieval ages and initially far more greenfield space was available so that Pretoria and South African cities generally have far lower densities than other cities in the world. In comparison to ancient European cities such as London, Barcelona, Rome and Venice, Pretoria is a very young city. It became the capital of the South African Republic (ZAR) on 1 May 1860. The founding of Pretoria as the capital of the South African Republic can be considered to mark the end of the Boers' settlement movements of the Great Trek.
Pretoria was surveyed in its formal grid pattern by its first landdrost, Andries du Toit, in 1857 (Pienaar, 2004: Chapter 2:1). The large original blocks in the central core of Pretoria originally consisted of stands known as a Burger erven, measuring 120 x 240 cape ft (37.78 m x 75.57 m), with their long sides oriented almost north-south. These have been arranged in large street blocks of approximately 226.69 m x 151.13 m, with the long dimension in an east-west direction. This implies that each large street block originally contained 12 Burger erven. The original grid layout of Pretoria is orientated almost north-south and east-west, where the north-south streets are turned slightly west of north by 4.24°. The large blocks soon necessitated a system of arcades to improve connectivity and walkability of the city.
From an analysis of the original town planning of Pretoria (Figure 5), it is clear that the development of the city was directly influenced by various geographic features and historic events. The following observations are made with regard to Pretoria:
• The early and current development of the city is determined strongly by the parallel east-west mountain ranges (eastern start of the Magalliesberg range) and the occurrence of a few other geographic features such as smaller koppies, rivers, and streams. The parallel mountain ranges are one of the contributing factors for the predominantly east-west wind directions.
• Even with climate change, Pretoria still has one of the best climates in the world (Figure 1; Conradie, 2016: 28-30). Central Pretoria currently has a Köppen-Geiger classification of Cwa (warm temperate, winter dry, hot summer), the southern parts Cwb (warm temperate, winter dry, warm summer), and the northern parts BSh (arid, steppe, hot arid). This fact indicates the opportunity to create parks, shaded walkways, and an outward living city. This also suggests the high potential for the use of passive design methodologies and a high availability of good quality solar energy for solar water heating and Photo-Voltaic electricity generation. Unfortunately, the city is not very windy. Wind-power generation is not an option and the CBD has a problem with smog in winter.
• The establishment of industries on the western side of the city, due to the natural occurrence of an iron ore body and the subsequent establishment of Cor Delfos's original iron smelter, later ISCOR and ArcelorMittal South Africa, and other early industries such as a leather tannery gradually turned the west into a predominant industrial area with lower property values and the run-down urban environment currently experienced in the western parts. The long-term consequence is that the city is still developing slowly towards the west, but predominantly to the east and, to a lesser extent, to the north and the south.
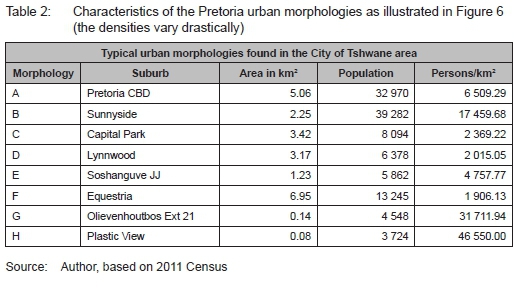
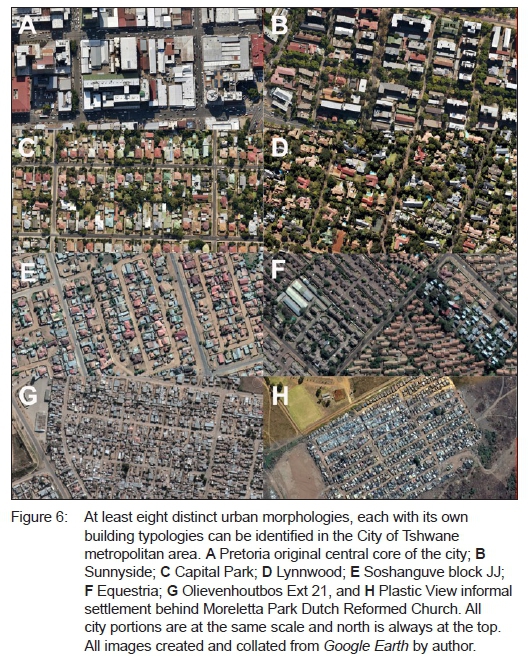
• Pretoria has generally one of the lowest urban population densities (persons per hectare) in the world, leading to very long travelling distances. It is still a de facto motor vehicle-oriented city. According to the 2011 census statistics, the population density varies from 1 156 persons/km2 to 17 459 persons/km2. Some of the informal settlements achieve an even higher density. This is the case of Plastic View that is estimated to have a density of between 23 275 and 46 550 persons/km2 (Figure 6).
• The very long travelling distances are further aggravated by the fact that there is inadequate public transport. Pretoria is currently not a walkable or bicycle-friendly city. Compare this to an emphasis on pedestrian walkways and trees in the historical core of Barcelona or Delft in The Netherlands.
Figure 6 details some of the current morphologies and building typologies found in the city. The street orientations vary significantly, from ideal to very bad from the point of view of passive design and energy efficiency. Depending on the size of the individual erf, plot or stand, this could have a significant impact on the energy use of the facilities and the opportunity to use passive design techniques. The characteristics of the urban morphologies illustrated in Figure 6 are summarized in Table 2.
3. THE CURRENT CITY OF TSHWANE AND THE SOUTH AFRICAN REGULATORY ENVIRONMENT
Two main types or categories of regulations determine and influence the built environment in the City of Tshwane metropolitan (CoT) metropolitan area, namely town-planning level and the extensive set of National Building Regulations (NBR) directly related to the design of buildings.
On the town planning side, there are three important regulatory documents:
1. Act No. 16 of 2013: Spatial Planning and Land Use Management Act, 2013. (RSA, 2013). This Act provides a framework for spatial planning and land-use management in the Republic. This document refers throughout to sustainability in 13 clauses and paragraphs. Some of these are to limit urban sprawl and ensure sustainable livelihoods in communities most likely to suffer the impacts of economic and environmental shocks (RSA, 2013: 18). Reference is also made to social inclusion, spatial equity, desirable settlement patterns, rural revitalisation, and urban regeneration (RSA, 2013: 20).
2. City of Tshwane Land-Use Management By-Law, 2016. The purpose of this By-Law is to bridge SPLUMA and the Tshwane Town Planning Scheme (2014). The main purpose is to give effect to "Municipal Planning" as contemplated in the Constitution of the Republic of South Africa, 1996 and to lay down and consolidate processes and procedures. It is also intended to facilitate and make arrangements for the implementation of land development and landdevelopment applications, spatial planning and a Land-Use Scheme within the jurisdiction of the City of Tshwane, in line with SPLUMA.
3. Tshwane Town Planning Scheme, 2008 (Revised 2014). This document is the result of the consolidation of the former 13 separate town-planning schemes that existed prior to the creation of the vast consolidated CoT metropolitan area. The main purpose of this document is co-ordinated and harmonious development in such a way that it will most effectively tend to promote the health, safety, good order, amenity, convenience, and general welfare of the area as well as efficiency and economy in the process of such development. The design and erection of buildings are governed by Floor Area Ratio (FAR), coverage, building lines, and height restrictions (Figure 7). CoT currently has 28 different town-planning zones: five residential, four business, two industrial and 17 other specialized types. Figure 7 illustrates the different types of zones currently found in the high-density central core of Pretoria. Please refer to Figure 6 for additional morphological detail.
On the building design and construction side, there are two main categories, namely the SANS standards applicable to all buildings and the Green Building Council of South Africa with their Green Star SA Rating System that strives to improve sustainability and energy efficiency of office buildings (Green Building Council of South Africa, 2008: v). The latter has been adapted from the Australian Green Star - Office v3 tool, under license from the Green Building Council of Australia.
There is no shortage of SANS regulations. The author counted 379 regulations. Of these, 22 are SANS 10400 related and 336 other miscellaneous standards including 2 ARP, 9 CKS and 1 NRS standard.
Twenty-one regulations have been withdrawn. Of all these, only 10 relate to energy usage and lighting, with generally hardly any guidance of how energy efficiency and sustainability can be achieved or how it should be integrated with the town planning side (Laubscher, 2011: 230-241).
The promulgation of the National Regulator for Compulsory Specifications Act (Act 5 of 2008) in the Government Gazette 31216 on 4 July 2008 brought about a number of changes. In keeping with international best practice and to meet the requirements of the World Trade Organization (WTO) agreement on Technical Barriers to Trade (WTO TBT Agreement), Act 5 of 2008 transferred the Regulatory Division of the SABS and all its regulatory functions to a new statutory body. Resorting under the Ministry of Trade and Industry, the newly formed National Regulator for Compulsory Specifications (NRCS) took over the regulatory responsibility of the SABS on 1 September 2008. The new legislation required a number of changes. In future, the standards would no longer be known as SABS standards, but rather as South African National Standards (SANS). Accordingly, the name of the code of application of the NBR through the Deemed-to-Satisfy Rules was changed to the following SANS 10400:1990 SOUTH AFRICAN STANDARD Code of Practice for the application of the National Building Regulations [National Amendment 1990-08-01, National Amendment 1996-0522] (Laubscher, 2011: 57-58).
SANS 10400 consists of Parts A to D and F to W. SANS 10400-A is labelled General principles and requirements. It provides the overall framework for the application of the NBR. Each consecutive section is written separately and only deals with one specific part of the regulations, although each particular section should be applied within the framework of the whole, as established in SANS 10400-A (Laubscher, 2011: 59). At this stage, the important standards are the voluntary standards SANS 204: 2008, parts 1 to 3 that focus on energy efficiency in buildings; SANS 10400-XA: 2010 (energy usage in buildings), and SANS 10400-O: 2010 (lighting and ventilation).
An analysis of the current town planning- and building-related acts and regulations indicates that the system is essentially zone based and that these will not directly lead to sustainable and energy-efficient building designs. Lack of integration between the two levels might compromise the significant passive design potential in South African climates (Figures 1, 6 and 7) of a particular development, especially if a specific property is severely overshadowed by other buildings or badly orientated on the site.
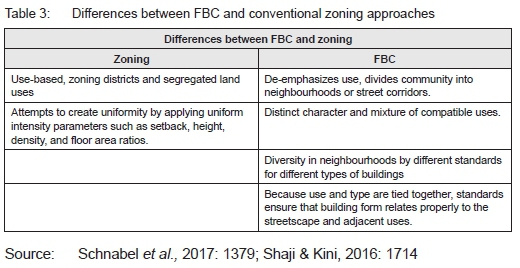
It is suggested that other alternatives be investigated, with less focus on land use. With the launch of New Urbanism in the 1980s, Form-Based Coding (FBC) was created as an alternative approach to conventional zoning and land-use regulations. FBC can potentially provide a much better alternative, with less focus on land use as currently prevails in municipal regulations (Schnabel, Zhang & Aydin, 2017: 1379; Shaji & Kini, 2016: 1714). FBC is a way of regulating land development to achieve a specific form. FBC creates predictable built results and a quality built environment using physical form by, inter alia, using parametric modelling. It was developed by the Form-Based Codes Institute. The key differences between zoning and FBC are summarized in Table 3.
Nel (2016: 258) analyses the potential effect that SPLUMA aims to have and then states that zoning conflicts with the SPLUMA principles of spatial justice, spatial sustainability, and spatial resilience. Nel (2016: 259-261) analysed the various zoning schemes and alternative regulatory systems such as zoning schemes, restrictive conditions and covenants, performance zoning, the plan as the code, form-based codes, and a discretionary system. A modified transect that includes conservation, agriculture, rural settlements, general urban, urban core, and special areas is proposed. In the case of the urban core, form-based codes are proposed. (Nel, 2016: 261-263).
4. EXPOSURE TO SOLAR RADIATION
In an analysis of nearly 200 solar design tools, Jakica (2018: 1296-1298) extensively examined the numerous software features regarding accuracy, complexity, scale, computation speed, representation, and building design process integration in about 50 2D/3D, CAD/CAM and BIM software environments. However, he also noted that there is currently still a significant gap between Early Design Phase (EDP) and detailed Building Performance Simulation (BPS) performance simulations methods. There is, therefore, a great need for improvement in terms of developing simplified models and tools aimed at EDP to ensure that better decisions are taken earlier in the design process. This may explain why architects still widely use rules of thumb in the EDP phase that currently often leads to suboptimal solar protection design. The better the EDP methods become, the more efficient the later stages of detailed design by means of BPS becomes, because designers can converge sooner to a solution.
Intense solar radiation has simultaneously a big negative impact on, and benefit in South Africa. To quantify this aspect, a typical meteorological year weather file for Pretoria Forum weather station was generated by means of the Meteonorm v7.2.4 software. The calculations in Figure 8 were undertaken with a new EDP experimental software platform (developed by author) that uses as its input a typical meteorological year weather file, combining it with advanced algorithms to calculate the solar azimuth and elevation for each of the 8 760-hour data records in the weather file. The base 8 760 data points was interpolated by means of a La Grange polynomial interpolation routine to 35 037 data points to ensure a less granular solar exposure diagram. Note the figure eight patterns in Figure 8. These are called the analemmas and are essentially the effect of the difference between apparent and mean time (equation of time). In other words, it is the difference between the hour angles of the true sun and the mean sun. Sometimes the true sun is ahead and sometimes behind the mean sun. This is caused by the earth's slightly elliptical orbit and the varying orbital speed that, in essence, follows Kepler's laws. Figure 8 is, therefore, expressed in mean sun time (clock time) to make it more accessible for direct civil use (Meeus, 2015: 183). Table 4 summarizes the theoretical maximum amount of hours' sunlight (solar radiation) that the four facades of a building would receive with different primary orientations in Pretoria, if no overshadowing takes place.
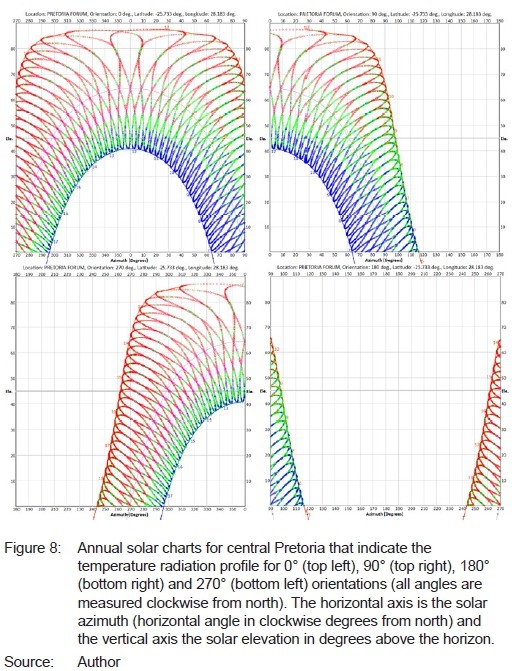
Table 4 illustrates the total amount of annual sunlight hours that will theoretically be available for the different facades of a rectangular building in Pretoria (Latitude 25.733°, Longitude 28.183°). This has been calculated by means of the EDP experimental platform that is able to accurately calculate the solar azimuth and elevation and combines it with a typical meteorological year weather file for Pretoria Forum weather station. If the main orientation is 0°, then Facade 1 would face due north.
Figure 8 is an analytical graphical screen that displays the annual temperature/radiation combinations with solar azimuth on the horizontal axis and elevation above the horizon on the vertical axis. The azimuth is expressed in degrees clockwise from 0° (north). The elevation is expressed in degrees from the horizon to vertical (0° to 90°). This facilitates the study of the annual temperature and radiation distributions and supports advanced early design-phase analysis to determine the times when solar protection and shading would be necessary. Four temperature categories were colour mapped on each chart to make the temperature/ radiation trends visible:
Cold (Blue):
Drybulb temperature < = 18 °C
Comfortable (green):
Drybulb temperature > 18 °C and
Drybulb temperature < 23.8°C
Warm (Magenta):
Drybulb temperature > = 23.8
°C and Global Horizontal
Irradiation < 315.5 Wh/m2
Hot (Red):
Drybulb temperature > = 23.8
°C and Global Horizontal
Irradiation > = 315.5 Wh/m2.
It is evident from Figure 8 how much hotter the afternoons (western exposure) are in comparison with the mornings. According to ASHRAE 55 (2010: 5-10), solar protection (shading) should be introduced when a drybulb temperature of 23.8 °C combined with a Global Horizontal Irradiation exceeding 315.5 Wh/m2 is reached and exceeded. The blue line indicates the solar movement during winter solstice, the grey one during the vernal and autumnal equinox, and the red line at summer solstice. At the equinoxes on 20 March and 23 September,7 the sun rises exactly east and sets exactly west.
Unlike the diagrams suggested by Mazria (1979: 267-308) and the Climate Consultant 6.0 software, this research platform supports a bearing of any angle including due south.
4.1 The effect of building height and street width on solar insolation and natural daylight
To study the effect of building height and street width on the availability of sunlight and natural daylight in the Pretoria CBD, a simulation model was defined by means of the Ecotect v5.60 energy simulation software. For this simulation, the following assumtions were made:
• The same weather file was used for all studies in this article, i.e. Pretoria Forum generated by Meteonorm v 7.2.4.
• A standard Pretoria CBD streetblock of 226.69 m x 151.13 m was used.
• The actual orientation of the Pretoria CBD street blocks was used, i.e. 4.24° west of north.
• Two notional buildings running the full length of the angles are high above the horizon and the overshadowing building does not have a big effect.
If a multi-storey building is to be completely lit by daylight, then there are limits on its overall plan depth. If a day lit room is too deep, the rear will look gloomy compared to the brightly lit area near the windows. If a day lit room is lit by windows in one wall only, the depth of the room L should not exceed the limiting value given by (CIBSE LG10, 2014: 26):
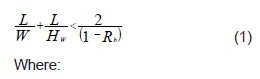
L is the room depth,
W is the room width,
Hwis the window head height above floor level, and
Rbis the average reflectance of surfaces in the rear half of the room (away from the window).
If L exceeds this value, the rear half of the room will tend to look gloomy and supplementary electric lighting may be required.
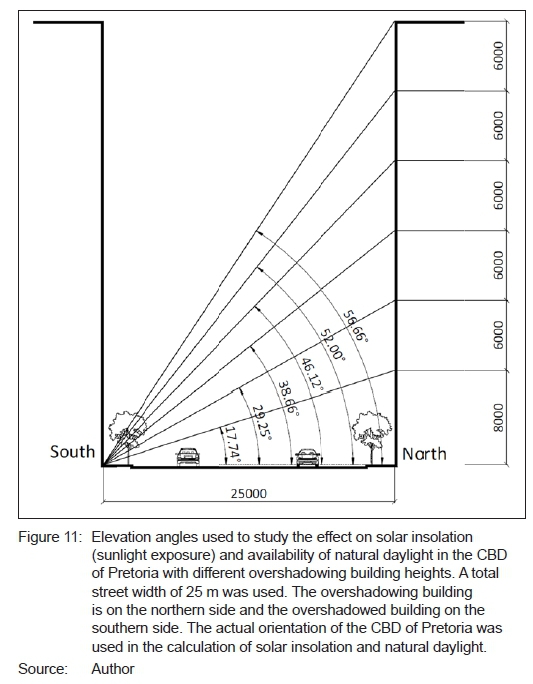
Street trees are one of the most effective measures to reduce local outside temperature with the combination of shade and evaporatative cooling. Van Hove, Blocken, Van den Dobbelsteen, Spit & Bosch (2014: 52-53) opined that streets should be twice as wide as the building height. From the results of the simulations illustrated in Figure 11, this appears over-conservative. Van Hove et al. (2014: 52-53) wanted to ensure that there is good natural ventilation and to avoid the urban canyon effect. Parks at urban and regional level, especially during heatwaves, are very important. Parks are like cool islands within a city. Laying out more parks with different microclimates provides urban inhabitants with a choice as to where they feel comfortable. Parks can simultaneously act as a water buffer during extreme rainfall.
4.2 The effect of building orientation and spacing in a street block on solar insolation and natural daylight
A very large number of parametric simulations could potentially be undertaken to study this aspect. To illustrate the effect of building height, building orientation and spacing on the availability of sunlight and natural daylight on a typical Pretoria street block in Pretoria, three simple simulation models were built by means of the Ecotect v5.60 energy simulation software. In model A, all the buildings are oriented east-west; in model B, all the buildings are oriented north-south, and in model C, all the buildings are turned at 45°. For this simulation, the following assumptions were made:
• The same weather file was used for all studies in this article (including the bioclimatic analysis), i.e. Pretoria Forum generated by Meteonorm v7.2.4.
• In all cases, simulations were done for the winter solstice (20 June) and for the summer solstice (21 December) (Figure 12).
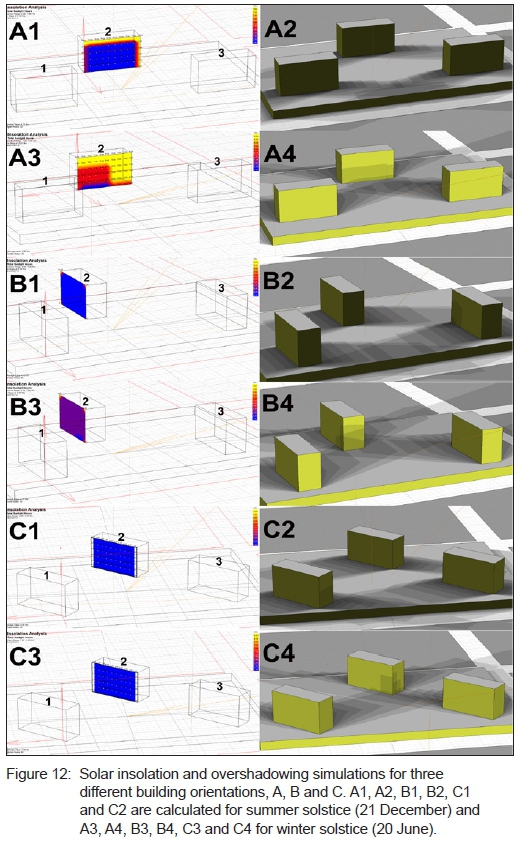
• A standard Pretoria CBD streetblock of 226.69 m x 151.13 m was used.
• The actual orientation of the Pretoria CBD street blocks was used, i.e. 4.24° west of north.
• The buildings were centrally spaced on six consolated erven, each 75.56 m x 75.56 m, i.e. the street block consists of six large square erven.
• The simple notional buildings are 18 m x 50 m on plan and consist of a two-storey podium (8 m high) with a ten-floor medium high-rise block of ten floors (30 m high).
• As before, a street total street width of 25 m is assumed. This includes 2.5 m sidewalks on both sides and a 20 m vehicular lane width.
• In each case, the insolation and overshadowing of the long facade of building 2 on the site was studied (the southernmost potentially disadvantaged building).
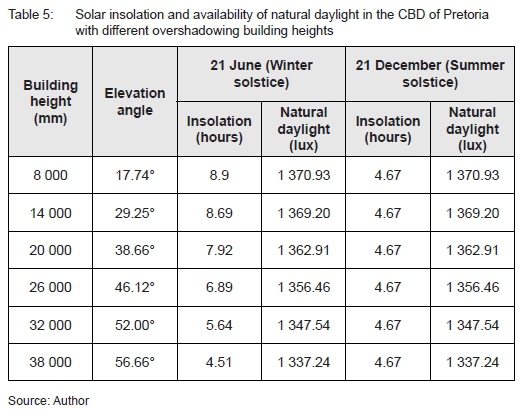
On summer solstice (21 December), the sun rises at an azimuth of 116.62° and sets at 243.35°. At noon, the sun reaches an elevation of 87.7° and the length of day is 13h45. On winter solstice (20 June), the sun rises at an azimuth of 64.24° and sets at 295.76°. At noon, the sun reaches an elevation of 40.84° and the length of day is only 10h32 (Figure 8). These solar angles have a significant effect on the overshadowing characteristics of the southernmost building, especially in winter. The winter solstice noon angle roughly corresponds to a building height of between 20 m and 26 m in the specific case illustrated in Figure 11 and Table 5.
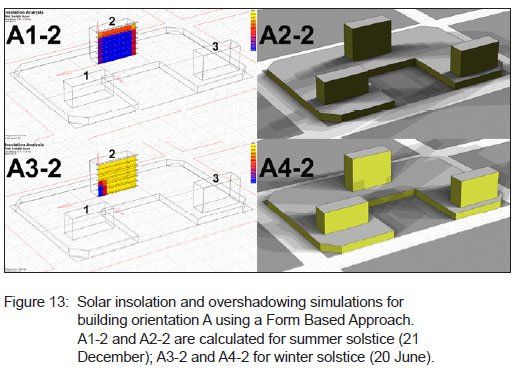
4.3 The potential effect that a Form Based Code (FBC) might have on solar insolation and natural daylight
To illustrate the potential effect that an FBC approach might have in the Pretoria CBD, a simple illustrative simulation was undertaken by means of the Ecotect v5.60 energy simulation software for only model A with building orientations east-west as before. For this simulation, the following assumptions were made:
• The same weather file was used for all studies in this article (including the bioclimatic analysis), i.e. Pretoria Forum generated by Meteonorm v7.2.4.
• In all cases, simulations were done for the winter solstice (20 June) and for the summer solstice (21 December) (Figure 12).
• A standard Pretoria CBD streetblock of 226.69 m x 151.13 m was used.
• The actual orientation of the Pretoria CBD street blocks was used, i.e. 4.24° west of north.
• Building 1 is in the same location as before. However, the building height has been reduced to 8 storeys.
• Building 2 is in the same location as before. However, the building height has been increased to almost 13 storeys. This height has been calculated by means of the winter solstice angle of Pretoria (40.84°) taken from a point across the street on the southern side of building 2 in such a way that no overshadowing takes place at this time (Table 7).
• Building 3 was kept at the original height; it moved north by 20 m to reduce overshadowing of building 2.
• As before, a street total street width of 25 m is assumed. However, the walkways are now much wider to make the city more walkable, as the pedestrians now take precedence over vehicles and the vehicular lanes are narrower with less prominence given to parking (Nel, 2016: 261).
• A large green space has been opened, inspired by the Barcelona manzana, between buildings 1 and 3 to facilitate the introduction of compatible mixed uses such as bistros, restaurants, retail, offices, and small 'home industries'. The area is sufficiently large that vegetation can grow successfully to provide shade in summer and to reduce the effect of urban heat islands. This effectively split the very large Pretoria street block into two and will provide a better connection to the streets south of this block if an arcade is introduced underneath building 2.
• At the street intersections, the corners are chamfered at 45° to reduce the effect of the street canyon and to provide better visibility to pedestrians and traffic.
In each case, the insolation and overshadowing of the long facade of building 2 on the site was studied (the southernmost potentially disadvantaged building). See Table 7.
5. SOLAR PROTECTION MEASURES AT BUILDING AND URBAN SCALE
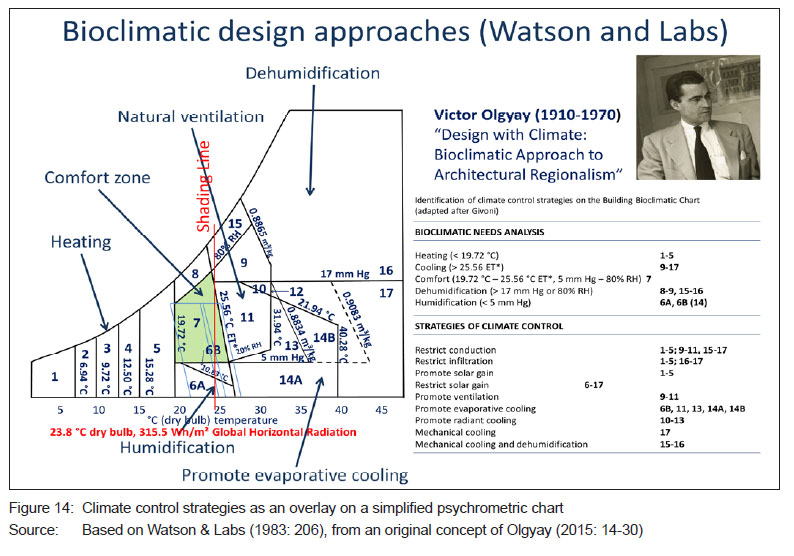
5.1 Bioclimatic analysis
In addition to the other simulations discussed earlier, a bioclimatic analysis was used to quantify the advantages of solar protection and penetration at the appropriate times. A bioclimatic analysis is a structured climatic overlay on a psychrometric chart, as illustrated in Figure 14. Note the red shading line drawn at 23.8 °C and 315.5 Wh/m2 Global Horizontal Radiation that indicates when shading should be introduced. This corresponds to the Hot(red) category in Figure 8.
Bioclimatic design is used to determine the best set of passive design strategies for a building that uses natural energy sources and, therefore, significantly reduces energy use (Visitsak & Haberl, 2004: 1-11). This approach was already developed in 1963 by Olgyay (2015: 14-31) to ensure the best use of the specific climate and comfort in buildings.
Table 8 was calculated by means of the advanced Climate Consultant 6.0 software developed by Robin Liggett and Murray Milne of the UCLA Energy Design Tools Group, with technical support of Carlos Gomez and Don Leeper. The software makes it possible to overlay a weather file (8 760 hours) on an electronic version of the psychrometric chart illustrated below (Figure 14). The program then calculates how many hours fall within the specific strategy zones. This is based on the theoretical work of Givoni and Milne (1979: 96-113) and makes it possible to determine which passive design strategies are most appropriate to design a comfortable building. Exactly the same weather file used elsewhere in this article was used for this analysis.
Table 8 is a detailed bioclimatic analysis of the best set of passive design strategies for South African towns and cities. The figures were calculated by means of a bioclimatic analysis with Climate Consultant 6.0, using weather files generated by means of Meteonorm v7.2.1. Table 8 should be read in conjunction with Figure 1. The blue bars in Table 8 show the number of hours that appropriate solar design would have an effect for ten South African cities. The winter solstice angles for the various cities have also been calculated. It is recommended that these angles be used as a method to ensure that buildings get enough solar insolation and have enough natural daylight and adequate natural ventilation. The measures indicated in orange are not strictly speaking passive. The theoretical achievable passive potential is indicated in the bottom row, if the measures in orange are not applied.
5.2 Solar protection at building scale
At least 12 different generic shading devices can be identified at building scale (Figure 15). Generally speaking, shading types that exclude the sun externally during the overheated period and allow it in during the cold period are more efficient. By contrast, although fixed screens are very efficient, they have the disadvantage that they exclude the sun, even during the cold periods. Hence, the energy-saving opportunity by balancing the overheated with cold period is unfortunately lost.
A: Horizontal overhang (fixed)
This type of overhang is mostly suitable for altitude-/elevation- (sun is far above the horizon) dominated solar angles, typically on northern (or near northern) facades. It can take various forms such as illustrated in Figures 15A to 15E. This could also be in the form of a projecting awning or sunblind.
B: Fixed vertical screen
This configuration is a variation of A and is intended to exclude the lower rays of the sun, thereby reducing the glare problem.
C: Side fin/vertical projection (fixed)
The side fin used on its own is suitable for use on facades where the solar altitude/elevation is mostly azimuth dominated, i.e. low solar angles above the horizon. This option is often combined with A for facades that are not due north and where there is a mix of altitude-/elevation-and azimuth-dominated solar angles that need to be excluded.
D: Light shelf (fixed)
This is another variation of A and is used to improve the natural light penetration in a space by means of a reflecting light shelf.
E: Horizontal louvres (fixed or moveable)
This is a variation of A and, if it is moveable, it is more flexible than A. It is typically used with altitude-/elevation-dominated solar angles. They have the advantage to permit air circulation near the facade. Slanted louvres give better protection than vertical ones.
F: Vertical louvres (fixed/moveable)
This protection device is found in different forms. In its simplest form, it could be a fixed vertical screen some distance away from the building facade. In a more complex form, it could consist of multiple louvres set right in front of the window or some distance away from the facade. The most sophisticated variation would be a moveable system with or without computer control.
G: Integral blinds
In this system, blinds are built into a double glass system. This has some advantages such as the protection of the blind. These systems are normally moveable.
H: Special glass such as heat absorbing, reflective and photochromic
This is the weakest type of shading device, as it depends on the treatment of the glass and can ultimately not avoid heat gains in the interior.
I: Vertical external screen
There are many types of this screen. In its simplest form, it could be a fixed fine woven metal mesh.
More complex systems consist of special screens that can be opened and closed when desired.
J: External louvres, insulated louvres, louvered blind and vertical roller blind
These types are mentioned by CIBSE (2014: 39) and there are many variations with varying degrees of durability. Some researchers even suggested the integration of screens with flexible photovoltaics (Sampatakos, 2014: 71-110). Insulating blinds are mentioned by Kristinsson (2012: 61-67).
K: Internal screen, louvre drapes, blinds or curtains
This family of solar protection devices are not that efficient to reduce heat in a space, as it is not excluding the solar radiation from the outside. This causes the gradual build-up of heat in the space, due to the hothouse effect. However, it is useful as a means to control solar glare with low solar angles in the early morning and late afternoon. Ideally, these types of devices should be used in conjunction with well-engineered external solar protection devices. This type of screening could be venetian blinds, vertical louvered retractable blinds, fabric roller blind and fabric curtains.
L: Double-skin facade
This the most sophisticated type of facade. It takes many forms, depending on the specific facade application. It is successfully used in hot climates. Three fundamental types can be recognized, namely Buffer Facade, Extract-air Facade and Twin Face Facade.
5.3 Solar protection at urban scale
Various measures are available at urban scale:
• Building design (street canopies to keep pavements cool, green roofs, facades and green leaf cover)
• Vegetation
• Pavements
• Street morphology
• Access to cooling centres (airconditioned buildings or cool areas in the city)
• Reduction of anthropogenic heat (Icaza, 2017: 71-79).
5.3.1 Vegetation as a measure to provide shade and reduce Urban Heat Islands
The use of vegetation in a city has several very positive advantages. Research in The Netherlands (Utrecht) show a limited cooling effect for street trees in terms of air temperature (Tair), but a clear reduction of the radiative temperature (mean radiant temperature, Tmrt) with large tree crowns. The average Tmrt in a street with a 54% surface of tree crowns was found to be 4.5 °C lower than in a street without trees. (Van Hove et al., 2014: 66).
Van Hove et al. (2014: 24) also found significant correlations (p < 0.05) for both the surface temperature and the air temperature for the fraction of built surface, the fraction of paved surface, and the fraction of urban vegetation. Urban vegetation cools the environment through transpiration and shade. However, this means that enough water must be present. On summer days, it can be 3 °C cooler in a small park than in the surrounding built area. However, the influence of the Park Cool Island effect on the surrounding built environment is unfortunately minimal.
There is also a strong positive psychological effect of green gardens on how pedestrians perceive temperature. Visible green elements at different heights such as low shrubs, hedges, green facades and tree canopies make the heat more bearable for people, and they also appreciate such streets more from an aesthetic point of view.
Vegetation and trees are, therefore, very useful measures to reduce the Urban Heat Island (UHI) Effect. Trees not only provide shade, but they are also a very effective carbon sink. A carbon sink is a process or mechanism that removes Carbon Dioxide (CO2), one of the greenhouse gasses, out of the atmosphere. Carbon is sequestrated in the trees' wood at different rates and quantities. This is dependant on factors such as growth rate, specie, size of the full-grown tree and expected life. (Stoffberg et al., 2010: 9). Many international studies confirm these advantages. For example, Kuittinen, Moinel and Adalgeirsdottir (2016: 623-632) studied the urban ecosystems of the Finish city Espoo. They studied seven housing complexes and found that the sequestration or uptake of the CO2 by growing plants and the uptake of soil organic carbon varies considerably. The sequestration as a percentage of all releases varied from 1.2% to a more significant 11.9%. The best values were measured at a stand-alone house and the worst at an apartment block.
Stoffberg et al. (2010: 9-14) estimated the carbon sequestration for street trees in Pretoria (CoT). In 2002, CoT formulated a strategy to plant 115 200 indigeneous street trees between 2002 and 2008. The author is not able to verify if this has actually materialized. The results of growth regression were used to estimate the carbon sequestration tempo of the different species of trees. These results were then used to estimate the total carbon sequestration for a 30-year period (2002-2032). It was estimated that tree planting would lead to an estimated 200 492 ton equivalent CO2 reduction and that 54 630 ton carbon would be sequestrated. The research was based on three indigeneous species, i.e. Combretum erythrophyllum (Vaderlandswilg), Searsia lancea (Karee), and Searsia pendulina (Witkaree). This base information was used to estimate the carbon sequestration of the other tree species such as Acacia caffra en Galpinia transvaalica.
5.3.2 Cool roofs and surfaces
Many roofs and impervious urban paved areas in South Africa have a dark colour and reach high temperatures on warm sunny days. These surfaces store and release a large amount of energy into the atmosphere. Hot surfaces also accelerate the deterioration of the materials. Buildings with inferior or inadequate roof insulation increase the amount of cooling energy required and have a negative impact on the comfort of building users. Current research trends in the field focus on the development of highly reflective pavements and permeable pavements that use evaporative cooling of water that could penetrate the surface (Icaza, 2017: 78).
The spatial variation in surface temperature is related to the average Sky View Factor (SVF) and surface albedo in an area. Neighbourhoods with a larger average SVF and a greater surface albedo have a lower surface temperature. A possible explanation is that a higher SVF and greater surface albedo mean that less solar radiation is absorbed, so that surfaces heat up less during the day (Van Hove et al., 2014: 28).
It is currently possible to create a cool roof with advanced materials that are not white, although white cool roofs are quite common. This is achieved by substantially increasing the reflectance of the surface treatment paint.
6. CONCLUSIONS
South Africa's current climate is predominantly arid, with 70.9% of the area falling in the Köppen-Geiger categories BSh, BSk, BWh en BWk (Conradie, 2012: 181-195).
However, a bioclimatic analysis indicates that there is a significant amount of passive design potential.
To realise this passive design potential effectively in the high-density central city developments, a specific site cannot be seen in isolation. Each development will have to be seen in relation to the neighbouring site and buildings, in order to avoid negative effects such as severe overshadowing that reduces the potential to benefit from solar gains when required and the use of renewable energy. Street and public space vegetation also requires a sufficient amount of sunlight to grow. It is recommended that municipalities such as CoT investigate and gradually move to FBC as it might be a better regulatory approach than the current zoning-based codes.
FBC has a significant potential to improve sustainability in the general urban areas of South African cities. This should be investigated.
East-west (long axis of building) building orientations are significantly better for the use of solar potential and natural daylight. North-south building orientations are not ideal.
The high rise part of a high-rise density development can be closer to the northern edge of the site due to the Pretoria solar angle geometry. This reduces the possibility of overshadowing in street blocks directly south of the high-rise building.
It is recommended that the winter solstice noon elevation angle be used as the threshold angle to limit overshadowing and to ensure adequate natural daylight. It is a reliable conservative method, as it will automatically take account of the solar angles in other South African cities that are situated at different latitudes. In the case of Pretoria, it automatically leads to a street width, building height factor of 1.
It is recommended that specific building-facade designs first consider the design of solar protection measures such as horizontal overhangs and then the provision of adequate natural daylight as natural daylight is more diffuse and is not affected as much as insolation with an increased height of buildings. The general rule is shading in summer and solar penetration in winter.
Climate change will have a significant impact on South African cities. Fortunately, there is a wide range of measures that can be used at building, suburban and urban level to reduce the urban heat island effect such as cool surfaces, green roofs and the extensive use of trees and vegetation. The low population density of many South African cities is cause for concern, because it gives rise to increased urban heat islands, and transport costs become very expensive, due to the long travelling distances and an increased carbon footprint. New cities should, therefore, be planned in a far more compact manner, and existing cities should gradually be increased in density.
The above simulations clearly indicate that densification should be properly planned to ensure the full realisation of the passive design potential of a specific city.
REFERENCES
ASHRAE 55. 2010. Thermal environmental conditions for human occupancy. Atlanta, GA: ASHRAE. [ Links ]
BARNETT, J. 1982. An introduction to urban design. New York: Harper & Row. [ Links ]
BELLIA, L., MARINO, C., MINICHIELLO, F. & PEDACE, A. 2014. An overview on solar shading systems for buildings. Energy Procedia, 62(2014), pp. 309-317. https://doi.org/10.1016/j.egypro.2014.12.392 [ Links ]
CIBSE LG10. 2014. SLL Lighting Guide 10: Daylighting - A Guide for Designers: Lighting for the Built Environment. The Society of Light and Lighting (part of CIBSE), Page Bros. (Norwich). [ Links ]
CIE (COMMISSION INTERNATIONALE DE L'ECLAIRAGE). 2002. Spatial distribution of daylight - CIE standard general sky. CIE DS 011.2/E:2002. [ Links ]
CONRADIE, D.C.U. 2012. Designing for South African climate and weather. In: Van Wyk, L. (Ed.). The green building handbook South Africa, The essential guide, Volume 4. Alive2Green, pp. 181-195. https://doi.org/10.18820/2415-0495/trp68i1.3 [ Links ]
CONRADIE, D.C.U. 2013. Appropriate passive design approaches for the various climatic regions in South Africa. In: Van Wyk, L. (Ed.). The green building handbook South Africa, The essential guide. Volume 5. Alive2Green, pp. 101-117. [ Links ]
CONRADIE, D.C.U. 2016. Die invloed van klimaatverandering op die Suid-Afrikaanse stad en voorgestelde aanpassings. Town and Regional Planning, 68, pp. 27-42. [ Links ]
CONRADIE, D.C.U., VAN REENEN, T. & BOLE, S. 2015. The creation of cooling degree (CDD) and heating degree day (HDD) climatic maps for South Africa. In: Proceedings of Smart and Sustainable Built Environments Conference 2015 (SASBE 2015), University of Pretoria, December, pp. 83-91. [ Links ]
DE LA PEñA. 2013. Experiments in participatory urbanism: Reform and autogestión as emerging forms of urban activism in Barcelona. Ph.D. thesis in Landscape Architecture and Environmental Planning, University of California, Berkeley. [ Links ]
DOERR, A. 2014. Behind four walls: Barcelona's lost utopia. In: Clemoes, C. (Ed.). Failed architecture. Amsterdam. [online]. Available at: <https://failedarchitecture.com/behind-four-walls-barcelonas-lost-utopia>. [Accessed: 3 September 2018]. [ Links ]
DURA-GUIMERA, A. 2003. Population deconcentration and social restructuring in Barcelona, a European Mediterranean city. Cities, 20(6), pp. 387-394. https://doi.org/10.1016/j.cities.2003.08.004 [ Links ]
GIBBERD, J. 2015. IUSS Health Facility Guides: Environment and Sustainability. [online]. Available at: <http://www.iussonline.co.za/index.php/norms-standards/healthcare-environment/33-environment-and-sustainability>. [Accessed: 23 August 2018]. [ Links ]
GIVONI, B. & MILNE, M. 1979. Architectural design based on climate. In: Watson, D. (Ed.). Energy conservation through building design. New York, NY: McGraw-Hill, Inc., pp. 96-113. [ Links ]
GREEN BUILDING COUNCIL OF SOUTH AFRICA. 2008. Technical Manual Green Star SA Office Design & Office as Built Version 1. Green Building Council of South Africa. [ Links ]
ICAZA, L.E. 2017. Urban and regional heat island adaptation measures in The Netherlands. Ph.D. thesis, Delft University of Technology, Faculty of Architecture and the Built Environment, Department of Urbanism. [ Links ]
IPCC (INTERGOVERNMENTAL PANEL ON CLIMATE CHANGE). 2000. Emission scenarios, summary for policymakers: A special report of IPCC working group III. Published for the Intergovernmental Panel on Climate Change. [ Links ]
JAKICA, N. 2018. State-of-the-art review of solar design tools and methods for assessing daylighting and solar potential for building-integrated photovoltaics. Renewable and Sustainable Energy Reviews, 81(2018), pp. 1296-1328. https://doi.org/10.1016/j.rser.2017.05.080 [ Links ]
KRISTINSSON, J. 2012. Integrated sustainable design. Delft/Deventer: Delftdigitalpress. [ Links ]
KUITTINEN, M., MOINEL, C. & ADALGEIRSDOTTIR, K. 2016. Carbon sequestration through urban services: A case study from Finland. Science of the Total Environment, 563-564(September), pp. 623-632. https://doi.org/10.1016/j.scitotenv.2016.03.168 [ Links ]
LAUBSCHER, J. 2011. An investigation of the National Building Regulations to promote uniformity and sustainability in the South African built environment. Ph.D. thesis, Department of Architecture, Faculty of Engineering, Built Environment and Information Technology, University of Pretoria. [ Links ]
MARQUET, O. & MIRALLES-GUASCH, C. 2015. The walkable city and the importance of the proximity environments for Barcelona's everyday mobility. Cities, 42(Part B), pp. 258-266. [ Links ]
MAZRIA, E. 1979. The passive solar energy book: A complete guide to passive solar home, greenhouse, and building design. Emmaus, PA: Rodale Press. [ Links ]
MEEUS, J. 2015. Astronomical algorithms. 2nd edition. Richmond, VA: Willman-Bell, Inc. [ Links ]
NEL, V. 2016. A better zoning system for South Africa? Land Use Policy, 55(September), pp. 257-264. https://doi.org/10.1016/j.landusepol.2016.04.007 [ Links ]
OLGYAY, V. 2015. Design with climate: Bioclimatic approach to architectural regionalism. New and expanded edition. Princeton, NJ: Princeton University Press. https://doi.org/10.1515/9781400873685 [ Links ]
PIENAAR, R. 2004. City building. M. Arch. thesis, Faculty of Engineering, Built Environment and Information Technology, University of Pretoria, Department of Architecture. [ Links ]
RSA (REPUBLIC OF SOUTH AFRICA). 2013. Spatial Planning and Land-Use Management Act. Pretoria: Government Printer. [ Links ]
SA HISTORY (SOUTH AFRICAN HISTORY ONLINE). 2018. Plan of Pretoria, 1878. [online]. Available at: <https://www.sahistory.org.za/image/plan-pretoria-1878>. [Accessed: 8 November 2018]. [ Links ]
SAMPATAKOS, D. 2014. Development of three-dimensional PV structures as shading devices for a decentralized façade unit of the future. M.Sc. thesis in Architecture, Urbanism and Building Sciences, TU Delft Department of Architecture. [ Links ]
SCHNABEL, M.A., ZHANG, Y. & AYDIN, S. 2017. Using parametric modelling in Form Based Code design for high-dense cities. Procedia Engineering, 180(2017), pp. 1379-1387. https://doi.org/10.1016/j.proeng.2017.04.301 [ Links ]
SHAJI, L.S. & KINI, M.K. 2016. Contextual Form Based Coding as a tool in urban design process - Chalai, Thiruvananthapuram as a case. In: Procedia Technology, 24(2016), pp. 1714-1725. [ Links ]
STOFFBERG, G.H., VAN ROOYEN, M.W., VAN DER LINDE, M.J. & GROENEVELD, H.T. 2010. Carbon sequestration of indigenous street tree; in the city of Tshwane, South Africa. Urban Forestry & Urban Greening, 9(1), pp. 9-14. https://doi.org/10.1016/j.ufug.2009.09.004 [ Links ]
THE GUARDIAN. 2016. Story of cities #13: Barcelona's unloved planner invents science of urbanisation. The Guardian. International edition. [online]. Available at: <https://www.theguardian.com/cities/2016/apr/01/story-cities-13-eixample-barcelona-ildefons-cerda-planner-urbanisation>. [Accessed: 24 August 2018]. [ Links ]
THE INTERNATIONAL BANK FOR RECONSTRUCTION AND DEVELOPMENT & WORLD BANK. 2010, pp. 1-81. [ Links ]
TSHWANE ONLINE E-GIS VIEWER. Zoning of the Pretoria Central Core. [online]. Available at: https://e-gis002.tshwane.gov.za/E_GIS_Web/ [Accessed: 27 August 2018]. [ Links ]
UN-HABITAT. 2014. A new strategy of sustainable neighbourhood planning: Five principles. Discussion Note 3. United Nations. [ Links ]
VAN HOVE, B., BLOCKEN, B., VAN DEN DOBBELSTEEN, A., SPIT, T. & BOSCH, P. 2014. Climate proof cities - Final report. Dutch research programme 'Knowledge for Climate', co-financed by the Dutch Ministry of Infrastructure and Environment. [ Links ]
VISITSAK, S. & HABERL, J.S. 2004. An analysis of design strategies for climate-controlled residences in selected climates. In: Proceedings of the First National IBPSA-USA Conference, Boulder, CO, 4-6 August, pp. 1-11. [ Links ]
WATSON, D. & LABS, K. 1983. Climatic design: Energy-efficient building principles and practice. Part II. New York, NY: McGraw-Hill, Inc. [ Links ]
WIKIPEDIA. 2018. Original plan for the extension of Barcelona (1859) (Museu d'Historia de la Ciutat, Barcelona). [online]. Available at: <https://en.wikipedia.org/wiki/Ildefons_Cerdà> [Accessed: 8 November 2018]. [ Links ]
Peer reviewed October 2018
Revised October 2018
The authors declared no conflict of interest for this title or article
1 See Figure 1 for the various heating and cooling zones.
2 Weather files with an A2 climate change scenario as defined by the IPCC (2000: 3-5) were used to calculate these values.
3 Actual north-south street block orientation of the CBD of Pretoria. The axis is turned slightly west of north (Figures 5, 6A and 7).
4 The exact dates vary slightly between years, but never varies more than a day.
5 Average insolation hours for only building 2.
6 Shading characteristics for buildings 1, 2 and 3.
7 Average insolation hours for only building 2.
8 Shading characteristics for buildings 1, 2 and 3.

