


Services on Demand
Article
 English (pdf)
 Article in xml format
 Article references
Indicators

Related links
-
 Cited by Google
 -
 Similars in Google
Share

 Permalink
Town and Regional Planning
On-line version ISSN 2415-0495
Print version ISSN 1012-280X
Town reg. plan. (Online) vol.72 Bloemfontein 2018
http://dx.doi.org/10.18820/2415-0495/trp72i1.5
ARTICLES
http://dx.doi.org/10.18820/2415-0495/trp72i1.5
Do social grants contribute to the jobless population growth in the former South African homelands?
Dra maatskaplike toelaes by tot die werklose bevolkingsgroei in die voormalige Suid-Afrikaanse tuislande?
Na tjhelete eo mmuso o e fang setjhaba e na le kgahlamelo kgolong ya setjhaba se senang mesebetsi metseng ya pele ya Afrika Borwa?
Herman GeyerI; Mawande NgidiII; Gerbrand MansIII
ICentre for Regional and Urban Innovation and Statistical Exploration (CRUISE), Department of Geography and Environmental Studies, Stellenbosch University, Private Bag X1, Matieland 7602, South Africa. Phone: 021 808 9223, e-mail: <hsgeyerjr@sun.ac.za>
IIGauteng Office of the Premier, Gauteng Provincial Government, 1 Central Place, 30 Rahima Moosa Street, Newtown, Johannesburg 2001, South Africa. Phone: 011 298 5640, e-mail: <mawande.ngidi@gauteng.gov.za>
IIIBuilt Environment, CSIR Building 2A, Meiring Naudé Road, Brummeria, Pretoria 0001, South Africa. Phone: 012 841 2552, e-mail: <gmans@csir.co.za>
ABSTRACT
The former homelands and tribal authorities have large populations and high densities with low levels of economic activity and low employment. Population growth in these settlements is in contrast to expectations of population declines, due to urban migration. A possible reason could be the high level of dependency on social grants in the former homelands. The article analyses population growth rates, economic growth rates and the ratio of social grant recipients within former homeland settlements between 1996 and 2011. By using weighted multiple regression tests, the article determines whether the phenomenon of population growth, in the absence of significant economic activity, is linked to welfare transfers. The results indicate that population growth is the product of increases in age cohorts qualifying for social grants in rural areas, due to high birth rates and pensioner in-migration from urban areas. By contrast, other age cohorts show population declines.
Keywords: Former homelands, population, social welfare, tribal authorities, urbanisation
ABSTRAK
Die voormalige tuislande en stamowerhede het groot bevolkings en hoë digthede met lae vlakke van ekonomiese aktiwiteit en lae indiensneming. Bevolkingsgroei in hierdie nedersettings is in teenstelling met verwagtinge van bevolkingsdalings as gevolg van stedelike migrasie. 'n Moontlike rede kan die hoë vlak van afhanklikheid op sosiale toelaes in die voormalige tuislande wees. Die artikel analiseer bevolkings-groeikoerse, ekonomiese groeikoerse en die persentasie maatskaplike toelaag-ontvangers in voormalige tuislandnedersettings tussen 1996 en 2011. Deur gebruik te maak van geweegde meervoudige regressietoetse, bepaal die artikel of die verskynsel van bevolkingsgroei, in die afwesigheid van beduidende ekonomiese aktiwiteit, gekoppel is aan welsynsoordragte. Die resultate dui daarop dat bevolkingsgroei die produk is van die toename in ouderdomsgroepe wat kwalifiseer vir maatskaplike toelaes in landelike gebiede, as gevolg van hoë geboortekoerse en pensioenarisbevolkingsin-migrasie uit stedelike gebiede. In teenstelling hiermee toon ander ouderdomsgroepe bevolkingsafnames.
Sleutelwoorde: Bevolking, maatskaplike welsyn, stamowerhede, verstedeliking, voormalige tuislande
TUMELO
Metse ya pele ya mahae (homelands) le merabe e nang le balaodi, e na le baahi ba bangata haholo, hammoho le ho teteana/petetsana (densities) ho phahameng; ho nang le tshebetso e tlase ya moruo le mesebetsi e tlase. Kgolo ya baahi dibakeng tsena e fapane ho ditebello tsa ho fokotseha ha baahi ka lebaka la ho fallela ditoropong. Lebaka le ka bang teng e kanna ya ba boitshetleho bo boholo/bo matla hodima ditjhelete tsa mmuso metseng ya pele ya mahae. Atikele ena e hlahloba sekgahla sa kgolo ya baahi, sekgahla sa kgolo ya moruo le karolelano ya tjhelete eo mmuso o e fileng baahi ba metseng ya pele ya mahae pakeng tsa 1996 le 2011. Ka ho sebedisa mekgwa e mengata ya taolo e lekanyeditsweng, atikele e fumana hore na kgolo e makatsang ya baahi, e se nang moruo wa bohlokwa o tswellang pele, o kopanngwa le ho fetiswa ha thekolohelo, di na le kgahlamelo efe. Diphetho di bontshitse hore kgolo ya baahi e etswa ke ho eketseha ha dihlopha tse dilemong tsa ho fumana thuso ya ditjhelete ya mmuso dibakeng tsa mahae; ka lebaka la sekgahla se seholo sa ho tswalwa ha bana le maqheku a fallelang ditoropong. Ka lehlakoreng le leng, dihlopha tse ding tsa dilemo di bontsha ho fokotseha ha baahi.
1. INTRODUCTION
Due to the implementation of apartheid-era migration restrictions, a large proportion of the Black African population is concentrated in the peripherally located former homelands (FHLs), most of which were reorganised as tribal authorities (TAs) post-apartheid (Bakker, Parsons & Rauch, 2015: online). However, contrary to expectations of population declines, due to outmigration to locations with higher levels of employment and economic growth after the removal of apartheid-era migration restrictions (Beavon, 1992: 232; Smith, 1992: 7), populations are increasing in the primarily agrarian, peripherally located and underdeveloped FHLs. Numerous cross-country empirical studies support the notion of general positive relationship between population growth and economic growth rates, with urbanisation rates correlated with local per capita income growth (Fox, 2011: 4; Heady & Hodge, 2009: 221; Wesley & Peterson, 2017: 1). The relationship between economic growth and urbanisation is mutually reinforcing, with the concurrent spatial concentration of population and the spatial agglomeration of economic activity, resulting in increased returns for higher levels of economic agglomeration and further urbanisation (Fujita & Thisse, 2002: 62; Ottaviano & Thisse, 2004: 17). These patterns of concurrent population concentration and economic agglomeration are also evident in most of South Africa, with the exception of the FHLs. The jobless population growth in the FHLs constitutes a contradiction to the general positive relationship between population concentration (growth) and economic agglomeration (growth).
A possible explanation of this phenomena may be that social grants, handed out by the South African government, incentivise population growth in peripheral areas with few job opportunities. Although a few empirical studies on FHL give some insights into labour migration patterns, none offers insight into a possible link between population growth in the absence of economic growth rates (Kok & Collinson, 2006; Kok, O'Donovan, Bouare & Van Zyl 2003; Posel, 2006; Posel & Casale, 2003). This article analyses this phenomenon by first using descriptive statistics to verify whether this phenomenon of population growth in the absence of economic growth can possibly be linked to welfare transfers. Secondly, the article analyses the relationship between population growth, grant recipient age cohorts and economic growth using weighted multiple linear regression tests, to determine the impact of social grants on population growth in the FHLs.
2. LITERATURE REVIEW
2.1 Spatial distribution and population growth
The distorted spatial structure of South African settlements is, to a large degree, inherited from earlier apartheid-era settlement patterns, in which a large percentage of the Black African population were restricted to homeland areas under the Bantu Authorities Act of 1951 (Nel, Hill & Binns, 1997: 57). The majority of these developed into densely populated peripheral rural settlements (DCGTA, 2009: 17).
After the repeal of racially based migration barriers at the end of apartheid, most of the migration occurred towards areas with higher employment rates, and thus high in-migration was associated with increasing urbanisation (Kok et al., 2003: 59). It was expected that the densely populated settlements in the peripherally located FHL regions would experience similar population declines through outmigration to major centres of employment (Beavon, 1992: 232; Smith, 1992: 7).
However, the population in these dense rural settlements increased in absolute terms.
This creates a highly polarised and unevenly distributed spatial economy in South Africa, as indicated in the 2009 National Urban Development Framework in Figure 1. Approximately 24% of the population resides in the high-density periphery, even though only 4% of the GDP is produced in these areas. This is in contrast to 71% of the population concentrated in core cities and city regions, producing 88% of the GDP (DCGTA, 2009: 17). The high-density periphery poses a developmental challenge for South Africa. Economic growth is limited by low levels of per capita resources, the outmigration of economic active persons, widespread poverty, and low levels of public services (Nhlapho, Kasumba & Ruhiiga, 2011: 49; Van Huyssteen, Mans, Maritz, Le Roux & Ngidi, 2014: 206). Furthermore, the economic development potential of the FHLs incorporated as TAs is limited due to the insecurity of communal forms of tenure (Cousins, 2007: 297).-

2.2 Different FHL settlement types
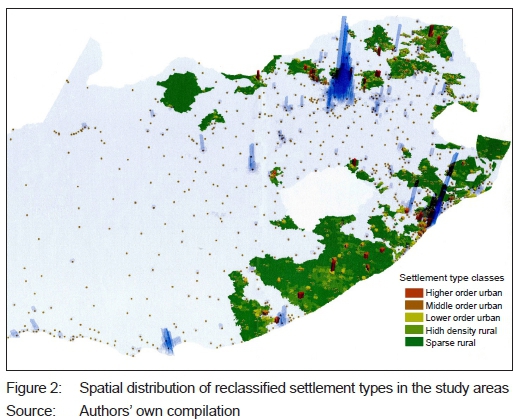
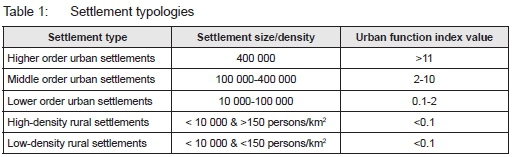
FHLs consist of 13.4% of the land and 37.9% of the population, as well as of a range of urban and rural settlement types, as indicated in Figure 2. The CSIR settlement typology (Van Huyssteen, Biermann, Naude & Le Roux, 2009: 17) categorises FHLs into three urban classes, as indicated in Table 1. Higher order urban settlements represent major urban employment centres with a large diversified economy and more employment opportunities. Middle- and lower order urban settlements represent smaller regional centres with small economies and lower employment opportunities. High- and low-density rural settlements are classified as rural, due to their urban function index value and differentiated by population densities (Table 1).
2.2.1 Rural density settlements (FHL and TAs)
Although most of the FHL settlements and TAs are agrarian in character and lack the economic functionality and diversity of conventional urban areas, many of these settlements have large populations and high densities that would classify them as urban settlements (Kok & Gelderblom, 1994: 99). This is termed "displaced urbanisation" (McCarthy & Bernstein, 1998: 13). It is difficult to classify these settlements as urban settlements, since the classification of urban land uses is generally aligned to local settlement typologies (Quadeer, 2004: 5; Cohen, 2004: 42). The spatial structure of these settlements generally consists of numerous small urban-type settlements surrounded by small farms. However, most of the economic activity is agrarian, consisting of subsistence farming, small-scale informal trading and local resources harvesting, even though only a small proportion of the households are actively engaged in agriculture, due to land shortages (Thornton, 2009: 17).
The difficulty in designating these settlements as urban is the legislative vacuum, in which these properties operate. TAs consist of communally owned land, in which membership rights are customarily based on historic tribal identities and uncodified colonial-era land-ownership structures, and in which the title ownership specifics are often vague (King, 2011: 304). When the TAs were originally registered as communal property associations under the Communal Property Associations Act No. 28 of 1996, these were highly contested by tribal leaders, and later repealed as unconstitutional, and have recently been modified under the Communal Property Associations Amendment Bill of 2016. In reality, the ownership, administration, use and transfer of properties are presently organised through a complex process of codified municipal by-laws and tacit customary procedures. Although municipal authorities are formally responsible for the provision of basic services, local affairs are generally tacitly conducted through the mediation of hereditary tribal leadership, and often the persons in these authorities are one and the same (Nhlapho et al., 2011: 50). Yet, TAs for the most part provide an important safety net in terms of providing free land and a social network for more vulnerable persons, including the unemployed, the undereducated, the disabled, the elderly and children (King, 2011: 299). Members operate loosely as extended, fragmented households residing in multiple locations, with more vulnerable members often residing in TAs, and economically active persons residing elsewhere. Thus, a large section of the population in FHLs depends on state pensions and migrant remittances as their primary sources of income (Kok & Gelderblom, 1994: 155).
2.2.2 Urban settlements (peripheral urban centres)
A possible reason for the population growth in the FHLs could be the in-migration of rural populations to urban centres in the FHLs. A proportion of FHLs are located on the periphery of major cities in South Africa (Horn, 2002). In these areas, the vast majority of the population are migrants from other TAs, who migrated to these settlements during and after apartheid, in order to access job opportunities. A larger proportion of the population in the FHLs resides in peripheral urban centres. Many of these consist of isolated former apartheid-era administrative centres, industrial de-concentration nodes and agricultural betterment scheme centres surrounded by high-density rural settlements (Atkinson, 2014: 16).
These urban areas presently have hardly any economic activity outside of government functions; they provide benefits to vulnerable persons in terms of public housing and basic services (Atkinson, 2014: 17).
2.3 Social grants
Much of the growth in FHLs could possibly be explained through circular migration remittances as an extended household pooling strategy (Atkinson, 2014: 42, 45). However, the level of remittances received by residents in TAs are dwindling, due to outmigration of economically mobile households, declining labour absorption, the rising costs of urban lifestyles (Neves & Du Toit, 2013: 95; Cross, Tobias & Mbhele, 1998: 640), and the improved coverage and increased values of social pensions and child grants in the rural areas (Singh, 2005: 11). The South African social grants are social assistance payments to provide poverty relief to vulnerable households (Hagen-Zanker, Morgan & Meth, 2011: 34; Noble, Zembe & Wright, 2014: 3; Williams, 2007: 1). The postapartheid government has extended grants to reduce poverty among poor households with children, the elderly and the physically disabled, with pensions receiving a disproportionate amount above that of minimum wage employment and other grants (Samson, MacQuene & Van Niekerk, 2006: 12). The number of grant beneficiaries in South Africa rose from 2 million to 14 million between 1996 and 2010, with approximately 80% of this increase due to the introduction of child-support grants. The increase in state-grant distributions was achieved by reducing the value of the later non-pension grants (Triegaardt, 2005: 250). As the population receiving grants exceeds the employed population, South Africa is proportionally the largest welfare state in the world (Samson et al., 2006: 1).
Some commentators view grants, particularly pensions, as creating dependency, de-incentivising people from seeking employment (Meth, 2008: 5). One third of households are dependent on social grants as their main source of income through intra-family grant-pooling strategies (Leubolt, 2014: 3). In households where grants are pooled, pensions have a significant negative effect on the employment of male household members, particularly when the pensioners are female, but pensions also significantly facilitate the temporary migration of female household members to seek employment (Bertrand, 2003: 34). As for other grants, the low level of grant benefits, particularly child-support grants, as opposed to the remuneration of minimum wage employment, does not make employment disincentives very likely. With the exception of pensions for the elderly, most of the beneficiaries receive a fraction of that which they would have otherwise received in formal employment (Surender, Noble, Wright & Ntshongwana, 2010: 209). However, the artificial inflation of household income through social grants potentially enables the poorest, most isolated households to subsist, even if they have no formal income sources or cannot participate in subsistence agriculture (Bosch, Rossouw, Claassens & Du Plessis, 2010: 6). As this could potentially influence population growth in peripheral high-density rural areas without the commensurate economic development, this article analyses the relationship between population growth and social grants in the different settlement types in the FHLs.
3. RESEARCH
The study analyses the relationship between population growth and social grants in the different FHL settlement types and in different age cohorts, using basic statistics and multiple regression analysis. A quantitative methods design was used to test a particular phenomenon by gathering numerical data and generalising it across groups of people (Babbie, 2010). The reason for collecting quantitative data is that weighted multiple linear regression tests could be used to And a relationship between population growth in the FHLs despite low levels of economic activity, by testing a possible relationship between population growth and age groups qualifying for social grants (Black, 1999). It tests whether social grants de-incentivise populations from urbanising to cities with economic development potential, resulting in the continuance of high-density periphery. Considering that over one third of South African households are social-grant beneficiaries, it could have significant adverse spatial implications (Hagen-Zanker et al., 2011).
3.1 Study area, sample size and sampling method
The study sampled the FHLs, as most of the TAs are located within the FHLs and most of the TAs outside the FHLs did not exist during the 1996 census sample period. The standard spatial unit of analysis in the study is the CSIR Meso-Frame, which consists of almost equally sized (± 50km2) polygons, varying to include key physiographic features such as height contours and rivers, resulting in an irregular geo-frame of 25001 polygons, of which 3513 are located in FHL areas (Mans, Van Huyssteen, Le Roux & Green, 2013: 4). The data was reaggregated to the Meso-Frame to allow spatiotemporal comparability, using spatially weighted measures for detailed settlement analysis using dasymetric mapping and aerial interpolation.
The study used the CSIR settlement typology (Van Huyssteen et al., 2009: 17) categorising the Meso-Frame units into three urban classes and two rural classes, based on population thresholds within major conurbations and the size and diversity of its economy, as determined by the urban function index (Geyer, 2008). The urban function index represents the size of the local economy relative to the largest urban centre in a rank-size distribution *100. The rest of the land and population was used as a control sample.
3.2 Data collection
Basic statistics was used to determine whether population growth occurred in FHLs; whether economic growth was significantly lower than in other regions, and whether population growth can be explained by migration to urban FHLs in proximity to major economic centres. Specifically, spatial population data was acquired from StatsSA census sub-places data for the two census years (1996 and 2011) and aggregated to the Meso-Frame units, using the ESKOM SPOT Building Count. To analyse economic growth trends, the study calculated the proportional Gross Value-Added product (GVA) per Meso-Frame as a weight, based on CSIR's Geospatial Analysis Platform (GAP) values for 1996 and 2011 (CSIR, 2017). To control for inflation, the data is presented in constant 2010 values.
To determine whether the population growth occurs among age groups qualifying for social grants, basic statistics on grant dependency were disaggregated into settlement types and age cohorts. The spatial distribution of social grant recipient data was sourced from the South African Social Security Agency at the municipal ward level based on 2013 IEC data. The social grant data was disaggregated, regionally based on collection points, re-aggregated using the same technique applied to the population and redistributed to the Meso-Frames.
Five different weighted multiple linear regression tests were conducted to determine a relationship between relative population growth, economic growth and social grants. Linear regression is the most commonly used regression to predict the significance and impact of the intermediate variables on the dependent variable outcomes (Black, 1999).
3.3 ANALYSIS METHODS
To control for natural national population growth inflating population distributions, the study distinguishes between absolute (net) population growth and the relative share of the population, due to concentration and diffusion patterns. To weight the relative population growth in the different spatial areas, the following equation was used:
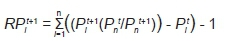
Where  is relative population growth in area i during period t+1 controlling for natural national population growth and Pf is the population in area i during period t. This formula analyses the relative population distribution in age cohorts over the two census periods to determine in- or out-migration. As the formula controls for births and deaths, the age cohorts only indicate growth through migration. This formula also weights the relative changes in economic distributions between areas to indicate the level of spatial economic agglomeration or diffusion patterns, controlling for national economic growth (Geyer jr & Geyer, 2015).
The multiple linear regression test used population growth as the dependent variable, and social grant transfers, social grant recipients, economic growth, wages and urbanisation rates as independent variables, respectively. The data was weighted by the 2011 population to overcome a large variance in the observations in areas with low populations, particularly in rural areas, by reporting the beta coefficients (sensitivity of DVs to changes in IVs), R-sq. values (explanatory value), p-values (statistical significance of the correlations) and standard errors (regression accuracy) tests to analyse the effects that the independent variables have on the dependent variable (Uyanik & Güler, 2013: 234). The R-sq. is predictably low, given the wide range of social, communal and psychological factors impacting on migration behaviour, as is experienced in other econometric tests (Posel, Fairburn & Lund, 2006). The variance inflation factors were below 1.7 (below the 2.6 borderline), indicating that multicollinearity is not significant (the coefficient is not statistically significant).
3.4 DATA LIMITATIONS
The inability to obtain temporal social-grant beneficiary data during other periods meant that it was not possible to conduct a temporal analysis on social grants. Therefore, social-grant recipient data was utilised as a proxy for the quantity and spatial distribution of grant recipients. Based on the large sample size, the data was considered to be sufficient to conduct the analysis and produce valid results.
4. FINDINGS
4.1 Population and economic growth trends in the FHLs
To determine whether economic growth in FHL settlements is significantly lower than other regions, the changes in GVA in the FHLs and the rest of South Africa was analysed. Table 2 indicates the changes in GVA in the FHLs and the rest of South Africa.
The results indicate that the GVA per capita contribution of the FHLs is extremely low, reflecting low productivity and wages in these areas. The per capita FHL GVA was only 19.2% and 25.6% of the value of the per capita GVA in the rest of South Africa in 1996 and 2011, respectively. As a proportion of the total economic output of South Africa, the FHLs only contributed 13.2% and 13.6% of the total national GVA in 1996 and 2011, respectively.
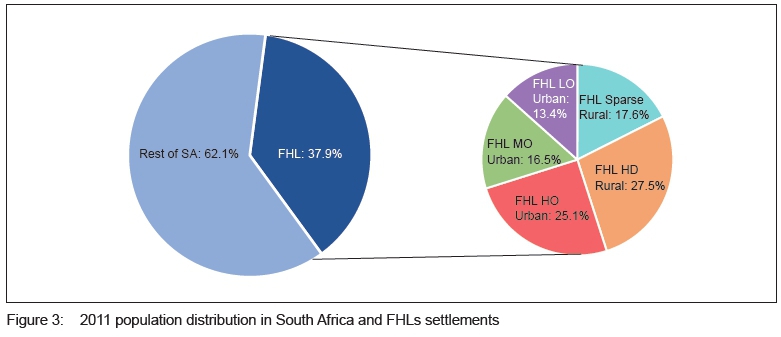
To determine whether population growth occurred in the FHLs, the 2011 population distribution in South Africa was analysed and is represented in Figure 3. It shows that 37.9% of the total South African population is found within FHLs, with 54.9% of the FHL population located within urban centres, the largest proportion of which are located within higher order city regions. Another 45.1% of the FHL population live in rural areas, with 27.5% located in high-density rural settlements and the remaining 17.6% located within low-density sparse rural settlements.
Table 3 indicates that the population increased in both areas demarcated as FHLs and in the rest of South Africa between 1996 and 2011. The population in the FHLs areas increased by 9.9% over the 15-year period with an average per annum population growth of 0.66%. The absolute population growth in the FHLs contradicts the low share of GVA and low per capita GVA in FHLs.
However, as indicated in Table 2, the GVA in the FHLs has grown at a marginally higher rate of 4.6% per annum than the rest of South Africa at 4.1% per annum. The per capita GVA in FHLs increased by 53.3% as opposed to 14.3% in the rest of South Africa. The higher productivity growth in FHL areas might explain why population growth occurs in FHLs. Furthermore, as indicated in Table 3, when weighted, the relative population share in the FHLs declined by 13.4%, while the relative population share in the rest of South Africa increased by 9.9%. The relative population growth serves as a proxy for spatial population agglomeration/diffusion, weighted by absolute population increases. Thus, while absolute FHL population growth was positive and proportional levels of economic activity in FHLs was lower, the FHL population declined significantly as a share of the total population and FHL is experiencing marginally increasing levels of economic activity higher than in the rest of southern Africa. This motivates further analysis to determine why this occurs.
4.2 Population and economic growth trends in settlement types in the FHLs
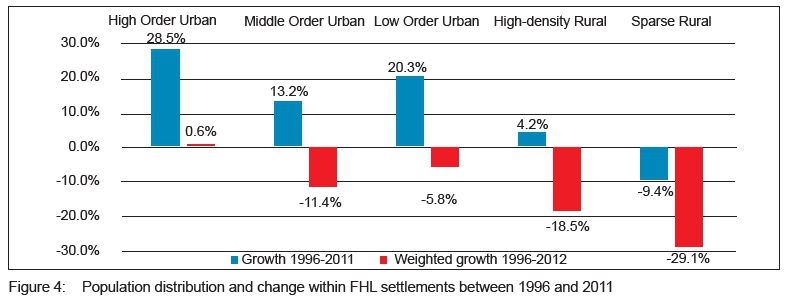
To determine whether the population growth can possibly be explained by migration to urban FHLs in proximity to major economic centres, the study disaggregates the FHL population and economic growth data into settlement types. Figure 4 indicates the absolute and weighted relative population growth in the FHL areas, controlling for national natural birth and death rates, disaggregated according to settlement type. Although strong absolute population growth occurred in the urban and high-density rural areas, only in the higher order urban centres corresponding to cities and city regions did population growth occur (28.5%) at levels comparable to the national population growth, evident in the positive population agglomeration in the relative population growth figure (0.6%). In the widely distributed FHL lower order urban settlements in close proximity to rural areas, the absolute and relative population growth (13.2% and -11.4%, respectively) was lower than in the peripheral FHL middle order settlements, predominantly corresponding to defunct apartheid-era administrative centres, industrial de-concentration nodes and agricultural betterment schemes (20.3% and -5.8%, respectively). Although the population in high-density rural settlements increased slightly in absolute terms (4.2%), proportionally the relative population share (-18.5%) declined. The population in sparse rural areas declined significantly in this period, in both absolute and relative terms (-9.4% and -29.1%, respectively).
Thus, there are strong population diffusion patterns away from rural settlements. This suggests that there are substantial incentives for the FHL populations to migrate over short distances to lower order FHL urban centres close to their places of origin, as these smaller urban centres usually offer housing and basic services to their surrounding rural hinterlands. Thus, much of the population growth in FHLs is a product of urbanisation within FHLs, not urbanisation to areas of significant levels of economic activity.
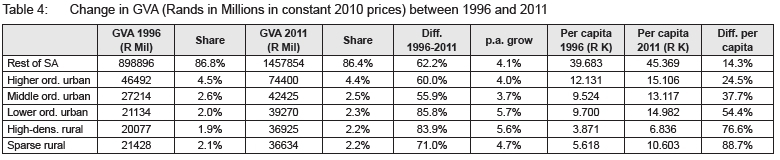
Table 4 indicates the changes in GVA in different settlement types in the FHLs and the rest of South Africa. The higher, lower and middle-order urban settlements remain the highest contributors to per capita GVA production in these areas in that order, consistent with the order of population growth in Figure 4. However, the GVA is far lower in these areas than in the rest of South Africa. Furthermore, lower GVA growth in the rural settlements is consistent with lower population growth, however, the lowest per capita GVA is in high-density rural settlements, despite their higher population densities and positive absolute population growth as opposed to sparse rural settlements. The data confirms that population growth is occurring in areas where hardly any economic activity occurs, in contradiction to expected out-migration, particularly in high-density rural areas. This may be due to social grants substituting for lagging wages despite stagnant economic activity.
4.3 Social-grant recipients in age cohorts in the FHLs
To determine whether social grants result in higher population growth in FHLs, the distribution of social-grant recipients in different settlement types are analysed. The FHL population is also disaggregated into age cohorts to determine whether this population growth occurs among age groups qualifying for social grants. Figure 5 indicates the proportion of grant recipients for the FHL and the rest of South Africa in different settlement typologies. There is a significantly higher proportion of grant recipients in the FHLs (20.4%) than in the rest of South Africa (12.8%), indicating a higher household dependency on grant income in these areas. The proportion of grant recipients in FHLs decreases inversely proportional to the size and density of settlements, with the highest proportion of recipients in high-density and sparse rural settlements (22.4% and 23.8%, respectively), and the lowest proportion of the recipients in higher, middle-, and lower order urban settlements (17.4%, 18.6% and 20.0%, respectively). Inversely, the proportion of grant recipients in the rest of South Africa is highest in higher and middle-order urban settlements (28.3% and 22.5%, respectively), exceeding that of similar type settlements in the FHLs. In the lower order urban, high-density rural and sparse rural settlements in the rest of South Africa, the proportion of recipients is far lower than in similar type settlements in the FHLs (16.7%, 18.0% and 10.5%, respectively). On the basis of higher proportions of grant recipients in FHLs, the inverse distribution of grant recipients in FHLs vis-â-vis the rest of South Africa and the minimal per capita GVA in the FHL areas, it can be reasonably hypothesised that the disproportionate population growth in the FHLs areas could be linked to the population growth in grant recipient age cohorts through births and in-migration.
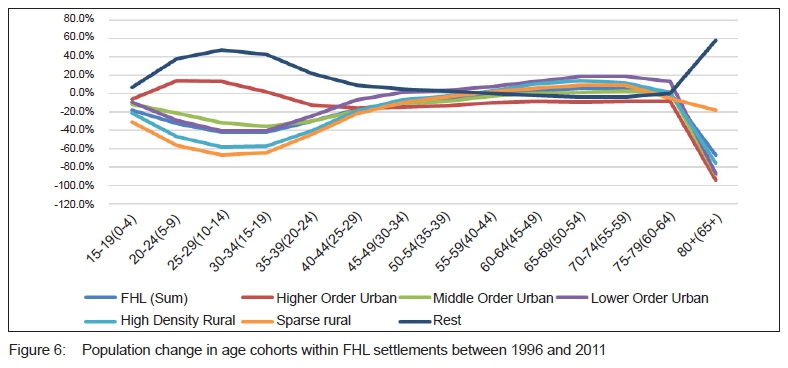
Figure 6 shows the proportional change of population totals in the different age cohorts in different settlement types in FHLs and in the rest of South Africa, due to migration. The data is weighted to control for immigration and mortality. The X-axis variables indicate the 2011 age cohorts, and the variables in brackets indicate the respective cohort ages in 1996. Generally, the data indicates negative population growth for all age cohorts in the FHLs presently between the ages qualifying for child grants and the ages qualifying for pensions, due to net out-migration.
The net positive population growth in FHLs in Table 3 is attributed to births since 1996 (0-15 in 2011) exceeding out-migration and mortality rates. All urban settlements in the FHLs experienced low-level declines in the school-going age cohorts of 15-19 (0-4 in 1996), qualifying or immediately subsequent to qualifying for child grants (grants are available up to the age of 18). This indicates that child grants are not an incentive for in-migration to FHLs, but reduce the level of out-migration in the FHLs, as population declines are far lower than in subsequent categories not qualifying for grants. Most of the FHLs in middle- and lower order urban settlements and rural settlements experienced high levels of population declines in the younger working age population cohorts of 20-44 (5-29 in 1996). Conversely, higher order FHL urban settlements and the rest of the country reflect high levels of population growth in the age cohorts of 20-34 (5-19 in 1996). This can be linked to employment- or education-motivated out-migration from FHL rural and peripheral urban settlements to large cities. In the older working age population cohorts of 45-64 (30-49 in 1996), the out-migration from FHL settlements to the rest of South Africa declined; yet FHL settlements continued to show low levels of net population declines and the rest of South Africa population growth in these age cohorts. However, in the retirement age cohorts 60-74 (45-59 in 1996), the FHL rural, middle- and lower order urban settlements experience population growth, due to in-migration, while FHL higher order urban settlements and the rest of South Africa experience population declines in those age cohorts, indicating a pattern of out-migration by pensioners. In the 75+ (60+ in 1996) age cohorts, the FHLs again experience population declines and the rest of South Africa population growth, presumably due to the need for improved health care for the elderly.
While the FHLs experienced positive population growth, the weighted population growth in all but higher order urban settlements linked to major cities was negative. However, when disaggregated into age cohorts, the data indicates that net population growth was indeed significantly higher in the predominant social-grants categories of old-age pensions and child grants, supporting the thesis for social grants motivating population growth in peripheral areas.
4.4 The relationship between social grants, population growth and economic growth
The first regression investigated all FHLs, adding urban as a dummy variable (segmenting urban from non-urban areas), to give an overview of the relationship, before the data is disaggregated as represented in Table 5.
The regression results are significant (F(6;2886)=50.836, p<0.05). There is a significant negative relationship between population growth and grant dependency, and a positive relationship between population growth and urbanisation which indicates that grant dependency increases in areas where out-migration occurs to urban areas. This is supported by a positive correlation with child- and pensioner-grant recipient categories. Population growth in FHLs is thus a product of in-migration of pensioner recipients and the birth of child-grant recipients. Population growth is significantly positively correlated to economic activity, but the beta coefficients are very low, as to be relatively insignificant, and is not significantly correlated to the local wage rate. However, the adjusted R-sq. is 0.094, which indicates that only 9.4% of the variation in population growth can be explained by the analysis factors. This is partially attributable to the wide range of diversity between settlement types and sizes in the FHLs.
The second regression only investigated peripheral middle- and lower order urban FHL settlements, which generally have lower levels of economic activity and wages, as indicated in Table 6.
The regression is significant (F(5,750)=9.200), p<0.05). Again, there is a significant negative relationship between population growth and grant dependency, and a positive relationship with pensioners, but also a negative correlation with the child-grant recipients, indicating that increasing grant dependency occurs due to the high in-migration of pensioners, despite the net out-migration of children with their parents. As the beta coefficient of the grant recipients is lower than in the first regression, this indicates that grant dependency does not decrease as much with population growth in peripheral urban areas. Again, population growth economic activity has low beta coefficients and is not significantly correlated to the local wage rate.
The third regression investigated rural FHL settlements, which include the typical high-density rural settlements with displaced urbanisation, as indicated in Table 7.
The regression indicates a significant positive correlation between population growth and grant recipients, a significant negative correlation with child births, but a significant positive correlation with increasing numbers of pensioners. This shows that in rural FHLs the population growth can be link to receiving social grants as well as to the increase in pensioner in-migration. Although population growth is significantly positively correlated to local economic activity and negatively correlated to local wages, the low beta coefficients make the results insignificant. The regression is significant (F(5,8401)=115.61, p<0.05).
The fourth regression of high-order FHL urban settlements close to major city centres is a control regression to comparatively evaluate population growth in major economic and employment centres.
The regression indicated in Table 8 is significant (F(5, 132)=22.231), p<0.05). The adjusted R-sq. is 0.437, which indicates that 43.7% of the population variation can be explained by the analysis factors, due to the small size of the sample. The negative relationship between population growth and grant dependency is significant and the beta coefficient is very high, indicating that population growth was a function of persons being ineligible for grants. However, the significant positive correlation and high beta coefficients with child- and pensioner-grant recipient categories indicate that much of the population growth in the high-order urban FHLs is associated with the migration of grant recipients to locations close to major urban areas. As migration is not significantly correlated to local economic activity or local wages, it indicates that this migration rarely occurs in locations close to employment opportunities, but can rather be explained by other factors.
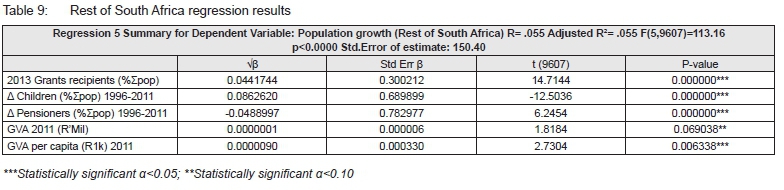
The filth regression of the rest of South Africa as a control sample, as indicated in Table 9, is significant (F(5,9607)=113.16, p<0.05) and the low adjusted R-sq. of 0.055 reflects the diversity in settlement types and migrant motivations. Population growth is significantly positively correlated to increased grant dependency, local economic activity and local wages. This indicates that population growth is a product of the in-migration of working age cohorts and grant-receiving children from FHLs, due to better wages in areas with higher levels of economic activity. However, consistent with the hypothesis, population growth is also significantly negatively correlated to pensioner age cohorts, due to a net out-migration of pensioner populations to FHLs.
CONCLUSION
The article analyses the phenomenon of population growth in Black-owned FHL and TA areas, despite the low-level economic development in these areas as compared to the rest of the country.
Although the FHLs contain almost 38% of the national population, it consists of only 13% of the national economy and local incomes are a quarter of the rest of South Africa. High-density rural settlements have the lowest per capita wages, even lower than in sparse rural areas. Yet, positive population growth occurs in many of the FHL areas. Most of this growth occurs in urban areas; a low level of population growth occurs in high-density rural settlements, and population declines occur in sparse rural settlements. Population growth in dense rural settlements, small widely distributed peripheral urban settlements, and defunct apartheid-era growth nodes presents a paradox that results in a distorted spatio-economic demography in South Africa.
A higher proportion of the FHL population receives social grants than the rest of South Africa. Although the proportion of social grant recipients in higher and middle-order urban FHL settlements is lower than in the rest of South Africa, the proportion in low-order urban and rural FHL settlements is significantly higher than in the rest of South Africa, particularly in rural settlements. On this basis, the population growth in FHL areas could be linked to the disproportionate social grant welfare transfers, despite minimal economic activity. When analysed in terms of changes in age cohorts as a proxy for migration, most of the population growth in the FHL areas is a product of the increase in major grant recipient age categories, particularly the birth of children and the in-migration of pensioners. On the other hand, population growth is negative in the working age cohorts not eligible for grants.
The weighted multiple linear regression indicates that the population growth in FHLs is positively correlated to the increase of grant recipients. Population growth in FHLs is partially a product of childbirth and in-migration pensioners, the primary recipients of social grants. However, population decreases occur, due to the out-migration of working age populations not eligible for grants, resulting in negative relative population growth. The data indicates that economic activity and wages are insignificant. When disaggregated for different settlement types, the regression data further indicates that FHL grant dependency increases are mostly a product of pensioner migration, with most of the growth in children recipients occurring in high-order urban settlements close to major employment centres. On the other hand, the control sample of the population growth in the rest of South Africa is significantly correlated to increases in childbirths, economic activity and wages, whilst showing significant out-migration of pensioners to FHLs. This represents a new phenomenon of cyclical age-related urban and counter-urban migration, linked to differential eligibility of social grants and employment in different age cohorts.
REFERENCES
ATKINSON, D. 2014. Rural-urban linkages: South Africa case study. Working Paper Series No. 125. Santiago, Chile: Territorial Cohesion for Development Program. [ Links ]
BABBIE, E.R. 2010. The practice of social research. 12th edition. Belmont, California: Wadsworth Cengage. [ Links ]
BAKKER, J.A., PARSONS, C. & RAUCH, F. 2016. Urbanisation in post-apartheid South Africa. [Online]. Available at: <http://users.ox.ac.uk/~econ0360/FerdinandRauch/SouthAfrica.pdf> [Accessed: 23 April 2018]. [ Links ]
BEAVON, K.S.O. 1992. The post-apartheid city: Hopes, possibilities, and harsh realities. In: Smith, D.M. (Ed.). The apartheid city and beyond: Urbanisation and social change in South Africa. London: Routledge, pp. 231-242. [ Links ]
BERTRAND, M., MULLAINATHAN, S. & MILLER, D. 2003. Public policy and extended families: Evidence from pensions in South Africa. The World Bank Economic Review, 17(1), pp. 2750. https://doi.org/10.1093/wber/lhg014 [ Links ]
BLACK, T.R. 1999. Doing quantitative research in the Social Sciences: An integrated approach to research design, measurement and statistics. London: Sage. [ Links ]
BOSCH, A., ROSSOUW, J., CLAASSENS, T. & DU PLESSIS, B. 2010. A second look at measuring inequality in South Africa: A modified Gini coefficient. University of KwaZulu-Natal, School of Development Studies. Working paper No. 58. Durban: University of KwaZulu-Natal. [ Links ]
COHEN, B. 2004. Urban growth in developing countries: A review of current trends and a caution regarding existing forecasts. World Development, 32(1), pp. 23-51. https://doi.org/10.1016/j.worlddev.2003.04.008 [ Links ]
COUSINS, B. 2007. More than socially embedded: The distinctive character of 'communal tenure' regimes in South Africa and its implications for land policy. Journal of Agrarian Change, 7(3), pp. 281-315. https://doi.org/10.1111/j.1471-0366.2007.00147.x [ Links ]
CROSS, C., TOBIAS, M. & MBHELE, T. 1998. Constructing migration: Infrastructure, poverty and development in KwaZulu-Natal. Development Southern Africa, 15(4), pp. 635-659. https://doi.org/10.1080/03768359808440036 [ Links ]
CSIR (COUNCIL FOR SCIENTIFIC AND INDUSTRIAL RESEARCH). 2017. Geospatial Analysis Platform (GAP). Pretoria: Council for Scientific and Industrial Research. [ Links ]
DCGTA (DEPARTMENT OF COOPERATIVE GOVERNANCE AND TRADITIONAL AFFAIRS). 2009. National Urban Development Framework harnessing a common vision for growth and development of South Africa's towns, cities and city-regions. Johannesburg: South African Cities Network. [ Links ]
FOX, S. 2011. Understanding the origins and pace of Africa's urban transition: Cities and fragile states. London: Crisis States Research Centre. [ Links ]
FUJITA, M. & THISSE, J. 2002. Economics of agglomeration. Cambridge: Cambridge University Press. https://doi.org/10.1017/CBO9780511805660 [ Links ]
GELDERBLOM, D. & KOK, P. 1994. Urbanisation: South Africa's challenge, Volume 1: Dynamics. Pretoria: Human Sciences Research Council Publishers. [ Links ]
GEYER, H.S. 2008. The urban function index of South Africa. Pretoria: Statistics South Africa. [ Links ]
GEYER, H. S. JR. & GEYER, H.S. 2015. Disaggregated population migration trends in South Africa between 1996 and 2011: A differential urbanisation approach. Urban Forum, 26(1), pp. 1-13. https://doi.org/10.1007/s12132-014-9229-1 [ Links ]
HAGEN-ZANKER, J., MORGAN, J. & METH, C. 2011. South Africa's cash social security grants: Progress in increasing coverage. London: Overseas Development Institute. [ Links ]
HEADY, D.D. & HODGE, A. 2009. The effect of population growth on economic growth: A meta-regression analysis of the macroeconomic literature. Population and Development Review, 35, pp. 221-248. https://doi.org/10.1111/j.1728-4457.2009.00274.x [ Links ]
HORN, A.C. 2002. New perspectives on urban segregation and desegregation in post-resolution South Africa. In: Schnell, I. & Ostendorf, W. (Eds). Studies in segregation and desegregation. Aldershot: Ashgate, pp. 247-284. [ Links ]
KING, B. 2011. Spatialising livelihoods: Resource access and livelihood spaces in South Africa. Transactions of the Institute of British Geographers, 36(2), pp. 297-313. https://doi.org/10.1111/j.1475-5661.2010.00423.x [ Links ]
KOK, P. & COLLINSON, M.A. 2006. Migration and urbanisation in South Africa. Pretoria: Statistics South Africa. (Report 03-04-02). [ Links ]
KOK, P. & GELDERBLOM, D. 1994. Urbanisation: South Africa's challenge. Pretoria: Human Sciences Research Council Publishers. [ Links ]
KOK, P., O'DONOVAN, M., BOUARE, O. & VAN ZYL, J. 2003. Post-apartheid patterns of internal migration in South Africa. Cape Town: Human Sciences Research Council Publishers. [ Links ]
LEUBOLT, B. 2014. Social policies and re-distribution in South Africa. Johannesburg: Global Labour University. [ Links ]
MANS, G., VAN HUYSTEEN, E., LE ROUX, A. & GREEN, C. 2013. Expansion and update of PSS spatial data infrastructure for regional analysis and decision making. Stellenbosch: Council for Scientific and Industrial Research. [ Links ]
MCCARTHY, J. & BERNSTEIN, A. 1998. South Africa's discarded people: Survival, adaptation and current challenges. Johannesburg: The Centre for Development Enterprise. [ Links ]
METH, C. 2008. Basic income grant: There is no alternative. Durban: University of KwaZulu-Natal. [ Links ]
NEL, E., HILL, T. & BINNS, T. 1997. Development from below in the 'new' South Africa: The case of Hertzog, Eastern Cape. Geographical Journal, 63(1), pp. 57-64. https://doi.org/10.2307/3059686 [ Links ]
NEVES, D. & DU TOIT, A. 2013. Rural livelihoods in South Africa: Complexity, vulnerability and differentiation. Journal of Agrarian Change, 13(1), pp. 93-115. https://doi.org/10.1111/joac.12009 [ Links ]
NHLAPHO, M., KASUMBA, H. & RUHIIGA, T. 2011. Growth challenges of homelands in post-apartheid South Africa. Journal of Social Science, 29(1), pp. 47-56. [ Links ]
NOBLE, M., ZEMBE, W. & WRIGHT, G. 2014. Poverty may have declined, but deprivation and poverty are still worst in the former homelands. Cape Town: Southern African Social Policy Research Institute. [ Links ]
OTTAVIANO, G. & THISSE, J. 2004. Agglomeration and economic geography. In: Henderson, J. & Thisse, J. (Eds). Handbook of regional and urban economics. Amsterdam: Elsevier, pp. 2563-2608. [ Links ]
POSEL, D. 2006. Moving on: Patterns of labour migration in post-apartheid South Africa. In: Tienda, M., Findley, S., Tollman, S. & Preston-Whyte, E. (Eds). Africa on the move: African migration and urbanisation in comparative perspective. Johannesburg: Wits University Press, pp. 217-231. [ Links ]
POSEL, D. & CASALE, D. 2003. What has been happening to internal labour migration in South Africa, 1993-1999? South African Journal of Economics, 71(3), pp. 455-479. https://doi.org/10.1111/j.1813-6982.2003.tb00081.x [ Links ]
POSEL, D., FAIRBURN, J.A. & LUND, F. 2006. Labour migration and households: A reconsideration of the effects of the social pension on labour supply in South Africa. Economic Modelling, 23(5), pp. 836-853. https://doi.org/10.1016/j.econmod.2005.10.010 [ Links ]
QUADEER, M. 2004. Urbanisation by implosion. Habitat International, 28(1), pp. 1-12. https://doi.org/10.1016/S0197-3975(02)00069-3 [ Links ]
SAMSON, M., MACQUENE, K. & VAN NIEKERK, I. 2006. Social grants: South Africa. London: Overseas Development Institute. [ Links ]
SINGH, G. 2005. Patterns of migration, settlement and dynamics of HIV/ AIDS in South Africa. Johannesburg: South African Cities Network and Forced Migration Studies Programme. [ Links ]
SMITH, D.M. 1992. Introduction. In: Smith, D.M. (Ed.). The apartheid city and beyond: Urbanisation and social change in South Africa. London: Routledge, pp. 1-12. [ Links ]
SURENDER, R., NOBLE, M., WRIGHT, G. & NTSHONGWANA, P. 2010. Social assistance and dependency in South Africa: An analysis of attitudes to paid work and social grants. Journal of Social Policy, 39(2), pp. 203-221. https://doi.org/10.1017/S0047279409990638 [ Links ]
THORNTON, A. 2009. Pastures of plenty? Land rights and community-based agriculture in Peddie, a former homeland town in South Africa. Applied Geography, 29(1), pp. 12-20. https://doi.org/10.1016/j.apgeog.2008.06.001 [ Links ]
TRIEGAARDT, J.D. 2005. The child support grant in South Africa: A social policy for poverty alleviation? International Journal of Social Welfare, 14(4), pp. 249-255. https://doi.org/10.1111/j.1369-6866.2005.00367.x [ Links ]
UYANIK, G.K. & GÜLER, N. 2013. A study on multiple linear regression analysis. Procedia - Social and Behavioral Sciences, 106(2013), pp. 234-240. https://doi.org/10.1016/j.sbspro.2013.12.027 [ Links ]
VAN HUYSSTEEN, E., BIERMANN, S., NAUDE, A. & LE ROUX, A. 2009. Advances in spatial analysis to support a more nuanced reading of the South African space economy. Urban Forum, 20(2), pp. 195-214. https://doi.org/10.1007/s12132-009-9061-1 [ Links ]
VAN HUYSSTEEN, E., MANS, G., MARITZ, J., LE ROUX, A. & NGIDI, M. 2014. Update of the CSIR/ SACN South African settlement typology. Research Report. Stellenbosch: Council for Scientific and Industrial Research. [ Links ]
WESLEY, E. & PETERSON, F. 2017. The role of population in economic growth. New York: SAGE Open publications, October-December 2017, pp. 1-15. [ Links ]
WILLIAMS, M. 2007. The social and economic impacts of South Africa's child support grant. Cape Town: Economic Policy Research Institute. [ Links ]
Reviewed April 2018
Revised April 2018
The authors declared no conflict of interest for this title or article.

