


Serviços Personalizados
Artigo
 Inglês (pdf)
 Artigo em XML
 Referências do artigo
Indicadores

Links relacionados
-
 Citado por Google
 -
 Similares em Google
Compartilhar

 Permalink
Acta Structilia
versão On-line ISSN 2415-0487
versão impressa ISSN 1023-0564
Acta structilia (Online) vol.30 no.1 Bloemfontein 2023
http://dx.doi.org/10.38140/as.v30i1.7266
RESEARCH ARTICLE
The nexus between monetary and fiscal policies and construction output in Tanzania
Geraldine KikwasiI; Nyamagere Gladys SospeterII, *
ISenior Lecturer, School of Architecture, Construction Economics and Management, Ardhi University, Dar es Salaam, Tanzania. Email: <gkikwasi@yahoo.com>, ORCID: https://orcid.org/0000-0002-0157-69121
IISenior Lecturer, School of Architecture, Construction Economics and Management, Ardhi University, Dar es Salaam, Tanzania. Email: <nyamagere@yahoo.com>, ORCID: https://orcid.org/0000-0002-6938-7018
ABSTRACT
There is insufficient knowledge on the influence of monetary and fiscal policies elements on the construction sector output in Tanzania. Monetary and fiscal policies elements are paramount in decisions pertaining to project viability or feasibility. The purpose of this study is to determine the relationship of monetary and fiscal policies elements with the construction sector output in Tanzania. Accordingly, this study adopts a correlational research design to examine the extant relationship between various elements of fiscal and monetary policies and construction output. Time-series data was obtained from Tanzania National Bureau of Statistics and Bank of Tanzania, covering a period of twenty-three (23) years from 1998 to 2021. The data obtained was tested for stationarity, followed by correlation and regression analysis. Results reveal that construction output is negatively related to commercial bank's weighted interest and inflation rates. On the other hand, construction output is positively related to exchange rate, government expenditure on construction, and total tax on product. Multiple regression analysis revealed similar results, with the exception of exchange rate which has turned out to be negatively related to construction output. Nevertheless, the relationship of construction output and all elements of monetary and fiscal policies is not statistically significant. The study provides knowledge on the nexus between monetary and fiscal policies on the construction sector output within a previously unexplored Tanzanian context. This can help developers make informed decisions on investments in times of high or low inflation and interest rates, and during an upsurge of exchange rates. It also informs the public on how the government regulates the construction output by increasing or decreasing expenditure on construction.
Keywords: Construction, economic development, government expenditure, inflation, interest rate
ABSTRAK
Daar is onvoldoende kennis oor die invloed van monetêre en fiskale beleidselemente op die konstruksiesektor se uitset in Tanzanië. Monetêre en fiskale beleidselemente is deurslaggewend in besluite wat verband hou met projek lewensvatbaarheid of haalbaarheid. Die doel van hierdie studie is om die verwantskap van monetêre en fiskale beleidselemente met die konstruksiesektor se uitset in Tanzanië te bepaal. Gevolglik gebruik hierdie studie 'n korrelasionele navorsingsontwerp om die bestaande verband tussen verskeie elemente van fiskale en monetêre beleid en konstruksie-uitset te ondersoek. Tydreeksdata is verkry van Tanzanië Nasionale Buro vir Statistiek en Bank van Tanzanië, wat 'n tydperk van drie-en-twintig (23) jaar van 1998 tot 2021 dek.
Die data is getoets vir stasionariteit, gevolg deur korrelasie- en regressie-analise. Resultate toon dat konstruksie-uitset negatief verband hou met kommersiële banke se geweegde rente- en inflasiekoerse. Aan die ander kant is konstruksie-uitset positief verwant aan wisselkoers, staatsbesteding aan konstruksie en totale belasting op produk. Meervoudige regressie-analise het soortgelyke resultate aan die lig gebring, met die uitsondering van wisselkoers wat negatief met konstruksie-uitset verband hou.
Nietemin is die verband tussen konstruksie-uitset en alle elemente van monetêre en fiskale beleid nie statisties betekenisvol nie. Die studie verskaf kennis oor die verband tussen monetêre en fiskale beleid oor die konstruksiesektor se uitset binne 'n voorheen onontginde Tanzaniese konteks. Dit kan ontwikkelaars help om ingeligte besluite oor beleggings te neem in tye van hoë of lae inflasie en rentekoerse, en tydens 'n oplewing van wisselkoerse. Dit lig ook die publiek in oor hoe die regering die konstruksie-uitset reguleer deur uitgawes aan konstruksie te verhoog of te verminder.
1. INTRODUCTION
The construction industry's contribution to economic development in developing countries can be realised through constructed facilities. Over the years, the construction industry in Tanzania has maintained a steady contribution to the national economic growth. According to United Republic of Tanzania (URT) (2022: 2), the industry's share to the gross domestic product (GDP) was 14.1% in 2020 and declined to 13.8% in 2021. Deloitte (2016: 5) predicted a growth in GDP of Tanzania at an average of 6.4% per year in 2016-2020, highlighting the significant contribution of the construction and service sectors towards achieving this feat. Similarly, in 2021, the URT (2022: 2) revealed the construction sector growth of 4.3%, which is a result of ongoing construction of classrooms, health centres, residential and commercial buildings, as well as construction and rehabilitation of roads, bridges, and airports. These projects take a long time before completion, during which changes in monetary and fiscal policies elements are likely. Such changes are, in turn, expected to affect the attainment of project objectives. Therefore, fiscal, and monetary policies elements cannot be neglected when making decisions on investments in construction projects, as these elements play a vital role in decisions pertaining to project viability or feasibility.
In Tanzania, as in many other countries, construction projects are mostly financed using borrowed funds that attract interest. The interest rates charged by financial institutions are not always stable to support the investment climate (Sospeter & Rwelamila, 2021: 328). For instance, between August 2015 and November 2015, the lending rates managed to remain stable at 16.1%, before rising to 16.28% in January 2016 (Deloitte, 2016: 6). Another important factor to note is that, in Tanzania, construction material prices are subjected to value added tax (VAT), which was introduced in 1997 and became operational in 1998. VAT was introduced to replace sales tax which was in operation since the 1970s.
The government is a key player in the construction sector globally, as the construction procurement-related expenditure contributes significantly to the growth of the industry. Studies reveal an apparent relationship between construction output and economic development in developing economies (Crosthwaite, 2000: 620; Ruddock & Lopes, 2006: 717; Giang & Pheng, 2011: 117; Fulford, 2019: 785; Ruddock & Ruddock, 2019: 771). Likewise, monetary and fiscal policies elements exert considerable influence on the construction output in any country (Asamoah et al., 2020: 7). Whereas monetary policy elements include interest, inflation, and exchange rates, fiscal policy elements consist of taxation and government expenditure. Other studies reveal the influence of either monetary policy elements, fiscal policy elements, or both on economic growth/development. A few studies focus on the construction sector output and these include Mbusi, Mbiti and Wanyona (2015: 18) in Kenya; Ayodeji (2011: 5) in Nigeria, as well as Bickerton and Gruneberg (2013: 271) in the United Kingdom. Collectively, the studies focused on one or more policy elements. For instance, fiscal policy elements (Ayodeji, 2011: 5; Osinowo, 2015: 197), monetary policy elements (Kalu et al., 2015: 173; Makoye, Mlinga & Ndanshau, 2022) and monetary and fiscal policies (Ma & Fang, 2011: 165; Emori, Ogar & Nkamare, 2014: 224; Mbusi et al., 2015:19). The results of these studies are contradictory in their respective countries. However, there is insufficient knowledge on the influence of monetary and fiscal policy elements on the construction sector output in Tanzania. Each year, the Bank of Tanzania (BoT) sets forth the monetary policy objectives to be achieved. These form the basis for the country's economic growth. These objectives are set to enhance the economic growth of the country, which calls for focused evaluation of every major sector of the economy. Construction is one of the major sectors that contribute significantly to the economic growth of the country. The sector contribution is through construction output that is greatly affected by both fiscal and monetary elements of total tax on products, government expenditure on construction, inflation, interest rates, and exchange rate. The monetary policy objectives set each year by the Central Bank influence not only the performance of the sector, but also the investments and infrastructure development in the country. Insufficient knowledge of monetary and fiscal policy elements may lead to poor performance of the industry and may affect decision-making on investments and infrastructure development. Studies undertaken in Tanzania by Kyissima, Kossele and Abeid (2017) as well as Makoye et al. (2022) have not explored the effect of monetary policy objectives on the construction sector. This continues to create a missing link on how the monetary and fiscal policies elements independently affect the construction output. By itself, Tanzania lacks adequate information on the outcome of monetary policy objectives set by the BoT, particularly on the construction sector. This study seeks to fill that research gap in the Tanzanian context.
2. LITERATURE REVIEW
2.1 Construction sector output
The construction output is the total constructed facilities delivered by the construction sector of any given economy within a given period (t), usually a year (Mbusi et al., 2015: 16). In that respect, countries invest in infrastructure which are products of the construction industry in the form of output. The production of new buildings and other structures in any given period adds to a country's economic wealth, in the form of the built environment contributing to, and complementing its productive and social capital (Ruddock & Ruddock, 2019: 773). However, Fulford (2019: 788) observed that not all assets contributed to national wealth creation, as such contributions were dependent on their nature and use. Ruddock and Ruddock (2019: 773) opined that, when economies grow by attracting investments and as such investments in terms of construction output expand, countries move to higher income classification groups. This view is shared by Musarat, Alaloul and Liew (2021: 409), as well as by Crosthwaite (2000: 620), in that the share of construction sector spending in GDP first grows during less developed country (LDC) status, peaks during newly industrialising country (NIC) status, as they will require more constructed facilities, hence construction output, and then declines as countries move from NIC to advanced industrialised country (AIC) status.
Ruddock and Lopes (2006: 718), Giang and Pheng (2011: 117), as well as Ansar et al. (2016: 362) presented varied views concerning the relationship between construction output and economic development. Ruddock and Lopes (2006: 720) described the relationship as 'Bon Curve', wherein the share of construction in total output first goes up and then comes down with the economic development of individual nations. Giang and Pheng (2011: 118) revealed the significant relationship between the construction industry and economic growth in developing countries, but they cautioned that excessive expansion of the industry would lead to waste of national resources. Ansar et al. (2016: 387) concluded that investments in infrastructure do not typically lead to economic growth and that investing in underperforming projects instead leads to economic and financial fragility. These views challenge the earlier perceptions that construction output contributes positively to the nations' economic growth. On the other hand, recent investments in infrastructure in Tanzania such as SGR, construction of TAZARA and Ubungo flyovers, Tanzanite bridge, and Stiegler's Gorge Hydroelectric Power Station project aim to stimulate the country's economic growth. This is held as true, as it is generally agreed that careful investment in infrastructure by developing countries will eventually translate to their economic development. This is also echoed by Ruddock and Ruddock (2019: 771), as well as by Sospeter and Rwelamila (2021: 326), in that a capital asset investment approach to sustainable infrastructure development requires careful planning of buildings and infrastructure for developing countries.
2.2 Monetary policy
Monetary policies involve the use of interest rates and other monetary tools to manage macroeconomic variables such as inflation, the level of consumer spending, consumer confidence, exchange rate index, economic growth, and unemployment in an economy (Musarat et al., 2021: 410; UKEssays, 2018b). A monetary policy is a framework whereby the government, the central bank, or other regulatory authorities manage the provision of cash, accessibility to cash, and cost of cash within an economy (Kalu et al., 2015: 175). The monetary policy is designed to influence the level of money supply and the structure of interest rates depending on the prevailing economic conditions (Emori et al., 2014: 225). The monetary policy consists of actions taken by a nation's central bank to control the money supply as well as interest rates, in order to achieve the desired macroeconomic policy objectives (Musarat et al., 2021: 410). It constitutes the major policy thrust of the government in realising various macroeconomic objectives (Emori et al., 2014: 225). Monetary policy objectives vary between countries at different times and under different economic conditions. According to Ruddock and Ruddock (2019: 773), monetary policies are predicated on the attainment of the following objectives: price stability, high employment, economic growth, as well as stability of financial markets and institutions. In Tanzania, the macroeconomic policy objectives for 2021/2022 were achieving real GDP growth of 5% in 2021, attaining inflation with a target of 3%-5% in 2021/2022, and a budget deficit including grants of 3% of GDP in 2021/2022 (BoT, 2022: 4). Furthermore, the monetary policy has the following targets (BoT, 2022a: 5):
• Annual growth of average reserve of money 9.9%;
• Annual growth of extended broad money supply (M3) of 10%;
• Annual growth of credit to the private sector credit of 10.6%, and
• Maintaining foreign exchange reserve adequate to cover at least four months of imports.
Central banks use several monetary tools to achieve monetary policy objectives. In an attempt to control money supply and interest rates, central banks usually use three major instruments, namely changing reserve requirements, changing discount rate, and open-market operations (Ruddock & Ruddock, 2019: 770). Ma and Fang (2011: 165) highlighted four main monetary policy tools applied by China Central Bank, namely open-market operations, cash reserve requirements, central bank loans, and interest rate. In the vast majority of developed countries, open-market operations are the main monetary policy tool of central banks' throughput of currency, and regulating market liquidity, which helps central banks and designated securities dealers for foreign exchange trading, so as to achieve monetary policy objectives. Likewise, the BoT (2022b: 2) uses open-market operations in the market for government securities, as well as sale and purchase of foreign currency in the Interbank Foreign Exchange Market (IFEM), which are complemented by periodic adjustments in the pricing of standby facilities. The seemingly effective implementation of the monetary policy by the BoT has led to improved performance of some monetary policy elements. For instance, the inflation rate has slowed down from 16% in 2012 to 3.5% in 2018 (URT, 2022: 3). The overall lending rate softened to 17.34% at the end of June 2018 from 17.6% at the end of June 2017, while one-year lending rate declined to 17.61% from 18.45% (BoT, 2019: 2). However, the mean exchange rate has increased from 1,409 in 2012 to 2,242 in 2018 Tanzania shillings per 1 US$ (URT, 2019: 2).
2.3 Fiscal policy
Fiscal policies involve the use of modifications in taxation and government spending to influence the level of planned expenditure in an economy and thus, the level of economic growth (Bickerton & Gruneberg, 2013: 270; Musarat et al., 2021: 410; UKEssays, 2018b). Fiscal policy can be described as the deliberate manipulation of government income and expenditure to achieve desired economic and social objectives (Ayodeji, 2011: 2). Smith (1991) as well as Sospeter, Rwelamila and Gimbi (2020: 772) explained that fiscal policy is the intentional use of the government's expenditure and taxation strategies to influence economic activities. According to Amadeo (2018: 27), there are two types of fiscal policies, namely expansionary, which aims to boost the financial system and generate more growth in the economy, and contractionary, which aims to slow down economic growth. Expansionary fiscal policy involves a net increase in government spending (G>T) through rises in government spending, a fall in taxation revenue, or a combination of the two (Ayodeji, 2011: 3). Contractionary fiscal policy occurs when net government spending is reduced either through higher taxation revenue (G<T), reduced government spending, or a combination of the two (Ayodeji, 2011). The elements of fiscal policy are taxation and government expenditure (Oladipo & Oni, 2021: 313; Mbusi et al., 2015: 19; Ayodeji, 2011: 3).
The main objectives of any country's fiscal policy is to minimise unemployment and inflation. In order to achieve these objectives, government regulates its own spending or uses its taxing powers. The goals of fiscal policy (Kysimma et al., 2017: 15) include price stability, full employment, reduction of poverty levels, high and sustainable economic growth, favourable balance of payment, and reduction in a nation's debt. In Tanzania, increased budgetary allocation for poverty alleviation is empowered by fiscal management. The policy has three main objectives, namely to regulate the growth of the budget deficit and achieve fiscal stability; to direct more fiscal resources to priority sectors in accordance with the country's Poverty Reduction and Growth Facility (PRGF) agreement, and to reduce the incidence of waste and abuse in the public sector (African Development Bank, 2003).
Tax remains the major source of governments' revenues for running their planned activities. In Tanzania, the total income from taxes was Tanzania Shillings 4,428 billion (US$ 3,143 million) in 2010, which has since increased to Tanzania Shillings 15,191 (US$ 6,776) in 2018 (URT, 2019: 3). Government expenditure in Tanzania includes recurrent, development, internal, and external expenditures. Statistics indicate that the total expenditure was Tanzania Shillings 8,174 billion (US$ 5,801 million) in 2010, which increased to Tanzania Shillings 20,468 (US$ 9,129 million) in 2018 (URT, 2019: 2).
2.4 Relationship between construction output and monetary and fiscal policy elements
The origin of monetary and fiscal policies can be traced to the classical Keynesian theory of macroeconomics in the 20th century. Later in 1990 (UKEssays, 2018a), economists developed the new Keynesian macroeconomics with new theories related to the classical one and is considered a macroeconomic theory which has created a foundation for microeconomics. The main objectives of macroeconomics (UKEssays, 2018c) are economic growth, inflation, unemployment, balance of payment, and exchange rate. The monetarists' opinion of the relationship between the construction industry and macroeconomics is that construction is treated as the core part of outcomes and employment resources for any country (UKEssays, 2018a). Monetary and fiscal policies are applied to achieve macroeconomic objectives. A change in these policies would have an impact on various sectors of the economy, including the construction industry and its output (Briscoe, 2009, cited in UKEssays, 2018b). Monetary and fiscal policies factors that affect construction output are commercial banks weighted interest rates, exchange rates, inflation, taxation, and government expenditure (Mbusi et al., 2015: 20). Inflation is a general and sustained rise in the aggregate level of prices measured by an index of the cost of various goods and services (Kalu et al., 2015). Mbusi et al. (2015: 20) define the exchange rate as the cost of a nation's currency when expressed in terms of another country's currency. In Tanzania, the exchange rate is pegged against the USD. Interest rate is the sum charged, usually expressed as a percentage of principal, by a lender to a borrower for the use of assets. In construction, the effects of exchange rates can be felt when the materials for construction are imported in large quantities (Bickerton & Gruneberg, 2013: 274). Inflation is experienced in the construction sector when there is an increase in construction material prices. The cost of materials in a typical construction project could be as high as 60% of the total project cost, which renders the construction industry sensitive to construction material prices inflation (Musarat et al., 2021: 409). Inflation has a negative impact on construction budgets and home mortgage loans which, in turn, affect construction output. High inflation leads to goods and services becoming more expensive, thereby affecting the demands from household and an ensuing decline in construction industry's outputs (UKEssays, 2018c).
The BoT is responsible for making decisions on interest rates. Interest rates in Tanzania are categorised into discount rates; deposit rates; lending rates and treasury bills rates. The BoT's official interest rate is the discount rate. Construction projects are associated with medium- to long-term lending rates. Hence, in this study, lending rates are used to determine their influence on construction output. Government expenditure on construction covers spending on infrastructure and other projects such as buildings which are hitherto classified as developmental expenditure. For the past nine years, the developmental expenditure in Tanzania has increased from Tanzania Shillings 2,611 billion (US$ 1,853 million) in 2010 to Tanzania Shillings 7,616 (US$ 3,397 million) in 2018 (URT, 2019: 2).
The effects of monetary policy elements on the construction output are apparent and are reflected in a number of studies. An increase in interest rate will raise the costs of credit loans, with consequences for the activities of the construction industry and the clients (UKEssays, 2018a). Osinowo (2015: 200) observed that the interest rate has a negative relationship and significant effect across all sectors, including building and construction. Bickerton and Gruneberg (2013: 273) studied the influence of wholesale interest rate, using London Interbank Offered Rate (LIBOR) on construction output. They found that there is no significant relationship between changes in LIBOR and the annual change in construction output, regardless of the number of years lagged. Emori et al. (2014: 229) established that exchange rate variables had a positive impact on the performance of Nigeria's economy, whilst inflation had a positive impact but with no significant relationship. Oghenekevwe, Olusola and Chukwudi (2014: 3) observed that cumulative inflation rate can be used to predict the price of building materials and further affects material prices non-uniformly in Nigeria. They revealed that the overall inflation rate exerts upward pressure and money supply exerts downward pressure on housing prices. Chukwudi et al. (2017: 95) revealed the very strong nature of the relationship between exchange rate and the price of tiles, cement, and reinforcement bars which, in turn, influences housing prices. Oladipo and Oni (2021: 313) established that inflation, exchange rate, import, interest rate, money supply, and demand for money have a significant effect on the prices of building materials. Likewise, a study in Tanzania (Makoye et al., 2022) determined that interest and inflation rates have a significant negative relationship with construction growth.
Fiscal policy elements, in particular government expenditure and taxation, affect construction output. The Keynesian economic theory (UKEssays, 2018a) recommends that increasing government spending or decreasing tax rates will be the most appropriate method to stimulate aggregate demands that could bring a greater increase in the national output. The rate of taxes determines how much disposable income consumers would be willing to spend on all services, including construction-related activities such as housing (UKEssays, 2018b; Sospeter, Rwelamila & Gimbi, 2022: 211). When governments increase demand by procuring infrastructure, the construction industry also benefits through execution of the projects and creation of employment (UKEssays, 2018c). Similarly, low taxation to individuals and firms may lead to an increase in demand and firms may expand more, in order to create employment and a healthy economy.
Ayodeji (2011: 5) determined that government spending and taxation significantly influence construction output when assessed both independently and combined. The combined effect of taxation and government spending on the construction sector output has been noted as very high and positive. Similarly, Osinowo (2015: 199) found that total fiscal expenditure had a positive coefficient and was significant across four economic sectors such as agriculture, building and construction, manufacturing, and mining. Kyssima et al. (2017: 13) assessed the impact of government expenditure on economic growth in Tanzania and found that there is no significant relationship between government expenditure and economic growth in the short run; they found a statistically significant and positive relationship with economic growth in the long run. However, Agu et al. (2015: 73) maintained that the effect of public expenditure on economic services such as agriculture, construction, transport, and communication have enormous returns to economic stability and growth. Onuorah and Akujuobi (2012: 48) found that there was no statistical significance between public expenditure variables and economic growth in Nigeria. Hansul (2015: 172) revealed that there was a negative correlation between government expenditure and economic growth in Malaysia for the past 45 years. Moreover, the classification of government expenditure indicates that only housing sector expenditure and development expenditure significantly contribute to a lower economic growth. Fulford (2019: 786) asserted that an increase in a country's income leads to an associated increase in the construction expenditure on products such as factories and infrastructure.
3. METHODOLOGY
A correlational research design was adopted in this study to establish the impact of fiscal and monetary policy elements on the construction output in Tanzania. Correlational research design is a non-experimental type of quantitative research that determines the degree to which a relationship exists between two or more variables (Creswell, 2008: 358; Leedy & Ormrod, 2010). Correlational research design allows for the use of correlation coefficients to express the degree of relationships, by measuring what is already present without actually changing the variables (elements) (Weathington, Cunningham & Pittenger, 2012: 268). Correlational research is also used in studies that collect time-series data and it allows for the use of multiple regression to analyse data.
In this study, secondary data for construction output (dependent variable) and monetary and fiscal policies elements (independent variables) were collected and correlated by multiple regression analysis to calculate the regression coefficient (r) that shows the impact of monetary and fiscal policies elements on construction output. The monetary policy elements were commercial banks weighted interest rates, inflation rate, and exchange rate. The fiscal policy elements were total tax on products and government expenditure on construction.
3.1 Data acquisition
This study relied on secondary data collected from Tanzania National Bureau of Statistics (NBS) and BoT, using two data sheets. The time-series data for monetary policy elements was collected from BoT and the data for fiscal policy elements was collected from NBS. The data collected for the study was for 23 years from 1998 to 2021. The small number of observations was inevitable, due to one of the variables (i.e., total tax on products was in the form of sales tax prior to 1998 and from 1998 Value Added Tax was introduced). Hence, it was improper to mix the two data, as this would lead to unreliable results.
3.2 Data analysis and interpretation of findings
Time-series analysis was used along with EViews tool to analyse the data (Agung, 2009: 15). The analysis of time series using EViews tool is common in studies that collect time-series data (see Kyssima et al., 2017: 16; Makoye et al., 2022: 9). Time-series analysis is a technique for trend forecasting, which is mostly based on an assumption that the continuation of yesterday's trend is the best estimate for tomorrow (Wisner, 2016: 572). EViews is a statistical package mainly used for time-series analysis (Wickramasinghe et al., 2023: 29). It is easy to use as it supports time-series data from common frequency (annual, semi-annual, quarterly, monthly, etc.) to high frequency (hours, minutes, and seconds). The raw data was entered into a computer using Microsoft Office Excel software and opened in EViews as foreign data which was eventually converted into an EViews work file. According to Gujarati and Porter (2009), any time-series data used for empirical work is assumed to be stationary. Hence, the time-series data was first checked for stationarity. Data that was found to be non-stationary was consequently transformed to stationary to avoid spurious or nonsensical regression.
The stationarity tests performed in this study were correlogram of first and second differences of natural log of variables and unit root tests for each variable (Shrestha & Bhatta, 2018: 80). The unit root test was conducted using the Augmented Dickey Fuller test (ADF) (Kumar, 2021). The ADF was used in previous studies on fiscal and monetary policies (Osinowo, 2015: 197; Kyssima et al., 2017: 16). After ensuring stationarities for all the time-series data, a test of Pearson correlation coefficient (r) was performed together with multiple regressions, where construction output was regressed on all the explanatory variables (Patten, 2017: 231, 252). Like correlation analysis, multiple regression analysis determines the existing relationship between variables in Eviews statistical program. This analysis was done to determine whether the relationship between the dependent variable (construction output) and the independent variables (monetary and fiscal policies elements) in Tanzania are statistically significant. The development of a model is not part of this study. It is, therefore, important to introduce the tests used in this study.
3.2.1 Autocorrelation test
Autocorrelation (AC) means data that is correlated with itself, and a correlogram of first and second differences of natural log of variables test displays the results of autocorrelation. AC measures the relationship between a variable's current value and its past values. Values closer to 0 in the "AC" and "PAC" columns indicate a greater degree of positive correlation between two values in a time series, assuming that the variable is stationary.
3.2.2 Augmented Dickey Fuller test
The Augmented Dickey Fuller (ADF) test is a statistical method used to determine whether a time-series data set is stationary or non-stationary. The ADF test checks for the presence of a trend in the data, by testing for the presence of a unit root. If a time series is stationary, its statistical properties such as the mean, variance, and AC remain constant over time. Conversely, when a time series is non-stationary, it has a trend or pattern that changes over time. The ADF test is conducted to confirm the result of a correlogram test on the assumption that (Kumar, 2021):
• Null hypothesis (Ho): variable is non-stationary or has a unit root.
• Alternate hypothesis (Ha): variable is stationary or has no unit root.
The ADF test produces a test statistic (t-statistic) and a p-value. A series is considered stationary if the t-statistic is less than the critical value and the p-value is less or equal to 0.05 at 95% confidence level. This indicates that the null hypothesis (Ho) (which states that the variable is non-stationary or has a unit root) is false and has been rejected.
3.2.3 Pearson correlation coefficient
According to Gujarati and Porter (2009: 20), correlation coefficients (r) measure whether there is a linear relationship between two variables. It has values between -1 and 1, where:
• -1 indicates a perfectly negative linear correlation between two variables.
• 0 indicates no linear correlation between two variables.
• 1 indicates a perfectly positive linear correlation between two variables.
In finance, an inverse correlation, also known as negative correlation, is a contrary relationship between two variables such that, when the value of one variable is high, the value of the other variable is probably low. A direct correlation, also known as a positive correlation, is a relationship in which both variables increase or decrease simultaneously (Mishra & Datta-Gupta, 2018: 69).
3.2.4 Multiple regression
The regression coefficient was calculated to show the nature and strength of relationships between variables. A positive regression coefficient indicates that, as the value of the independent variable increases, the value of the dep endent variable also tends to increase. Similarly, a negative regression coefficient implies that, as the independent variable increases, the dependent variable tends to decrease (Patten, 2017: 234).
The linear regression p-value for eachindependent variable tests the null hypothesis that the variable has no effect on the dependent variable. If there is no effect there is no association between the changes in the independent variable and the changes in the dependent variable. In regression analysis, if the p-value is greater than 0.05, at 95% confidence level, thee the null hypothesis that there is no association between the independent and dependent variable is accepted (Frost, 2023). For purposes of this study, the significance level is p<0.05.
3.2.5 Independent and dependent variables
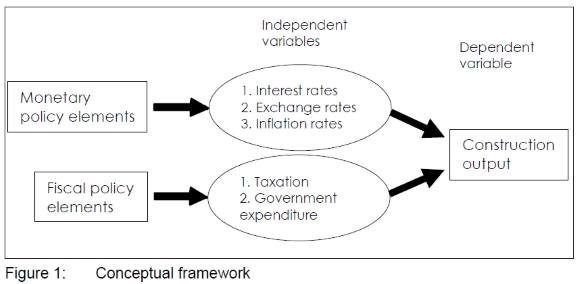
Figure 1 presents the conceptual framework of the study. The independent variables (monetary and fiscal policies) are expected to have an impact on thre dependent variable (the construction output).
4. RESULTS
4.1 Test for stationarity
Prior to the analysis of time-series data, the data set was tested for stationarity to avoid spurious regression. Gujarati (2003: 51) stated that, when analysing time-series data, the assumption that such data are stationary must be held true. For this assumption, the test for stationarity for the economic time-series data must be conducted prior to proceeding with other analyses. The values of construction output (CO), commercial bank's weighted interest rates (CBWR), inflation rate (IR), exchange rates (ER), government expenditure on construction (GEC), and total tax on products (TTP) were subjected to correlogram (Tables 1-6) and unit root test (Tables 7-9).
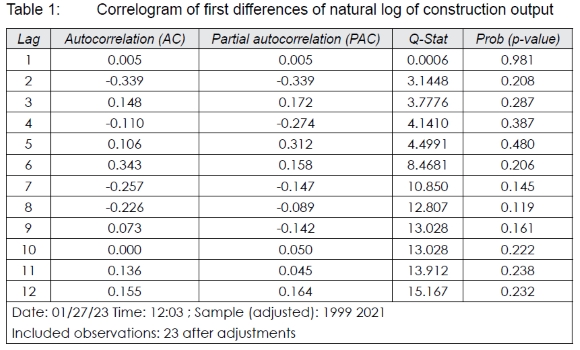
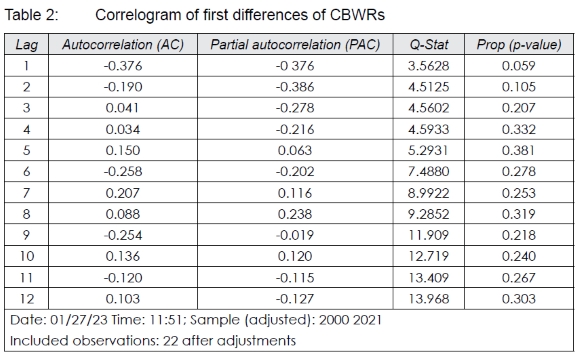
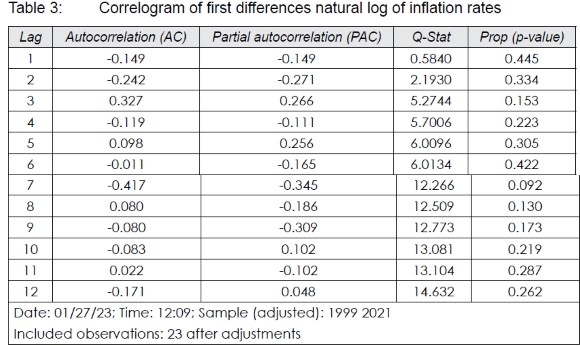
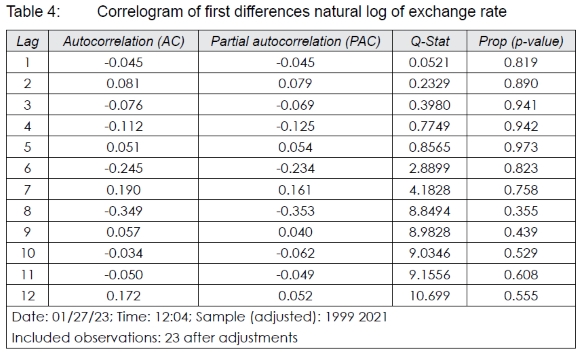
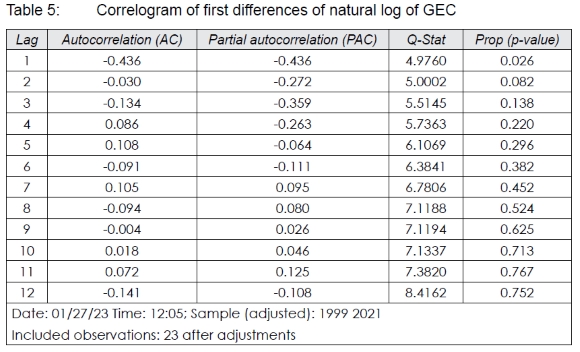
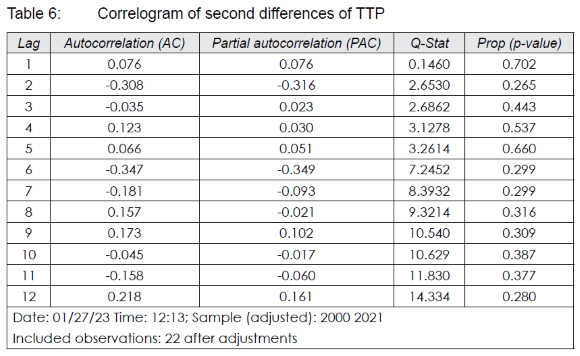

4.2 Correlogram of first and second differences of natural log of variables
Tables 1 to 6 present the computed values for 12 lags in the correlogram for first differences natural log of construction output CBWRs, inflation rate, exchange rates, GEC, and second differences of TTP. The table for the first differences natural log of TTP could not be displayed because the first differences of natural log of TTP were not stationary. Instead, Table 6 for second differences of natural log of TTP was displayed. Results indicate that all variables were stationary at their first differencing, except TTP. This is shown by the AC and partial autocorrelation (PAC) columns, where the values at different lags are closer to zero, showing a greater degree of correlation between two values. The result indicates that the construction output and explanatory variables time-series data are stationary because they correlate only to the extent of the values displayed in the AC and PAC columns, of which most of the values are near to zero.
In Tables 1 to 6, the p-values indicate that the correlation of time-series data of both construction output and explanatory variables is not statistically significant, with p-values greater than 0.05, at 95% confidence level. The QS-Stat values in Tables 1 to 6 indicate that time-series data of construction output and explanatory variables are random and independent. This result is also supported by the result of AC values that, if values are significantly different from zero, then the values are not random and independent over time. The ADF unit root test for stationarity confirms the results of the correlogram (as presented in Tables 7 to 9).
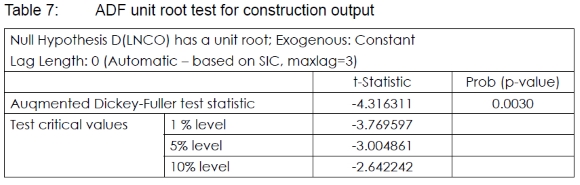
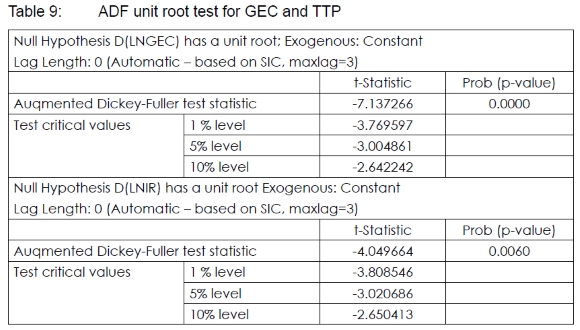
4.3 ADF unit root test of second differences of all variables
Tables 7 to 9 present the unit root test of second differences of all construction output (CO), commercial bank's weighted interest rates (CBWR), inflation rate (IR), exchange rates (ER) (monetary policy elements), and government expenditure on construction (GEC) and total tax on products (TTP) (fiscal policy elements). The test statistic values are usually compared to the critical values at 1%, 5%, and 10%. The results in Tables 7 to 9 indicate that the test statistic is more negative and less than the critical value. Thus, the null hypothesis is rejected, concluding that the time-series data for construction output and explanatory variables is stationary. Similarly, the p-values are smaller than 0.05 (range from 0.0000 to 0.0060) at second differences for construction output and explanatory variables. This confirms that the second differences of construction output and all explanatory variables are stationary and will have no predictable patterns in the long term.
4.4 Correlation results for stationary series of variables
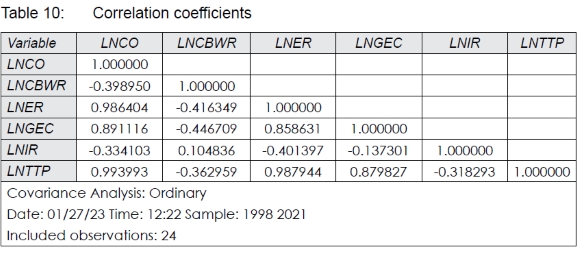
Table 10 presents the correlation matrix showing the correlation coefficients (r) of all variables. Results reveal both inverse and direct correlation among variables. The construction output is inversely correlated to commercial bank's weighted interest rate (r=-0.398950) and inflation rate (r=-0.334103), and directly correlated to the rest of the variables. The commercial bank's weighted interest rate is directly correlated to inflation rate (r=0.104836) and inversely correlated to the rest of the variables. The exchange rate is inversely correlated to inflation rate (r=-0.401397) and commercial weighted interest rate (r=-0.416349) and directly correlated to the rest of the variables. The inflation rate is directly correlated with commercial bank's weighted interest rate (r=0.104836) and inversely correlated to the rest of the variables. Government expenditure is inversely correlated to commercial bank's weighted interest rate (r=-0.446709) and inflation rate (r=-0.137301) and directly with the rest of the variables. The total tax on products is inversely correlated to commercial bank's weighted interest rate (r=-0.362959) and inflation rate (r=-0.318293) and directly correlated to the rest of the variables.
4.5 Multiple regression results of construction output on explanatory variables
Table 11 presents the results of the time-series multiple regression analysis. The regression coefficients and corresponding p-value for each variable obtained are as follows:
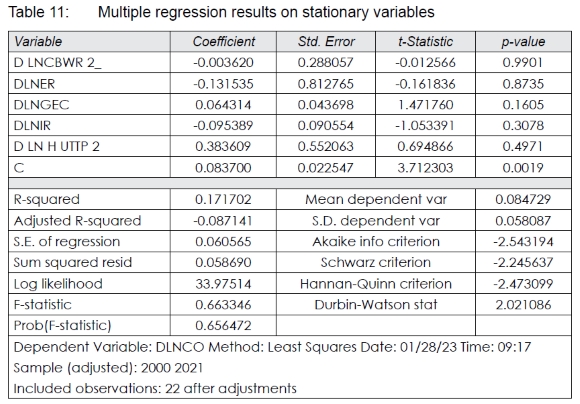
• (-0.004; p=0.9901) for the second difference of Commercial Bank's Weighted Interest Rate (CBWR)
• (-0.132; p=0.8735) for the first difference of exchange rates (ER)
• (-0.095; p=0.3078) for the first difference of Inflation Rate (IR)
• (0.064; p=0.1605) for the first difference of Government Expenditure on Construction (GEC)
• (0.384; p=0.4978) for the second difference of Total Tax on Products (TTP)
The coefficient of government expenditure on construction is positive and near zero, meaning that these explanatory variables affect construction output insignificantly. The nature of these coefficients can be due to the short span of the time-series data used in this study. On the other hand, total tax on products has a positive coefficient, while commercial bank's weighted interest rate, exchange rate, and inflation rate have negative coefficients. All p-values are above 0.05, showing that, although all variables have either a positive or a negative relationship with construction output, their relationship is not statistically significant.
5. DISCUSSION
Results of the correlation analysis reveal that monetary and fiscal policies elements affect the construction output in different ways. For instance, commercial weighted interest and inflation rates have a negative influence on the construction output, thereby implying that construction output decreases when the two elements increase. This result partly supports the results presented by Osinowo (2015: 199) that the impact of interest rate and the impact of inflation rate (Gupta, 2018: 28) are inversely related to construction sector outputs. This finding partly negates the findings of Bickerton and Gruneberg (2013: 274) as well as Emori et al. (2014: 229) that the impact of inflation rates is related to construction outputs. The inconsistency in these findings might have been influenced by the implementation strategies of the monetary and fiscal policies in the respective countries. Studies in Europe support the finding that changes in inflation rate will affect prices. This will result in deviating the initial budget of a project and, hence, affect construction output (Musarat et al., 2021: 411; Sospeter et al., 2020: 781). It appears that changes in monetary policy are capable of affecting domestic price levels and output growth. This implies that, when domestic price levels are high, construction outputs are low, and vice versa.
Based on the regression analysis, a unit increase in interest rate, exchange rate, and inflation rate will decrease the construction output by 0.004, 0.132, and 0.095 units, respectively. However, this relationship was not statistically significant. A previous study in Tanzania (Makoye et al., 2022) assessed related variables with construction growth and determined that a unit increase in interest rate and inflation rate will decrease construction growth by 0.354 and 0.106 units, respectively. In this study (Makoye et al., 2022), the negative relationship between construction growth and interest rate and inflation rate was statistically significant and is attributed to the study's long duration of 58 years. The effects of monetary policy elements are currently experienced in Tanzania with lower inflation and interest rates (URT, 2019: 3), leading to increasing construction output. Despite the promising annual increase of construction output in Tanzania, the effect of a rising exchange rate cannot be neglected. In this study, the exchange rate influences construction output, but its impact is not significant. On the other hand, the exchange rate has a negative relationship with the interest rate. The work of UKEssays (2018c) points out that a change in interest rate has an effect on the exchange rate index. A study by Xue, Yilmazkuday and Taylor (2020: 45) found that policy effects varied based on a firm's characteristics such as size, liability ratio, profitability, and the industry in which the firm operates. They advocated that financial and fiscal policies are generally effective in the short run. This finding suggests lower levels of interest and inflation rates, in order to maintain the growth of construction output.
The fiscal policy elements of total tax on products and government expenditure on construction have positive correlations with construction output, with coefficients of 0.994 and 0.891, respectively. This is expected in a developing country, where investment in infrastructure development is crucial, and governments are obliged to set aside sufficient funds every financial year for that purpose. Consequently, it can be predicted that construction output might increase along with the increase in budget for infrastructure development set aside by governments. As for total tax on product, excluding tax exceptions, the more materials are imported or procured in the country, the more tax is paid. This result supports the results from similar studies such as Kyissima et al. (2017: 19), Hansul (2015: 195), Agu et al. (2015: 10), Onuorah & Akujuobi (2012: 56), and Ayodeji (2011: 8), as it pertains to the relationship between general government expenditure and economic growth. The disparities and similarities in these findings might have been influenced by the duration of the evaluation in respective studies of respective countries. For instance, in this study, the duration was 23 years; Hansul (2015: 198), 45 years; Mbusi et al. (2015:18), 13 years; Osinowo (2015: 197), 43 years; Kyissima et al. (2017:17), 18 years, and Makoye et al. (2022), 58 years. Kyissima et al. (2017:19) also noted that, in the long run, government expenditure was found to be statistically significant and positively correlated to economic growth. Makoye et al. (2022) found a negative correlation between inflation rate, interest rate, and construction growth which were statistically significant. Likewise, NBS (2018: 5) as well as Sospeter and Rwelamila (2021: 326) related the recent increase in construction output with investments in infrastructure development projects such as Kigamboni Bridge, Bus Rapid Transport, and Standard Gauge Railway. The total tax on products influences construction output in a positive manner. This reflects parallel increase of the two variables reported in the URT (2019) and NBS (2018: 3). On the contrary, the works of UKEssays (2018a, 2018b) advocated cutting down taxes to increase disposable income that will translate to increase in employment rates and national output. This finding is in line with the work which elucidates that total tax shapes macroeconomics aggregates and, hence, affects construction output (Asamoah et al., 2020: 6; Sospeter et al., 2022: 218).
6. CONCLUSION AND IMPLICATIONS
The study sought to determine the impact of monetary and fiscal policies elements on the construction sector output, albeit in a developing country context such as Tanzania. Upon testing for stationarity, correlation analysis was computed to obtain the linear relationship of variables. On this aspect, the relationship between the construction output and other variables was such that all variables are positively correlated, with the exception of commercial bank's weighted interest rate and inflation rate which are negatively correlated. Following the regression analysis, which sought to test the significance of the construction output and explanatory variables, government expenditure on construction and total tax on products were positively related to construction output, while the rest were negatively correlated. Besides these results, the relationship between construction output with the explanatory variables was not statistically significant. This result was discriminated by the short duration of 23 years which is relatively short compared to previous studies by Osinowo (2015), Hansul (2015), and Makoye et al. (2022) of 43, 45 and 58 years, respectively. The use of short duration was dictated by the need to include fiscal policy, in particular the total tax on products. Despite this reflection, the findings can be useful to developers in making informed decisions on investments in times of high or low inflation and interest rates, and during an upsurge in exchange rates. It also informs the public on how the government regulates construction output by increasing or decreasing expenditure on construction. This study determined a relationship between construction output with all fiscal and monetary policies elements. The findings of this study are useful to potential developers and other stakeholders of the construction sector, including consultants, contractors, and the government, by providing information on the changes in investment climate brought by changes in fiscal and monetary policies elements. This baseline study stimulates future research to monitor the changes in the relationship of construction output and fiscal and monetary policies elements.
To improve the construction output in Tanzania, the study recommends the following:
• The government should strive to keep a steady increase of government expenditure on construction.
• When setting monetary policy objectives, the Central Bank of Tanzania should consider major sectors of the economy, including construction.
• Stakeholders of the construction sectors should devise various strategies to minimise effects brought by changes in monetary policy elements such as increasing production and use of locally available materials and technologies.
The limitation of this study is the use of a short period of evaluation of 23 years from 1998 to 2021 and the official statistics and reports that might not adequately cover the construction output of the informal construction sector.
ACKNOWLEDGEMENT
We would like to acknowledge the assistance of Mr Joshua Laizer, in obtaining additional data and analysis.
REFERENCES
African Development Bank. 2003. African Economic Outlook 2003. [Online]. Available at: https://dx.doi.org/10.1787/aeo-2003-en [Accessed: 21 March 2022]. [ Links ]
Agu, S.U., Okwo, I.M., Ugwunta, O.D. & Idike, A. 2015. Fiscal policy and economic growth in Nigeria: Emphasis on various components of public expenditure. SAGE Open, 5(4), pp. 267-285. https://doi.org/10.1177/2158244015610171 [ Links ]
Agung, N.G. 2009. Time series data analysis using EViews. Singapore: John Wiley & Sons. [ Links ]
Amadeo, K. 2018. What is fiscal policy? [Online]. Available at: <http://useconomy.about.com/od/glossary/g/Fiscal_Policy.htm> [Accessed: 21 March 2022]. [ Links ]
Ansar, A., Flyvbjerg, B., Budzier, A. & Lunn, D. 2016. Does infrastructure investment lead to economic growth or economic fragility? Evidence from China. Oxford Review of Economic Policy, 32(3), pp. 360-390. https://doi.org/10.1093/oxrep/grw022 [ Links ]
Asamoah, R., Baiden, K., Nani, G. & Kissi, E. 2020. Review of exogenous economic indicators influencing construction industry. Advances in Civil Engineering, vol. 2019, article 6073289, pp. 1-8. https://doi.org/10.1155/2019/6073289 [ Links ]
Ayodeji, O. 2011. Effect of fiscal policy on Nigerian construction sector. Journal of Surveying, Construction & Property, 2(1), pp. 1-10. https://doi.org/10.22452/jscp.vol2no1.1 [ Links ]
Bickerton, M. & Gruneberg, S. 2013. London interbank offered rate and UK construction industry output 1990-2008. Journal of Financial Management of Property and Construction, 18(3), pp. 268-281. https://doi/abs/10.1108/JFMPC-03-2012-0004 [ Links ]
BoT (Bank of Tanzania). 2019. Tanzania Construction Sector Report -Tanzanialnvest. [Online]. Available at: <https://www.tanzaniainvest.com/construction/tanzania-construction-sector-report> [Accessed: 9 January 2023]. [ Links ]
BoT (Bank of Tanzania). 2022a. Monetary Policy Statement, ISSN 0856-6976, Bank of Tanzania, Dar es Salaam. [Online]. Available at: <http://www.bot.go.tz> [Accessed: 14 February 2023]. [ Links ]
BoT (Bank of Tanzania). 2022b. Bank of Tanzania Annual Report 2021/2022. [Online]. Available at: <https://www.bot.go.tz/Publications/Regular/Annual%20Report/en/2022123017282850.pdf> [Accessed: 14 February 2023]. [ Links ]
Chukwudi, U., Chigozie, G., Chukwujekwu, A. & Hadiza, B. 2017. The correlation between foreign exchange rates and prices of building materials in Nigeria, 2011-2017. The International Journal of Business & Management, 5(10), pp. 94-100. [ Links ]
Creswell, J. 2008. Educational research: Planning, conducting, and evaluating quantitative and qualitative research. New Jersey: Pearson: Merrill Prentice Hall. [ Links ]
Crosthwaite, D. 2000. The global construction market: A cross-sectional analysis. Construction Management and Economics, 18(5), pp. 619-627. DOI: 10.1080/014461900407428 [ Links ]
Deloitte. 2016. Tanzania Economic Outlook 2016. The story behind the numbers. [Online]. Available at: <https://www2.deloitte.com/content/dam/Deloitte/tz/Documents/tax/Economic%20Outlook%202016%20TZ.pdf> [Accessed: 12 January 2023]. [ Links ]
Emori, E., Ogar, A. & Nkamare, S.E. 2014. Fiscal and monetary policy and its effect on the growth of Nigeria economy. European Journal of Business and Management, 6(24), pp. 220-232. [ Links ]
Frost, J. 2023. How to interpret p-values and coefficients in regression analysis. [Online]. Available at: <https://statisticsbyjim.com/regression/interpret-coefficients-p-values-regression/> [Accessed: 4 June 2023]. [ Links ]
Fulford, R.G. 2019. The implications of the construction industry to national wealth. Engineering, Construction and Architectural Management, 26(5), pp. 779-793. doi.org/10.1108/ECAM-03-2018-0091 [ Links ]
Giang, D. & Pheng, L. 2011. Role of construction in economic development: Review of key concepts in the past 40 years. Habitat International, 35(1), pp. 118-125. https://doi.org/10.1016/j.habitatint.2010.06.003 [ Links ]
Gujarati, D. 2003. Basic econometrics. 4th edition. New York: McGraw Hill Inc. [ Links ]
Gujarati, D. & Porter, C. 2009. Basic econometrics. New York: McGraw Hill Inc. [ Links ]
Gupta, R. 2018. The impact of government expenditure on economic growth in Nepal. [Online]. Available at: <https://ssrn.com/abstract=3099218> [Accessed: 3 December 2022]. [ Links ]
Hansul, A. 2015. The effects of government expenditure on economic growth: The case of Malaysia. Paper No. 71254. [Online]. Available at: <https://mpra.ub.uni-muenchen.de/71254/1/> [Accessed: 3 January 2023]. [ Links ]
Kalu, U., Gyang, Z., Aliagha, U., Alias, B. & Joachim, O. 2015. Monetary policy and its price stabilization effects on the prices of building materials. Mediterranean Journal of Social Sciences, 6(4), pp. 171-177. https://doi.org/10.5901/mjss.2015.v6n4p171 [ Links ]
Kumar, V.G. 2021. Statistical tests to check stationarity in time series. [Online]. Available at: <https://www.analyticsvidhya.com/blog/2021/06/statistical-tests-to-check-stationarity-in-time-series-part-1/#Augmented_ Dickey-Fuller_Test> [Accessed: 2 June 2023]. [ Links ]
Kyssima, H., Kossele, Y. & Abeid, R. 2017. Government expenditure and economic growth: Time series analysis. International Journal of Development and Economic Sustainability, 5(1), pp. 11-22. [ Links ]
Leedy, P.D. & Ormrod, J.E. 2010. Practical research: Planning and design. 9th edition. Boston, NY: Pearson Educational International. [ Links ]
Ma, J. & Fang, W. 2011. On China's current economic policy: Active fiscal policy and prudent monetary policy. Asian Social Science, 7(9), pp. 164-186. https://doi.org/10.5539/ass.v7n8p164 [ Links ]
Makoye, M., Mlinga R. & Ndanshau, M. 2022. Impact of macroeconomic factors on performance of construction industry in Tanzania. International Journal of Construction Management (Online publication). DOI: 10.1080/15623599.2022.2084259 [ Links ]
Mbusi, E., Mbiti, T. & Wanyona, G. 2015. Monetary and fiscal policy factors that affect construction output in Kenya. International Journal of Soft Computing and Engineering, 5(5), pp. 16-28. [ Links ]
Mishra, S. & Datta-Gupta, A. 2018. Regression modeling and analysis. In: S. Mishra & A. Datta-Gupta, Applied statistical modeling and data analytics. Amsterdam, The Netherlands: Elsevier, pp. 69-96. https://doi.org/10.1016/B978-0-12-803279-4.00004-3 [ Links ]
Musarat, M.A., Alaloul, M.S. & Liew, M.S. 2021. Impact of inflation rates on construction project budget: A review. Ain Shams Engineering Journal, 12, pp. 407-414. https://doi.org/10.1016/j.asej.2020.04.009 [ Links ]
NBS (Tanzania National Bureau of Statistics). 2018. Gross Domestic Product 2017. [Online]. Available at: <www.nbs.go.tz> [Accessed: 6 August 2019]. [ Links ]
Oghenekevwe, O., Olusola, O. & Chukwudi, U. 2014. An assessment of the impact of inflation on construction material prices in Nigeria. PM World Journal, 3(4), pp. 1-22. [ Links ]
Oladipo, F.O. & Oni, O.J. 2021. A review of selected macroeconomic factors impacting building material prices in developing countries - A case of Nigeria. Ethiopian Journal of Environmental Studies and Management, 5(2), pp. 131-143. https://doi.org/10.4314/ejesm.v5i2.3 [ Links ]
Onuorah, A.C. & Akujuobi, L.E. 2012. Empirical analysis of public expenditure and economic growth in Nigeria. Arabian Journal of Business and Management Review 1(11), pp. 46-59. https://doi.org/10.12816/0002209 [ Links ]
Osinowo, O.H. 2015. Effect of fiscal policy on sectoral output growth in Nigeria. Advances in Economics and Business, 3(6), pp. 195-203. DOI: 10.13189/aeb.2015.030601 [ Links ]
Patten, L. 2017. Understanding research methods. New York: Taylor & Francis. https://doi.org/10.4324/9781315213033 [ Links ]
Ruddock, L. & Lopes, J. 2006. The construction sector and economic development: The 'Bon curve'. Construction Management and Economics, 24(7), pp. 717-723. https://doi.org/10.1080/01446190500435218 [ Links ]
Ruddock, L. & Ruddock, S. 2019. Wealth measurement and the role of built asset investment: An empirical comparison. Engineering, Construction and Architectural Management, 26(5), pp. 766-778. https://doi.org/10.1108/ECAM-07-2018-0290 [ Links ]
Shrestha, M. & Bhatta, G. 2018. Selecting appropriate methodological framework for time series data analysis. The Journal of Finance and Data Science, 4(2), pp. 71-89. https://doi.org/10.1016/jjfds.2017.11.001 [ Links ]
Smith, A.W. 1991. Understanding economics. 2nd edition. New York: Macmillan/McGraw-Hill. [ Links ]
Sospeter, N.G. & Rwelamila, P.D. 2021. Construction industry development in Tanzania in improving the performance of construction industries for developing countries. In: Rwelamila, P.D (Ed.). Improving the performance of construction industries for developing countries. London: Routledge, pp. 334-348. https://doi.org/10.1201/9780429322471-13 [ Links ]
Sospeter, N.G., Rwelamila, P.D. & Gimbi, J. 2020. Project management challenges for post-disaster reconstruction projects in Angola: A public sector perspective. International Journal of Managing Projects in Business, 14(3), pp. 767-787. https://doi10.1108/IJMPB-03-2020-0087 [ Links ]
Sospeter, N.G., Rwelamila, P.D. & Gimbi, J. 2022. A conceptual framework for managing post-disaster reconstruction projects in emerging economies: The case of Angola. Built Environment Project and Asset Management 12(2), pp. 205-222. DOI 10.1108/BEPAM-03-2021-0040 [ Links ]
UKEssays. 2018a. Macroeconomics, microeconomics and the construction industry. [Online]. Available at: <https://www.ukessays.com/essays/economics/macroeconomics-microeconomics-and-the-construction-industry-economics-essay.php?vref=1> [Accessed: 15 January 2023]. [ Links ]
UKEssays. 2018b. Role of the construction industry in economic stability. Economics Essay. [Online]. Available at: <https://www.ukessays.com/essays/economics/role-of-the-construction-industry-in-economic-stability-economics-essay.php?vref=1> [Accessed: 15 January 2023]. [ Links ]
UKEssays. 2018c. Macroeconomic policy and construction industry in United Kingdom. Economics Essay. [Online]. Available at: <https://www.ukessays.com/essays/economics/macroeconomic-policy-and-construction-industry-in-united-kingdom-economics-essay.php?vref=1> [Accessed: 16 January 2023]. [ Links ]
URT (United Republic of Tanzania). 2019. Tanzania in figures 2018, National Bureau of Statistics, Dodoma. [Online]. Available at: <https://www.nbs.go.tz/index.php/en/tanzania-in-figures/422-tanzania-in-figures-2018> [Accessed: 6 August 2022]. [ Links ]
URT (United Republic of Tanzania). 2022. The Economic Survey 2021, Ministry of Finance, Dodoma. [Online]. Available at: <https://www.nbs.go.tz/> [Accessed: 5 February 2023]. [ Links ]
Weathington, B.L., Cunningham, C.L. & Pittenger, D.J. 2012. Understanding business research. Hoboken, New Jersey: Wiley. https://doi.org/10.1002/9781118342978 [ Links ]
Wickramasinghe, W., Athukorala, P., Senarathne, S. & Yapa, Y. 2023. Examine the reliability of econometrics software: An empirical comparison of time series modelling. Open Journal of Statistics, 13, pp. 25-45. https://doi.org/10.4236/ojs.2023.131003 [ Links ]
Wisner, J.D. 2016. Operations management: A supply chain process approach. Thousand Oaks, California: Sage. [ Links ]
Xue, W., Yilmazkuday, H. & Taylor, J. 2020. The impact of China's fiscal and monetary policy responses to the great recession: An analysis of firm-level Chinese data. Journal of International Money and Finance, volume 101, article 102113, pp. 1-20. https://doi.org/10.1016/j.jimonfin.2019.102113 [ Links ]
Received: April 2023
Peer reviewed and revised: May 2023
Published: June 2023
DECLARATION: The author(s) declared no potential conflicts of interest with respect to the research, authorship, and/or publication of this article.
* Corresponding author

