


Services on Demand
Article
 English (pdf)
 Article in xml format
 Article references
Indicators

Related links
-
 Cited by Google
 -
 Similars in Google
Share

 Permalink
Acta Structilia
On-line version ISSN 2415-0487
Print version ISSN 1023-0564
Acta structilia (Online) vol.29 n.2 Bloemfontein 2022
http://dx.doi.org/10.18820/24150487/as29i2.6
REVIEW ARTICLE
The 2019 carbon tax in south africa: effects on relative cost of building materials, welfare, emissions, and energy consumption for households
Emmanuel KabunduI; Sijekula MbangaII; Paul MakasaIII
IBuilding and Human Settlements, PO Box 77000, Nelson Mandela University, Gqeberha, South Africa. Phone: 0729017550, email: kabunduemmanuel@gmail.com, ORCID: https://orcid.org/0000-0001-6201-465X
IIBuilding and Human Settlements, PO Box 77000, Nelson Mandela University, Gqeberha, South Africa. Phone: 0729674093, email: sijekula.mbanga@mandela.ac.za, ORCID: https://orcid.org/0000-0001-9439-7552
IIIArchitecture, PO Box 77000, Nelson Mandela University, Gqeberha, South Africa. Phone: 0840948026, email: paul.makasa@mandela.ac.za, ORCID: https://orcid.org/0000-0003-3533-5276
ABSTRACT
The introduction of the carbon tax by South Africa was primarily aimed at reducing pollution, and possibly improving the welfare of South African households. One of the ways of reducing pollution in the construction industry is to discourage the use of building materials that are high carbon emitters or have high energy intensities. This article used the Input-Output (IO) method and sensitivity analysis to study the effects of carbon tax on welfare distribution of South African households, using the 2014-2015 Living Conditions Survey (LCS). The study also set out to determine the relative sensitivity of price changes of some building materials after application of the 2019 carbon tax. Results showed that non-ferrous, ferrous, and prefabricated-based building materials had higher relative price sensitivities to carbon tax compared to other materials that were predominantly based on glass, cement, and treated metals. Increases in carbon tax may not discourage usage of relatively higher emissions-intensity materials like cement compared to wood. Operational building costs were dominated by electricity costs, with the burden being highest for lower income households. Any revenue-recycling efforts of the 2019 carbon tax for welfare purposes were marginal However, the tax can be used to subsidize energy for lower income households.
Keywords: Building Material, Carbon Tax, Emission Intensities, Energy Intensities, Input-output Analysis, Welfare
ABSTRAK
Die instelling van die koolstofbelasting in Suid-Afrika was hoofsaaklik daarop gemik om besoedeling te verminder, en moontlik die welstand van Suid-Afrikaanse huishoudings te verbeter. Een van die manière om besoedeling in die konstruksiebedryf te verminder, is om die gebruik van boumateriaal wat hoe koolstofuitstralers is of hoe energie-intensiteite het, te ontmoedig. Hierdie artikel het die Inset-Uitset (IO) metode en sensitiwiteitsanalise gebruik om die uitwerking van koolstofbelasting op welsynsverspreiding van Suid-Afrikaanse huishoudings te bestudeer deur die 20142015 Lewensomstandighede Opname (LCS) te gebruik. Die studie het ook die relatiewe sensitiwiteit van prysveranderings van sommige boumateriaal na die toepassing van die 2019-koolstofbelasting bepaal. Resultate het gewys dat nie-ysterhoudende, ysterhoudende en vooratvervaardigde-gebaseerde boumateriaal hoer relatiewe pryssensitiwiteite vir koolstofbelasting gehad het in vergelyking met ander materiale wat hoofsaaklik op glas, sèment en behandelde metale gebaseer was. Verhogings in koolstofbelasting ontmoedig nie noodwendig die gebruik van materiale met 'n hoer emissie-intensiteit soos sement in vergelyking met hout nie. Bedryfsboukoste is oorheers deur elektrisiteitskoste, met die las wat die hoogste was vir laer-inkomste huishoudings. Enige pogings tot herwinning van inkomste van die 2019 koolstofbelasting vir welsynsdoeleindes was marginaal. Die belasting kan egter gebruik word om energie vir laer-inkomste huishoudings te subsidieer.
1. INTRODUCTION
Building construction contributes significantly to the economies of all countries. However, the building construction industry significantly contributes both to the global energy demands and the greenhouse gas (GHG) emissions. In 2019, the entire global building sector accounted for 35% of global energy demand and 38% of global Co2-related emissions. The residential building global energy demands accounted for 22% of global total, while the global emission demands decreased from 18% in 2018 to 17% in 2019 (GABC, 2019: 12; 2020: 4). According to the report by GABC (2020: 4), the Co2-related emissions from operation of buildings (residential and non-residential), in 2019, increased to the highest levels, accounting for 28% (or 10 GtC02) of global emissions. Any slight reductions in percentages of emissions, from 39% in 2018 to 38% in 2019, was due not to absolute reductions in emissions output in the building sector but to increases in emissions from transport and other industry relative to buildings (GABC, 2019: 4). Therefore, C02 emissions are on the increase.
South African residential building energy consumption sources consist mainly of coal, oil products, natural gas, renewables and waste, as well as electricity. In South Africa, electricity uses for residential buildings rose from 1930 ktoe in 1990 to 4250 ktoe in 2018. The use of renewables and waste reduced from 6330 ktoe in 1990 to 3197 ktoe in 2018, and natural gas use rose from 4.7 ktoe in 2017 to 4.9 ktoe in 2018. The use of oil products has been fluctuating since 1990 but has seen a steady decline from 1021 mtoe in 1999 to 587 mtoe in 2018. The use of coal has also been fluctuating since 1990 (the 1990 figure was 1488 mtoe), reaching a peak in 2017 at 5351 mtoe and reducing slightly to 5321 mtoe in 2018 (World Bank, 2021 ; BP, 2021 ). This historical data shows that there has not been a clear effort by the building industry to transition from heavy fuel polluting sources such as coal to cleaner sources of energy. However, the steady increase in electricity use in all sectors has been and is projected to be accompanied by a steady increase in the use of renewables (IEA, 2020; 2021).
In 2018, South Africa was the world's 13th largest emitter of GHGs and had the 12th highest emissions per capita in the same year. The rankings have not changed much since 2014 (Alton et al., 2014: 346). Figure 1 shows that the estimated million metric tonnes of C02to be emitted per quad of energy produced in South Africa from 2019 to 2025 was expected to increase and thereafter gradually reduce significantly beyond 2025. This later gradual reduction in intensity would probably be due to a transition to cleaner forms of energy in the vast majority of sectors after the introduction of the carbon tax. One of the sectors, the building industry, is expected to significantly contribute to the reduction of C02 emissions beyond 2025. The intensity of emissions per unit of energy is expected to drop by 10% between 2021 and 2040. Figure 2 shows the estimated emission intensity of the South African economy. The number of metric tonnes of the combined C02 equivalent GHGs that are emitted per million US$ generated for South Africa has gradually reduced (improved) since 2015. The reductions in intensity of emissions generated beyond 2020 are even better.
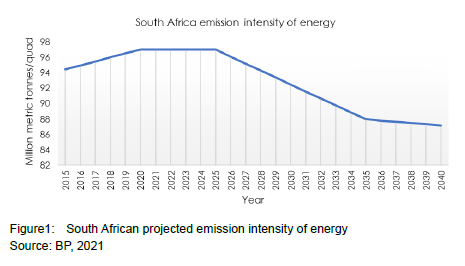
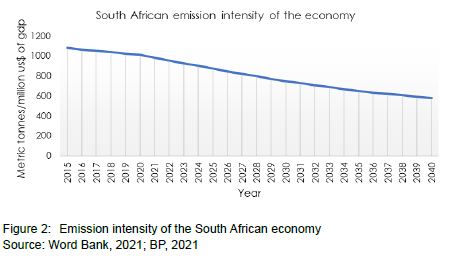
The intensity of emissions per unit of GDP generated is expected to reduce by 41% between 2021 and 2040. These projected improvements in the emission intensities are based on proper implementation of GHG emission-reduction strategies (such as the use of the carbon tax) in South Africa (Ecofys &The Green House, 2014; South Africa, 2019).
This article aims to apply a methodology of input-output (IO) analysis to study the carbon tax effect of relative price increases of building materials, to assess the embodied emissions present at various household income levels with respect to expenditures, and to study the effects of the carbon tax on the welfare of South African households. These embodied emissions can assist with informing the estimation of energy use and C02e footprint during building operational phases in life-cycle cost analysis. The objectives of the article include the generation of relevant IO tables from the most currently available supply and use tables (SUT) for South Africa, the use of satellite emissions environmental data to generate corresponding emission intensities for various sectors, the conducting of IO analysis based on developed taxation methodology (using the carbon taxes as exogenous shocks to evaluate the induced price changes), and the additional use of the living conditions survey data (LCS) from Statistics South Africa to evaluate both welfare effects of the carbon tax and its relative effects on cost of some building materials.
2. LITERATURE REVIEW
To understand the effects of 2019 carbon tax in South Africa, it is important to introduce the concepts used in this article. The concepts include the origin of carbon pricing systems, features of their design, some features of the South African carbon pricing system, and the effects of carbon pricing systems such as the carbon tax.
2.1 Origin of carbon pricing
The taxation of negative externalities has its origins in the work by Pigou (1932), who proposed the Pigouvian tax. Negative externalities occurwhen a third party is negatively affected or incurs damage, due to an economic activity of which s/he is not part (Hafstead, 2019: 3; BTCE, 1998). The proper amount of tax that should be levied on pollution emissions were vague. In 1960, Ronald Coarse proposed a theory that favours bargaining as a path to achieving a social optimum. Wherever there is a polluting firm in a neighbourhood, the most cost-effective approach would be for the firm to bargain with the community on levels of acceptable pollution and compensation for pollution emissions.
2.2 Carbon pricing systems
The major forms of carbon pricing include the cap-and-trade system (CAT), the carbon tax (CT) system, and the fuel excise levy (Hafstead, 2019; OECD, 2021). Under the CAT systems, any polluter must acquire certificates called pollution rights. Each pollution right is set to entitle its holder to emit a certain amount of C02 emissions equivalent, say, to one tonne annually. After determining how much total pollution it will permit each year, the government concerned will generate and distribute a fixed (capped) amount of pollution rights to the firms. The certificates are distributed by the government either for free or are sold, each at a fixed amount. A market process is then set in place for the buying and selling (trading) of pollution rights among firms, with heavy polluters buying certificates from non-heavy polluting firms at market prices (OECD, 2021).
Because of the need to implement carbon pricing, the South African Government introduced the South African Carbon Offset and Administrative System (SACOAS). South Africa introduced carbon pricing by means of the Carbon Tax Act of 2019,1 in order to reduce the negative externality of GHG emissions. Apart from being used for purposes of emission abatement, the carbon offsets in South Africa will also be uniquely used for carbon tax obligations. There is no issuance of free allowances, auctions, or allocation of any emissions-related allowances in SACOAS, unlike the conventional cap-and-trade (CAT) systems (DOE, 2016: 40). The South African carbon pricing system provides for the use of offsets to mitigate the tax liability of greenhouse emitters. However, it also has the potential to allow for the trading of offsets under a cap-and-trade system format to enable firms reach their annual carbon budgets (Prometherum Carbon, 2014: 4).
Both the CAT and CT systems (in presence of subsidies) stimulate innovation into cleaner technologies and reduce emissions, but the CAT system is more efficient in achieving both goals. Under the CT system, firms incur losses, while the CAT value will determine if firms incur profits or losses (Rogge & Hoffmann, 2010: 16-18). CAT systems are considered more efficient than CT systems. CAT systems go further to encourage afforestation and discourage deforestation through the carbon credits approach, unlike the CT system. A cost-effective and efficient carbon tax system must consider all emissions sources and should be equal to the social cost of carbon in magnitude. The social cost of carbon emissions is the long-term damage caused by an extra tonne of carbon dioxide equivalent emitted into the environment (Nordhaus, 2017: 1518). The social cost of carbon varies with the country and the discount rate used. The World Bank carbon pricing report suggests that, by 2020, the effective carbon prices should range from $40 to $80 per tC02e, and, by 2030, they should range from $50 to $100 tC02e (World Bank, 2019: 19). Since the carbon tax level2 for South Africa (R120 in 2019) is well below the social cost of carbon ($50 in 2019 or R750, according to USA standards), it is inefficient (Aldy & Stavins, 2012).
2.3 Designing carbon pricing systems
The effectiveness of a carbon pricing policy can be measured by the extent of its minimization of both the financial burden on everyday citizens and GHG emissions.
2.3.1 Factors affecting design
When designing a carbon pricing system, three factors determine its effectiveness. These include the policy stringency, coverage, and revenue use (Hafstead, 2019). Policy stringency considers how the carbon tax or pricing will change over time. If efficiency is to be maintained, the change should reflect the prevailing social cost of carbon emissions. Coverage deals with the sectors that will be covered by the carbon pricing system, the emission types that will be targeted, and the different levels of exemptions. Revenue use considers how the revenue from the carbon taxes will be used. Progressive carbon pricing policies will tend to minimize negative impacts on low-income households or even benefit these households by redistributing the revenues in areas of need.
2.3.2 Emissions, exemptions, and allowances in South Africa
The sources of GHG emissions in South Africa can be divided into Scope 1, Scope 2 and Scope 3 emissions (NT, 2013). Scope 1 emissions involve direct GHG emissions by a given firm (from sources both owned and controlled by the firm). Scope 2 emissions involve indirect emissions that arise, say, from generated electricity that is used by the firm in question for heating, cooling, or another activity such as steam generation. Scope 3 emissions arise due to the firm's activities that are not covered under Scope 1 or Scope 2. In South Africa, Scope 1 emissions are subject to the carbon tax (NT, 2013: 12-13). However, tax exemptions or allowances are also provided for the firms, with the base tax-free thresholds being 0%, 60%, 70%, 75%, or 100% of emissions from fossil fuel combustion (South Africa, 2019; South Africa, 2021). The allowances include industrial process emissions allowances (maximum of 10%); fugitive emissions allowances (maximum of 10%); trade exposure allowances (maximum of 10%); performance allowances (maximum of 5%); carbon budget allowances (maximum of 5%), and offset allowances (maximum of 10%). Allowances can be added to or subtracted from this figure, based on the emission intensity of the firm relative to the corresponding emission intensity benchmark. The emission intensity is evaluated based on both the Scope 1 and Scope 2 emissions. This provides an added motivation for firms to reduce their electricity consumption even at Scope 2 level so that they benefit from the allowances (Ecofys & The Green House, 2014: 6-8; NT, 2013: 14).
2.3.3 Phases for carbon tax roll-out
There are three phases under which the carbon tax will be rolled out. During Phase 1 of the carbon tax roll-out, all firms that generate Scope 1 emissions are subject to the carbon tax, except ESKOM. Carbon tax allowances, as stipulated in the 2019 Carbon Tax Act of South Africa, are fully applicable in Phase! The carbon tax will be increased annually by an amount equal to 2% points above annual consumer price inflation (South Africa, 2019). During Phase 1, this annual increase translates into a value of from R120 per tonne at the beginning (2019) to R300 per tonne at end of December 2025. During Phase 2, the annual increase is expected to range from R300 per tonne (January 2026) to R450 per tonne (December 2030). Most of the carbon tax allowances (except a few such as the trade exposure allowances) are not applicable in Phase 2. ESKOM will also cease to be exempted from the carbon tax during Phase 2. This means that the effects of the tax on electricity prices will affect most of the households and firms in South Africa. During Phase 3, the carbon tax will be expected to reach as high as R1800 post-2050 (Fin24, 2022; South Africa, 2019).
Since ESKOM provides over 90% of South African electricity, electricity prices will hardly be affected by the carbon tax during Phase 1. The revenue collected from the carbon tax will also be significantly low. Therefore, the ability for the South African Government to use the revenues as a design tool for both minimizing negative impacts and providing targeted benefits to entities such as low-income households, small businesses, rural households, and rural businesses, will be limited. Exempting ESKOM from paying the carbon tax during Phase 1 is also an indirect way of subsidizing the energy provided to all the households and businesses dependent on ESKOM.
However, during Phases 2 and 3, when ESKOM is not exempted, more revenue will be collected because all consumers will be affected by electricity price increases arising from the carbon taxation of ESKOM. There will be no carbon tax-related indirect subsidization of electricity for all consumers of ESKOM power. However, the government, having obtained more carbon tax revenue, will have more flexibility to provide targeted benefits to groups affected most by the negative externalities (rural households and businesses) and to groups that incur the heaviest energy cost burden, due to the carbon tax effects (low-income households and small businesses). During these stages, the ability to use revenue as a design tool will be greater.
2.4 The effects of carbon pricing
Collecting information to determine the optimum Pigouvian tax level is always a challenge for governments that favour the application of the non-Pigouvian taxes on GHG emissions. Although carbon pricing systems (including carbon taxes) reduce reliance on carbon, they do not eliminate the reliance on carbon (NT, 2013). This means that there is a likelihood of increase in the negative externalities for neighbourhoods already burdened by pollution. Furthermore, in the absence of relevant exemptions, the effect of the carbon tax making fossil fuels expensive may lead to a harsher burden on lower income households by increasing costs of energy, public transport, and other consumer goods on which they heavily rely. It is also difficult to measure how much carbon is produced under carbon pricing, and hence difficult to set the exact carbon price. Carbon pricing could also shift local manufacturing to other countries or regions without carbon pricing measures, leading to loss of local jobs (Oke, Aigbavboa & Dlamini, 2017: 2375-2376; Alton ef a/., 2014: 344). Since a tonne of carbon emitted has the same effect, irrespective of the origin of emission, relocation of firms would result in greater loss for the local economy because it will still be affected by carbon emissions from other countries or regions where those firms have relocated. This phenomenon called carbon leakage is usually dealt with by using the carbon border adjusted tax (taxes on imports and rebates on exports) (NT, 2013: 58-59). This tax considers the differences in carbon pricing policies across different countries to ensure continued competitiveness of domestic manufacturers or firms. The Carbon Tax Act of South Africa provides a maximum allowance of 10% for these differences (South Africa, 2019). Other studies in the past have revealed that CTs are inefficient in the long run and that tax subsidy schemes should be implemented, on order to improve allocation (Carlton & Loury, 1980).
Among the positive effects of carbon taxation is the added flexibility offered to firms to select from several carbon emissions minimization technologies, the ensuring of equal marginal costs of abatements that allows minimization of overall costs of emissions reduction, the encouragement of environmental conservation, and the generation of a new revenue stream by the governments (Hafstead, 2019). Alton et al. (2014: 344) highlight that, at a rate of US$30 per ton of GHG emissions, a phased tax can help achieve South Africa's carbon emission targets for 2025. The carbon tax implementation has the potential to abate the decline in national welfare in 2025 by 1.2%. It can also favourably lead to altering income distributions, if the revenues from the tax are appropriately recycled.
Regarding the nature of the redistribution of proceeds from the carbon taxes, research has explored the double dividend economic hypothesis. This hypothesis has led to emphasis being placed on a combination of both environmental tax reforms (ETR) and environmental fiscal reforms (EFR), as shown by Freire-Gonzalez and Mon (2018). In EFR, taxation is based on the environment rather than taxing capital, consumption, or labour. Subsidies that are associated with the negative externality of pollution are also discouraged under EFR (Freire-Gonzalez & Mon, 2018). Some economists suggest that both the revenue-raising taxes and the environmental taxes should be taken as complementary to each other and that raising environmental taxes above their optimum, while lowering capital taxes, may prove more beneficial to society. In their study, Freire-Gonzalez and Mon (2018: 2) found that an increase in environmental taxes and reduction in subsidies for 39 industries, while using the revenue to reduce labour, capital and consumption taxes, produces both economic and environmental benefits. The benefits after three years are in the form of higher GDP and reduction in all environmental pollutants. Other studies with similar results include Ciaschini et al. (2012), Fernandez, Perez and Ruiz (2011), as well as Jorgenson, Goettle and Wilcoxen (2013).
Khastar, Aslani and Nejati (2020), when studying the carbon tax effect on social welfare and emission reduction effect in Finland, found that, although the tax was effective in reducing emissions, it had a negative welfare on the Finns. The authors recommend revisiting the amount of tax levied. Acemoglu et al. (2016) found in their study that, when CTs are implemented together with research subsidies (for firms engaged in clean technology innovations), production and innovation in environmentally clean technologies will be encouraged. Otherwise, without subsidies, firms may prefer to continue using the environmentally dirtier, but advanced technologies. In their study, Malerba, Gaentzsch and Ward (2021) found that national carbon taxation without compensation would significantly increase poverty in Peru but would have no significant effect on income inequalities. However, when redistributions from the carbon taxation are made, the reduction in national poverty head count would be as high as 17%, depending on the amounts of redistributions and the cash transfer schemes used.
The above studies indicate that the carbon tax rate should be carefully selected. Proper re-distributions of the carbon tax proceeds could also be a powerful tool against poverty and income inequalities.
3. METHODS
3.1 Data sets and computations
The study utilized the 2015 Eora data set applicable to South Africa (Eora; 2021). The computations related to the model equations were done using the 'ioanalysis' and the 'leontief packages from the R Cran repository to perform both the input-output and associated analysis (Vargas, 2020 Wade, 2020). Any other computations related to matrix and data frame operations were still done using the base functionalities inbuilt into R. The most important equations used for input-output analysis were from already published sources such as UN (2018) and Perese (2010). The study utilized the 'GiniWegNeg' package from the R Cran repository to evaluate gini coefficients (Raffinetti & Aimar, 2016; Raffinetti, Siletti & Vernizzi 2017: 186-187). Before being accepted as part of the R Cran repository, the R packages have to undergo independent validation tests to ensure that they perform the tasks they were meant to perform
3.2 Input-Output analysis
The Input-Output analysis method (IO) was used as the principal method of analysis. Because of the presence of satellite energy and emissions data as an extension to the IO tables, the IO methodology was extended to energy and GHG emissions analysis to obtain metrics such as emission or energy intensities of industries (Hasegawa, Kagawa STsukui, 2015).
The IO tables were generated from the Supply-Use Tables (SUTs). Some of the existing international sources of SUTs include the Organization for Economic Co-operation and Development (OECD), the Eora Supply Global chain database (used for this study) (Eora, 2021), the world input output database (WIOD) site, Exiobase, and the International Food Policy Research Institute (Timmer et al., 2015). To implement the Input-Output model equations, the study utilized the 'Leontief and 'ioanalysis' packages from the R Cran repository (Vargas, 2020; Wade, 2020). The process of transforming these tables to IO tables is specified by Perese (2010) and United Nations (UN 2018). The analysis was restricted to study distributional effects of carbon tax in the short term, since IO tables are being used. This is in harmony with other studies that also used the IO methodology (Boyce & Riddle, 2019; Perese, 2010; Mathur & Morris, 2014). Like the assumptions from Mathur and Morris (2014), this study assumed that there was no household and industry behavioural response to the after-tax increases in prices, due to implementing the carbon tax. The study considered that consumers will not switch to cleaner sources of energy and, therefore, significantly reduce the effect of the carbon tax. The study did not consider the effects of the eventual transfer of the initial higher expenses incurred by the taxed firms to the households (Mathur & Morris, 2014: 5-6). Due to presence of satellite data, this implied that the direct C02 emissions from households never required re-computation. The indirect C02 equivalent emissions from the burning of fossil fuels during industrial product manufacturing also never required re-computation (Renner, 2017: 5-7).
To convert from SUTs to IO tables, a set of equations represented by equation 1 or equation 2 was employed. Assuming the following definition of terms (UN, 2018: 369-400):
np = Number of industries/agents
mp= Number of commodities
LetV= An mp X np supply (Make matrix)
Let U = An np X mp (Use matrix)
I = An np X np or mp x mp (Identity matrix)
W = Initial Gross value added (GVA) matrix
X = Column vector of product (commodity) output
G= Column vector of industry output
VT = Make matrix (Transpose of supply matrix) - Product by Industry (npxmp)
U = Use matrix of intermediaries - Product by industry (np x mp)
Y = Initial use matrix (Product by category)
F = Final use matrix after transformation
S = Final matrix of intermediaries after transformation
E = GVA matrix after transformation
D= Index for domestic origin
M= Index for imported origin
Equation 1 yields a non-negative commodity by commodity IO table, while equation 2 yields a non-negative industry by industry IO table (UN, 2018). The possible set of equations adopted for evaluation of the final IO matrix is as follows:
Sd is the commodity-by-commodity matrix of technical coefficients.
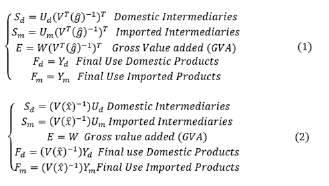
Let the chosen matrix of intermediaries be of dimensions p x p, where p is either n or m.
The total output (T0) across sectors is given as:
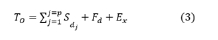
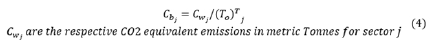
where Ex are total exports and j is the column index. The volumes or mass of carbon emissions per unit of total output (T0) or carbon intensities (Cb) is given in the following equation 4:
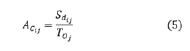
Energy use intensities can be similarly evaluated by computing energy consumption per unit of total output. The carbon equivalent emissions are computed based on environmental account data of the emissions of other GHGs and the application of the global warming potential (GWP) to each unique GHG emitted to convert it to the C02 equivalent (GGP, 2021 ). For each sector (or column j), the total sum of the transformed emissions (including the original C02 emissions) is computed. Each element in the ith row and jth column in the matrix of technical coefficients (A) can then be computed as follows:
The Leontief inverse (L) is then computed as:

The total emissions embodied in final demand (CF) are given by:
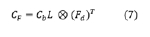
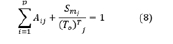
In this case, taxation will be based on intensity of emissions per unit of final demand for each sector. Equation 7 can be altered so that taxation is based on total exports or even total inputs. The symbol x represents matrix multiplication through multiplication corresponding elements of 2 matrices. The two matrices must have the same dimensions. Equation 8 holds true for the coefficients from the technical coefficient matrix elements:
A carbon tax shock was then introduced on the intermediary inputs and obtain the tax effects in form of relative price increases in final demand products (Tian et al., 2013: 280-281; Perese, 2010: 19). The purpose of the carbon tax is to discourage heavy polluters. Suppose a maximum carbon tax rate (t) is to be introduced in Rands per tonne, then the tax is evaluated using equation 9:
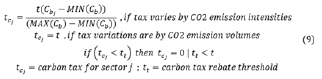
The matrix Cb in equation 9 is a 1 by p row matrix of C02 equivalent intensities. The model allows for offering of tax rebates to industries that have low intensity emissions or low energy intensity usage. The rebate threshold is tt for C02 emissions. The rebate thresholds must be carefully selected so that the domestic industries maintain competitiveness when exporting commodities abroad (NT, 2010: 39-40). The price effects due to taxation are expressed in equation 10:
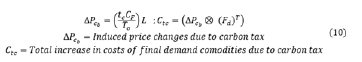
When these ratios of sector-specific price changes are evaluated, it is possible to compute the welfare losses (Renner, 2017).
Validation of results: The generated emission intensities (Cb) were compared against the emission benchmarks from the National Treasury as part of the validation process (Ecofys & The Green House, 2014: 115-119). The benchmarks from the National Treasury (in 2014) were expressed in tonnes of C02e per tonne of material. These were converted to tonnes C02e per Rand value of the material before comparing them to the emission intensities used in this study.
3.3 Conversion of price changes from base prices to purchaser's prices
Since the IO analysis was done in base prices and the LCS survey figures were in purchaser's prices, the base prices were then converted to producer's prices by adding taxes on products (excluding VAT) and subtracting subsidies on products. The producer prices were then converted to purchaser's prices by trade and transport margins and the non-deductible VAT (Perese, 2010: 29; UN, 2018: 53-56). The data for trade and transport margins was obtained from OECD database (OECD, 2021). The study assumed a general percentage of 10% of commodities consumed by households coming from imports rather than local commodities (Perese, 2010: 29).
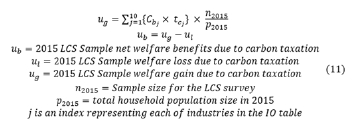
3.4 Estimation of the annual household welfare losses and gains
The effective change in price vector was extracted from equation 11 and applied to the household expenditure items present in the tables from STATSA (2017: 165-168). Household expenditures are more correctly aligned to permanent incomes, when compared to household income (Poterba, 1989: 1-2). The relevant items in the expenditure tables were mapped against the industry or commodity names from the 2015 Input-Output matrix. Once this mapping was done, the relevant tax rates (from the price change vector) that apply to each expenditure item from the Stats SA (2017: 165-168) tables were applied. These expenditure tables group households and their expenses into deciles. The first decile represents 10% of households that have the lowest annual expenditure, while the tenth (last) decile represents 10% of households with the highest annual expenditure. Each expenditure data under a decile represents the expenditure data for a household whose expenditure is the mean expenditure of the households in that decile. Application of the effective tax rates and summation under each decile yields the total welfare loss for the representative household under the decile. Multiplying this total welfare loss for each decile by the number of households in each decile yields the total welfare loss under each decile. Summing up these welfare losses yields the total welfare loss for all households in the representative survey. The total representative revenue for the sample data set is computed using equation 11.
The net benefit or loss, due to the application of the tax, was computed as the difference between the welfare benefit and the welfare loss.
Cross-sectional Living Conditions Survey (LCS) household data for the year 2015 from Statistics South Africa (Stats SA) was used to obtain individual information of sampled household expenditures (and incomes) on various household goods and services (Stats SA, 2015; Stats SA, 2017: 165-168). The total welfare loss under each decile can also be distributed among the households from the LCS which fall under the decile. The result is a table with the expenditure and filtered amount of taxes (due to IO analysis price changes) per household from the survey data set. The effective expenditures for households, which were registered as renters during the survey, were reduced by 30% on assumption that they spend about 30% on rental payments. A figure of 30% on housing income is what is adopted for financial institutions in South Africa to represent maximum housing expenditure. The household expenditure per annum was converted to annual household expenditure per person by dividing with the household sizes. The annual losses per household due to C02 emissions were also transformed to losses per person. The inequality measurements after income re-distributions were measured (to evaluate the potential of the carbon tax to reduce income inequality) using the technique proposed by Raffinetti ef al. (2017: 186-187) that dealt with negative values during analysis.
3.5 Tax exemptions
The carbon tax in South Africa is subject to tax exemptions in Phase 1, most of which would be eliminated for Phases 2 and 3. In its initial state (Phase 1), the first 60% of C02 equivalent emissions are exempt from the carbon tax for most of the activities. There are other additional allowances for trade exposure (maximum of 30%, to be increased to 50% in 2023) and process emissions (maximum of 10%) that would be applied to some industries (Ecofys & The Green House, 2014:6-7; SAIT, 2020; NT, 2013:13-14). An average carbon tax free rate of 70% was used for Phase 1.
3.6 Carbon taxation and welfare effects
To study the effects of carbon taxation on the welfare of South African households, scenario analysis on recycling of the carbon tax proceeds in the presence of varying percentages of beneficiaries, taxation exemption levels and carbon taxes was done. The assumption is that the proceeds would be distributed to all households in the population below a certain decile level. The adjusted expenditures were then computed. The gini coefficients for both original and new household expenditures were also computed. The mean income levels for both old and new household expenditure levels below the previously selected decile were also generated.
3.7 The preference index
An index to provide rough preference of welfare scenarios was created. The index is built based on the maximization of recycling of the tax receipts, minimization of the gini coefficient and maximization of average incomes, and the optimization of both carbon tax and tax exemption levels. The index values were scaled so that they range from 0% to 100%. A higher preference index indicates a better scenario with respect to meeting the optimization criteria above. A table with carbon tax levels, selected deciles used for recycling revenue, initial gini coefficient, final gini coefficient, mean adjusted income, net welfare-gain, and the preference index was then generated.
4. RESULTS
Since IO analysis was linked to households from the LCS, the IO tables were generated using equation 2, which is based on industry-by-industry IO tables.
4.1 Validation of emission intensities
Equation 4 was used to evaluate the emission intensities. These were compared against emission intensity benchmarks from the National Treasury. Based on the published results from the National Treasury, comparisons could only be made with respect to iron and steel, cement (clinker only), petroleum, and paper products (NT, 2019; Ecofys & The Green House, 2014). Both emission intensity benchmarks for 2014 and 2019 were used (see Table 1).
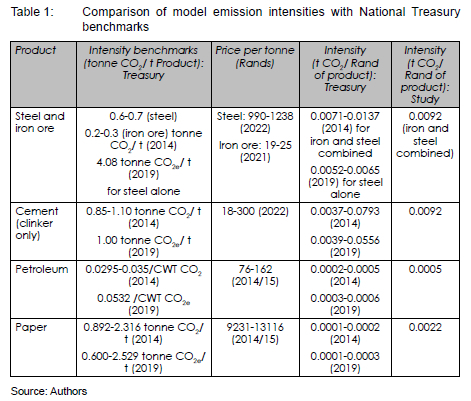
The model emission intensities for petroleum, cement (clinker only), as well as iron and steel closely compare with the intensity benchmarks from the National Treasury. However, using both 2014 and 2019 data, the model intensities for paper are much higher than the published emission benchmarks from the National Treasury. This could be because the model does not consider carbon sequestration or storage by materials. Timber and its products (including paper and wood products) sequestrate carbon. However, the tax laws in South Africa consider both carbon emissions and carbon sequestration (South Africa, 2019; South Africa, 2021). The cost of producing the products were estimated using the product prices (Tradekey, 2022; Indexmundi, 2022). Where necessary, the relevant consumer price indices from Stats SA (2022) were used to convert the product prices to 2014/2015 values. The 2014/2015 product prices were then applied to the treasury emission benchmarks, in order to convert the emissions benchmarks to tonnes per Rand.
4.2 Percentage price increases due to carbon taxation
The original conditions for the analysis considered the carbon tax to be equivalent to US$7.5 per tonne of C02 equivalent emissions, at an exchange rate of one Dollar for 16 Rands (120 Rands per tonne of C02). The price changes are due to both direct and indirect emissions, using the 95 commodities from the 2015 South African IO table. The effects of carbon sequestration are not considered in this article. This means that the results for items such as paper, wood, and furniture do not consider the sequestration properties of timber. Table 2 shows the price changes, due to the tax application.
Phase 1: Table 2 shows that highest price changes would occur in direct and indirect electricity use (at 1.983%), accounting for almost 35% of all price changes. However, in the short term, this change in price of electricity will only affect Scope 1 emissions from GHG emitting firms (private electricity generators), except for ESKOM, which is exempt from paying the carbon tax until December 2025 (NT, 2013). ESKOM generates over 90% of South African electricity. Eventually, these private generators (except ESKOM) will pass on these costs, incurred through payment of the carbon tax, to their customers through higher commodity prices (including electricity). Therefore, most of the South African households and other businesses (who depend on ESKOM for electricity) will not be affected by any price changes in Table 2, due to the carbon tax. The price changes for ESKOM customers will be 0% during Phase 1. However, customers of private electricity generators will be affected during Phase 1, due to the carbon tax according to data in Table 2.
Water use would experience a price change of 0.032%. Electricity use price changes for households are 62 times as much as the price changes, due to water usage, assuming equal amounts of water and electricity are consumed by the household according to their respective units of measurement. During Phase 1, households and businesses that do not rely on the electricity provided from the national grid (ESKOM) would experience a significant increase (accounting for 35% of overall price increases, assuming equal amounts per respective unit are consumed) in expenses on electricity, due to the carbon tax. Affordability for water usage in the presence of a carbon tax would be far more likely to occur (relative price increases for water are 62 times lower than those of electricity) compared to affordability for electricity by the households and businesses that are not customers of ESKOM.
Households and businesses that rely on non-liquid fuels for energy such as some form of coal would also experience high price changes, due to the carbon tax, as the coal industry was ranked the third highest (0.285%) after the electricity and non-ferrous industries. The assumption is that equal amounts of the respective units are being consumed by the household. The households that rely on liquid fuels are represented under the petroleum industry, whose price changes were ranked 14th in magnitude at 0.067%.
Phases 2 and 3: Since, during these phases, the exemptions are removed, and ESKOM is also required to pay carbon tax, the price increases are expected to be greater than those shown in Table 2, for all commodities. In addition, all the households (including those who depend on ESKOM for power) will spend more income on acquiring commodities.
4.3 Household expenditure change
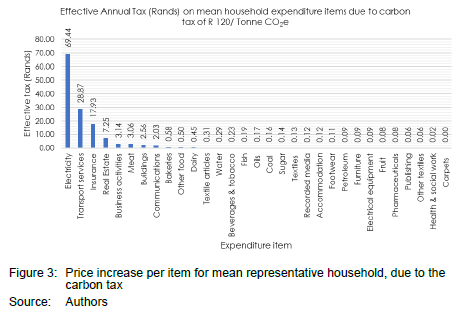
Phase 1: Households consume various expenditure items in different amounts. The price changes shown in Table 2 would need to be applied to household consumption patterns, in order to have a clearer picture of the change in expenditure patterns, due to the carbon tax. A mapping of the 2015 IO table sectors was done with the relevant household expenditure items from the 2014/2015 LCS survey. The mapping was done over 31 household expenditure items. Figure 3 illustrates the 31 expenditure items and the annual price changes, due to the carbon tax, on a household represented by the mean expenditure from the LCS survey. The increases in expenses were disproportionally higher for electricity (R69.4), transport (R28.9), insurance (R17.9), real estate (R7.3), and business activities (R3.1 ), when compared to other expenditure items. Electricity contributed to 50.2% of total increase in the expenses, while transport services contributed 20.9% of total increase in expenditures, due to the carbon tax. The five highest contributors to the increases in expenditure, due to the carbon tax, accounted for 91.5% of total increase in the expenditures. Because of differences in the amounts of water and electricity consumed by the households, the actual increase in expenses on electricity (R69.4), due to the carbon tax, was approximately 239 times compared to similar increases in expenses for water consumption (R0.29) and 434 times compared to similar increases in expenses for coal (solid fuels) consumption (R0.16). In the short term, this significant increase in electricity and other commodity prices would be felt by firms, other than ESKOM, which generate Scope 1 emissions. These firms would eventually pass the increased prices on to the consumers of their products. The number of households and firms affected will not be big (during Phase 1), since ESKOM generates over roughly 90% of the country's electricity and is exempt from the carbon tax during Phase 1. This means that the other Scope 1 emitting firms account for less than 10% of electricity generation.
Phases 2 and 3: From 2026 onwards, during Phases 2 and 3 of the carbon tax roll-out, the effect of the tax on consumers over the entire country will be significantly higher and wider in scope, since ESKOM will no longer be exempted from the carbon tax and most of the other tax allowances (except for a few such as trade exposure allowances) will also fall away.
4.4 Emissions per household
The emission and energy intensities from the IO analysis (obtained using equation 4) were transformed from intensities per Rand at base prices to intensities per Rand at purchase prices. They were then mapped with household expenditure items for each of the LCS sample representative decile. The purpose was to obtain patterns of both direct and indirect energy usage and C02e emissions. The total emissions, energy usage, emission intensities, and energy intensities for each decile were then derived. Table 3 shows each of these four values for the 10 deciles. The rate of South African household total C02e emissions and energy usage (direct and indirect) increases with household incomes. The increase, however, does not seem to follow a linear trend.
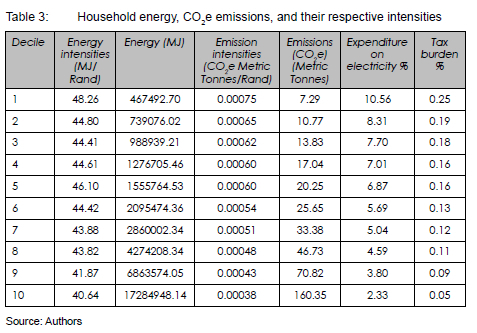
The C02e emission and energy intensities per Rand at purchaser's prices both decreased with increases in household incomes. The anomaly only lies with the 4th and 5th deciles of the energy intensities, where the energy intensity increases with income. However, the general pattern for energy intensities is for them to decrease with increases in household income. The total amount of emissions (direct and indirect) per Rand for lower income households is higher than that of higher income households. Similarly, the total amount of energy used (direct and indirect) per and for lower-income households is higher than that of higher income households, except for the 4th and 5th deciles.
Table 3 shows that electricity had the highest sensitivity to the carbon tax. Lower income households (lower deciles) proportionally spend three times more on electricity than the higher income households. Thus, in the absence of both exemptions to ESKOM, or any other energy subsidies, the carbon tax burden would be higher for lower income households compared to higher income households. Therefore, the implementation of the carbon tax at whatever level will most significantly hurt the lower income households compared to higher income households, if the tax exemptions on ESKOM are to fall away, and no environmentally friendly subsidies are provided. Table 3 also shows that lower income households emit more C02e emissions per Rand of expenditure. Therefore, the amount of tax per Rand of expenditure will be higher among lower income households. It would, therefore, be beneficial for these households to invest in cleaner energy-saving measures. Therefore, any subsidies provided for these households should be directed to cleaner energy-saving measures.
4.5 Carbon tax effects on building materials
Table 4 shows the sensitivity of short-term changes in prices of some building materials due to carbon taxation. The non-ferrous metals used in building construction had the highest percentage price changes (0.30%), followed by iron and steel, and plastic. Glass and ceramics were least affected by the price changes (below 0.01%). The relative price changes of cement were also relatively low (11th lowest among the building materials under consideration at 0.01%). The price changes for wood were 0.014%, 1.6 times those of cement. These relative price changes reflect the cost escalations on the building materials, due to the carbon tax. Building technologies that predominantly use materials with low percentage price changes would be more resilient in ensuring household affordability in the presence of an ever-increasing carbon tax.

The minimization of usage of ferrous, non-ferrous, plastic, and prefabricated metallic materials would reduce the percentage price changes in building costs due to application of a carbon tax, leading to better affordability. However, a lower price change of the building material, due to the carbon tax, does not imply a lower C02e emission intensity or lower energy-use intensity. Neither does a lower emission intensity of a building material imply a lower energy-use intensity of the same material (although there is a very strong correlation). In terms of emission intensities, cement would be ranked 3rd after iron and steel but would be ranked 6th in terms of energy intensity after treated metals. However, the greatest differences in rankings arise with respect to price changes. The similarities between emission intensities and energy intensities are higher than those between any one of these two forms of intensities and the price changes. These differences in the price changes could be due to the transformation process that was applied to convert price differences from base prices to purchaser's prices, by applying taxes on production (excluding VAT), subsidies on production, as well as the trade and transport margins.
4.6 Net welfare gain and tax analysis
The population of households in South Africa for 2015 was 15,307,000 households. The 2015 LCS survey sample had 23,380 households. The welfare gain for the survey sample (23,380 households) was evaluated, and a sensitivity analysis was done with respect to both carbon tax levels and tax exemption levels. Figure 4 shows that if the carbon tax is increased while the tax exemption threshold is lowered, the net welfare gains will increase.
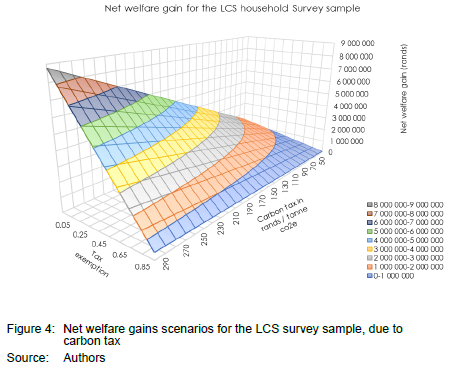
However, this may reduce the competitiveness of some local exporting industries when compared to other industries abroad (Oke et al., 2017: 2375-2376; NT, 2010: 39-40). Trade exposure allowances, with a maximum of 10% of emissions, were implemented to take care of this negative effect (South Africa, 2019). Furthermore, an increase in carbon tax would increase the energy cost burdens of the local households in South Africa, which account for approximately 51% of total likely increase in expenses.
Figure 4 can also be used to predict the likely effects of the carbon tax in the future.
Phase 1: During Phase 1 of its roll-out, the tax amount is low, and the exemption or allowance is high (60%-70% for most cases, and 100% for ESKOM), leading to lower revenue being collected.
Phases 2 and 3: During Phase 2, most of the allowances (including ESKOM exemptions) will be removed, while the carbon tax will be gradually raised (R300-450/tonne). This will lead to higher annual revenue. This revenue will still be higher as the tax level is raised during Phase 3 (beyond 2030). These increases come from the effect of the 2% addition to the annual inflation rate used in adjusting the carbon tax annually, and the cancellation of the allowances. Therefore, there is expected to be a significant net increase in revenue in Phases 2 and 3, despite the presence of inflation. This net revenue can be used as a key feature of the carbon tax design, to provide targeted environmentally friendly subsidies to special groups (small businesses, low-income households, rural households, and businesses).
4.6.1 Welfare redistribution effects of the carbon tax
The welfare redistribution effects of the carbon tax were also evaluated, using various levels of carbon taxes, tax exemptions, and percentages of households benefitting from recycling the revenue. Since lower income (or lower expenditure) households experienced a greater tax burden compared to higher income households, they were given first preference (as beneficiaries) when it came to welfare redistribution. The income distribution of the LCS data set was representative of the actual income distribution of all the households in South Africa. The results are presented in Table 5. Only two carbon tax levels (R134 and R1500) were used to illustrate the distributional effects of the carbon tax, using the gini coefficients. A lower gini coefficient indicates a lower income inequality. Even if the carbon tax is raised by more than ten times its current value, the income distributional effects are marginal or negligible. The carbon tax would have to be much higher than R1.500 per metric tonne of C02e for it to have any significant impact on the income redistribution. The recycling scenarios were done at 5%, 55% and 95%, while the tax-exemption scenarios were done at 20%, 40%, 60%, 80% and 100%. From the gini coefficient difference column, it is observable that, at a given tax level, a decrease in the level of tax exemption and a decrease in percentage of population that benefits from the carbon tax revenue, will both have positive, but marginal effects on increase in the income redistribution.
These results show that, phasing out the carbon tax allowances (beginning of Phase 2 in 2026) and gradually increasing the tax by 2% points above the prevailing inflation rates will hardly lower the income inequalities, after recycling the revenue among South African households. This is also applicable to Phase 3 (post-2030). However, revenues collected during Phases 2 or 3 will be significantly higher than revenue collected in Phase 1. The Phase 3 revenue will be highest, due to higher carbon tax rate and absence of allowances.
5. DISCUSSION
5.1 Validation and effect on electricity prices
The validation process revealed that the emission intensities fall within the limits of the National Treasury benchmarks, except for cases where the products sequestrate carbon. The model does not account for carbon sequestration by materials. This study showed that the carbon tax will have a disproportionately high effect on electricity price changes compared to other household expenditure items during Phases 2 and 3, when there are no exemptions for ESKOM. In addition, its effect will have a wider scope during Phases 2 and 3 (post-2026). The high effect on electricity price changes could, first, be attributed to the high emission intensities (direct and indirect) of the raw materials such as coal used to produce electricity, resulting in high emissions. The second possible reason is that the subsidies on products and the trade and transport margins that correspond to electricity do not significantly decrease its relative price change from base prices to purchaser's prices relative to other commodities (from 2.33% to 1.983%). These high electricity price increases will not affect most of the households in South Africa during Phase 1 because ESKOM, which supplies electricity to 95% of the households in South Africa, is exempt from paying the carbon tax in Phase 1.
5.2 Tax burden and efforts to lower income inequalities
The tax burden is heaviest for households falling in the lower income deciles. The tax is regressive, as indicated by Mathur and Morris (2014: 1). The effects of this tax burden will start being felt from 2026 and beyond (during Phases 2 and 3), when ESKOM will no longer be exempted from paying the carbon tax. ESKOM will then pass on the tax effects to the consumers. The study also revealed the effects of welfare redistribution to be very marginal. A carbon tax of R1.500 with hardly any exemption (exemption at 5%) would lower the gini coefficient only by 0.008. Therefore, while the carbon tax may significantly help reduce the socially negative externality of pollution, it hardly raises the expenditure levels (in the short term) of lower income households relative to the higher income households, even when it is as high as the social cost of carbon (World Bank, 2019: 19; Nordhaus, 2017).
5.3 Tax revenue and its use
The proceeds from the tax could be successfully used for environmentally friendly energy subsidies (say, on electricity) targeted at poor households, small businesses, rural households, and rural businesses. The subsidies are more than a sufficient cover for the price escalations in energy, due to the carbon tax implementation. The net welfare gain increases (in Phases 2 and 3) with an increase in the carbon-tax level and a decrease in the tax-exemption level. These findings do not contradict the findings of the national treasury (NT, 2010). The IO analysis deals with short-term effects, which have been found marginal in nature with respect to welfare redistribution, while the National Treasury results, using the computable general equilibrium model (CGE), apply to long-term effects (25 years). The national treasury results show that a carbon tax, in the presence of various revenue recycling options, has a limited negative impact on economic growth but assists in shifting the economy to a sustainable growth path with low carbon emissions (NT, 2013: 10). This article does not attempt to measure the carbon tax effect on economic growth.
The study results are in line with Alton et al. (2014: 52) who used several recycling scenarios and recommended that energy subsidies are a way in which the carbon-tax revenues may be successfully recycled. Environmentally friendly subsidies could be provided to low-income households and small businesses that wish to install energy-efficient retrofits in their premises or engage in any other energy-efficient, but productive ventures. Subsidies could also be extended to households and businesses in rural areas to compensate for the negative externality they incur, due to pollution.
However, the study recommends that fuel subsidies be removed before applying the benefits of subsidies from the carbon-tax revenue, because most of the beneficiaries of fuel (transportation) subsidies are the wealthiest households. Therefore, if fuel subsidies continue to be applied to the wealthy households, they will have hardly any or no incentive to switch to cleaner transportation fuels. This lack of incentive will not lead to a socially optimal fuel price and will counteract the goal of reducing carbon emissions (Aldy & Stavins, 2012: 161).
5.4 Effect of carbon tax on building materials
The main study findings are centred around the effect of the carbon tax on materials that may be used for building. It was assumed that the materials do not sequestrate carbon. For firms that do not depend on ESKOM for electricity and, therefore, generate Scope 1 emissions during Phase 1, the research revealed that the carbon tax they pay would have a significantly higher impact on the price changes for any materials they produce. The impact will be higher for non-ferrous metals, iron, steel, and prefabricated metals in that order, compared to other building materials. Higher price changes generally imply higher emission and energy use intensities for these building materials (according to Table 4). Sensitivities to the carbon tax are, therefore, not a perfect reflection of a building material's emission or energy use intensity (and, hence, likely carbon footprint). However, to minimize price escalations (for capital costs) in the presence of an ever-increasing carbon tax, wood would be a preferable material to prefabricated metal, while prefabricated metal would be a preferred material to iron and steel. Iron and steel, on the other hand, would be preferred to materials that use non-ferrous metals. Without consideration of carbon sequestration by wood, a material that predominantly uses cement (say, cement bricks) would be preferable to a material that predominantly uses wood (Table 4). However, an equal amount of cement would lead to a higher carbon and energy footprint compared to wood, under these conditions (without consideration for C02 sequestration). These patterns apply when the levels of tax exemption are similar (70% exemption level). However, in practice, policy indicates that a relatively higher exemption of 80% was applied to iron, steel, ceramics, cement, and glass, compared to 70% for other products (NT, 2013: 14). These higher exemptions (of 80%) would lower the price changes (due to the carbon tax) in iron, steel, ceramics, cement, and glass relative to other products such as wood.
Therefore, enacted policy would further distort the relationship between the carbon tax-induced price changes in materials and both the emission and energy intensities of the same materials during Phase 1. These distortions would, however, be minimized significantly during Phases 2 and 3, when the tax exemptions are removed. However, since these induced price changes mostly affect affordability for capital costs, life-cycle cost evaluations may be more representative of building material preference (on the basis of carbon and energy footprints) since they consider both the embodied and operational energy and emissions of materials (Guinee, 2016; Moncaster & Symmons, 2013).
5.5 Emission and energy intensities
Finally, the results showed that higher income bracket households have higher GHG emissions and vice versa, the relationship being non-linear. This trend resembles observations for studies done in Western countries (Buchs & Schnepf, 2013; Baiocchi, Minx & Hubacek, 2010; Gough ef ai., 2011). This trend implies that, as the carbon tax rates are increased annually and the allowances cease during Phases 2 and 3, there will be a tendency to tax higher income households more than lower income households. However, as discussed earlier, any redistribution of the revenue would hardly affect the income inequalities among South African households. The emission intensities, however, decline with higher household incomes and vice versa.
6. CONCLUSION
The carbon tax in South Africa is regressive. The tax welfare redistribution efforts towards improving inequality are marginal at best, even when exemptions and allowances cease, and the carbon tax is significantly increased to the social cost of carbon emissions during Phases 2 and 3 carbon tax roll-out. The tax can, however, be used as a source of environmentally friendly energy subsidies for lower income households, small businesses, and rural households. An IO analysis, if detailed, can provide a guideline of preferred building materials for use in residential construction, with respect to capital cost minimization. However, capital cost minimization is not a perfect criterion for minimizing direct and indirect emissions or energy use. The results for this study are limited to short-term analysis and do not consider carbon sequestration or absorption by materials such as paper, timber, and timber products. Although the magnitude of allowances varies by activity or commodity (as indicated in the 2019 Carbon Tax Act of South Africa), the model in this study used a representative level of exemption of 70%. This may have introduced some inaccuracies in the results. Methods that use bi-proportional scaling of input-output tables, consistent with row and column sums, can be used to estimate future IO tables and to perform the same kind of analysis on a longer term.
List of acronyms
IO Input-Output method
C02 Carbon emissions
C02e Carbon equivalent emissions
CWT Complexity weighted tonne
GDP Gross domestic product
ESKOM Electricity Supply Commission (of South Africa)
GHG Greenhouse gas
GtC02 Giga tons of carbon
CAT Cap and Trade system
MJ Megajoules
RAS Bi-proportional method of scaling of input-output tables consistent with row and column sums
VAT Value-added tax
ktoe Kilotonne of oil equivalent
mtoe Megatonnes of oil equivalent
REFERENCES
Acemoglu, D., Akcigit, U., Hanley, D. & Kerr, W. 2016. Transition to clean technology. Journal of Political Economy, 124(1), pp. 52-104. https://doi.org/10.1086/684511 [ Links ]
Aldy, J.E. & Stavins, R.N. 2012. The promise and problems of pricing carbon: Theory and experience. Journal of Environment & Development, 21(2), pp. 152-180. https://doi.org/10.1177/1070496512442508 [ Links ]
Alton, T., Arndt, C, Davies, R., Faaiqa, H., Konstatin, M., James, T. & Ubogu, D. 2014. Introducing carbon taxes in South Africa. Applied Energy, 116, pp. 344-354. https://doi.Org/10.1016/j.apenergy.2013.11.034 [ Links ]
Baiocchi, G., Minx, J. & Hubacek, K. 2010. The impact of social factors and consumer behavior on carbon dioxide emissions in the United Kingdom. Journal of Industrial Ecology, 14(1), pp. 50-72. https://doi.org/10.1111/j.1530-9290.2009.00216.x [ Links ]
Boyce, J.K. & Riddle, M. 2009. Cap and dividend: A state-by-state analysis. Research report. Political Economy Research Institute, University of Massachusetts, Amherst. Available at: <https://peri.umass.edu/publication/item/313-cap-and-dividend-a-state-by-state-analysis> [Accessed: 15 April 2021] [ Links ]
BP (British Petroleum). 2021. Downloads. Available at: <https://www.bp.com/en/global/corporate/energy-economics/statistical-review-of-world-energy/downloads.html> [Accessed: 15 May 2021] [ Links ]
BTCE (Australian Bureau of Transport and Communications Economics). 1998. Externalities in the transport sector: Key issues. Available at: <https://www.bitre.gov.au/sites/default/files/is_010.pdf> [Accessed: 20 December 2021]. [ Links ]
Buchs, M. & Schnepf, S.V. 2013. Who emits most? Associations between socio-economic factors and UK households' home energy, transport, indirect and total C02 emissions. Ecological Economics, 90, pp. 114-123. https://doi.Org/10.1016/j.ecolecon.2013.03.007 [ Links ]
Carlton, D.W & Lowry, GC. 1980. The limitations of Pigouvian taxes as a long-run remedy for externalities. The Quarterly Journal of Economics, 95(3), pp. 559-566. https://doi.org/10.2307/1885093 [ Links ]
Ciaschini, M., Pretaroli, R., Severini, F. & Socci, C. 2012. Regional double dividend from environmental tax reform: An application for the Italian economy. Research in Economics, 66(3), pp. 273-283. https://doi.org/10.1016/j.rie.2012.04.002 [ Links ]
DOE (South Africa, Department of Energy). 2016. South African carbon administrative and reporting system. Synthesis report, Version 3 prepared by Prometherum carbon. Available at: <https://carbon.energy.gov.za/Documents/Docs/Synthesis%20Report_Final.pdf> [Accessed: 4 April 2021]. [ Links ]
ECOFYS & The Green House. 2014. Emissions intensity benchmarks for the South African carbon tax. Technical support study. Available at: <http://www.treasury.gov.za/publications/other/GHG_Emissions_lntensity_Benchmarks_for_SA_Carbon_Tax.pdf> [Accessed: 15 May 2021]. [ Links ]
EORA. 2021. Eora National IO Tables. Available at: <https://worldmrio.com/countrywise/> [Accessed: 15 June 2021]. [ Links ]
Fernandez, E., Perez, R. & Ruiz, J. 2011. Optimal green tax reforms yielding double dividend. Energy Policy, 39(7), pp. 4253-4263. https://doi.org/10.1016/j.enpol.2011.04.041 [ Links ]
Fin24. 2022. Government slows carbon tax rollout that Eskom feared - but carbon taxes will be heftier from 2026. Available at: <https://www.news24.com/fin24/economy/govt-slows-carbon-tax-rollout-that-eskom-feared-but-carbon-taxes-will-be-heftier-from-2026-20220223> [Accessed: 20 June 2022]. [ Links ]
Freire-Gonzalez, J. & Ho, M.S. 2018 Environmental fiscal reform and the double dividend: Evidence from a dynamic general equilibrium model. Sustainability, 10(2), article number 501, pp. 1-18. https://doi.org/10.3390/SU10020501 [ Links ]
GABC (Global Alliance for Building and Construction). 2019. 2019 Global Status Report for Building and Construction. Available at: <https://globalabc.org/sites/defauIt/fiIes/inIine-fiIes/2019BuildingsGSR_FULLREPORT.pdf> [Accessed: 20 April 2021]. [ Links ]
GABC (Global Alliance for Building and Construction). 2020. 2020 Global Status Report for Building and Construction. Available at: <https://globalabc.org/sites/default/files/inline-files/2020%20Buildings%20GSR_FULL%20REPORT.pdf> [Accessed: 20 April 2021]. [ Links ]
GGP (Greenhouse Gas Protocol). 2021. Global warming potential values. Available at: <https://www.ghgprotocol.org/> [Accessed: 1 May 2021]. [ Links ]
Gough, I., Adbdallah, S., Johnson, V, Ryan-Collins, J. & Smith, C. 2011. The distribution of total greenhouse gas emissions by households in the UK, and some implications for social policy (LSE STICERD Research Paper No. CASE152). London: Centre for Analysis of Social Exclusion, London School of Economics, and New Economic's Foundation. Available at: <https://papers.ssrn.com/sol3/papers.cfm?abstract_id=1935761> [Accessed 18 May 2021]. [ Links ]
Guinee, J. 2016. Lifecycle sustainability assessment. What is it and what are its challenges? In: Clift, R. & Druckman, A. (Eds). Taking stock of industrial ecology. New York: Springer, pp. 45-68. https://doi.org/10.1007/978-3-319-20571-7_3 [ Links ]
Hafstead, M. 2019. Carbon Pricing 101: An introduction to carbon pricing, including carbon taxes and cap-and-trade programs, the benefits and design of pricing policies, and applications around the globe. Available at: <https://media.rff.org/documents/Carbon_Pricing_Explainer.pdf> [Accessed: 15 December 2021]. [ Links ]
Hasegawa, R., Kagawa, S. & Tsukui, M., 2015. Carbon footprint analysis through constructing a multi-region input-output table: A case study of Japan. Journal of Economic Structures, 4, article number 5, pp. 1-20. https://doi.Org/10.1186/S40008-015-0015-6. [ Links ]
IEA (International Energy Agency). 2020. World Energy Outlook, 2021. Available at: <https://iea.blob.core.windows.net/assets/a72d8abf-de08-4385-8711-b8a062d6124a/WEO2020.pdf> [Accessed: 12 May 2021]. [ Links ]
IEA (International Energy Agency). 2021. World Energy Outlook, 2021. Available at: <https://iea.blob.core.windows.net/assets/4ed140c1-c3f3-4fd9-acae-789a4e14a23c/WorldEnergyOutlook2021.pdf> [Accessed: 25 April 2022]. [ Links ]
Indexmundi. 2022. Commodity price indices. Available at: http://bit.ly/3gAo3qE [Accessed: 7 July 2022]. [ Links ]
Jorgenson, D.W, Goettle, R.J., Ho, M.S. & Wilcoxen, P.J. 2013. Double dividend: Environmental taxes and fiscal reform in the United States. London, UK: MIT Press, https://doi.org/10.7551/mitpress/9780262027090.001.0001 [ Links ]
Khastar, M., Aslani, A. & Nejati, M. 2020. How does carbon tax affect social welfare and emission reduction in Finland? Energy Reports, 6, pp.736-744. https://doi.Org/10.1016/j.egyr.2020.03.001 [ Links ]
Malerba, D., Gaentzsch, A. & Ward, H. 2021. Mitigating poverty: The patterns of multiple carbon tax and recycling regimes for Peru. Energy Policy 149, article number 111961, pp. 1-14. https://doi.Org/10.1016/j.enpol.2020.111961 [ Links ]
Mathur, A. & Morris, A. 2014. Distributional effects of a carbon tax in broader U.S. fiscal reform. Energy Policy 66, pp. 326-334. https://doi.Org/10.1016/j.enpol.2013.11.047 [ Links ]
Moncaster, A.M. & Symons, K.E. 2013. A method and tool for cradle to grave embodied carbon and energy impacts of UK buildings in compliance with TC350 standards. Energy and Buildings, 66, pp. 514-523. https://doi.org/10.1016/j.enbuild.2013.07.046 [ Links ]
Nordhaus, W.D. 2017. Revisiting the social cost of carbon. PNAS {Proceedings of the National Academy of Sciences), 114(7), pp.1518-1523. https://doi.Org/10.1073/pnas.1609244114 [ Links ]
NT (National Treasury). 2010. Reducing greenhouse gas emissions: The carbon tax option. Discussion Paper, December 2010. Pretoria: National Treasury. Available at: <http://www.treasury.gov.za/public%20comments/Discussion%20Paper%20Carbon%20Taxes%2081210.pdf> [Accessed: 12 May 2021]. [ Links ]
NT (National Treasury). 2013. Carbon Tax Policy Paper: Reducing greenhouse gas emissions and facilitating the transition to a green economy. Available at: <http://www.treasury.gov.za/public%20comments/Carbon%20Tax%20Policy%20Paper%202013.pdf> [Accessed: 12 May 2021]. [ Links ]
NT (National Treasury). 2019. Draft Regulations: Greenhouse gas emissions intensity benchmarks prescribed for the purpose of Section 11 of the Carbon Tax Act, 2019. Available at: <https://www.sars.gov.za/wp-content/uploads/Legal/Drafts/LAPD-LPrep-Draft-2019-81c-Draft-Benchmark-Regulations-Carbon-Tax-2-Dec-2019.pdf> [Accessed: 12 May 2021]. [ Links ]
OECD (Organization for Economic Co-operation and Development). 2021. SUT indicators: Trade and transport margins in percentage of total supply at purchasers' prices. Available at: <https://stats.oecd.org/index.aspx?queryid=84864> [Accessed: 15 May 2021]. [ Links ]
Oke, A.E., Aigbavboa, CO. & Dlamini, S.A. 2017. Carbon emission trading in South African construction industry. Energy Procedia, 142, pp. 23712376. https://doi.Org/10.1016/j.egypro.2017.12.169. [ Links ]
Perese, K. 2010. Input-output model analysis. Pricing carbon dioxide emissions. Working Paper Series. Congressional Budget Office, Washington, D.C. [ Links ]
Pigou, A.C. 1932. The economics of welfare. 4th edition. London: MacMillan. [ Links ]
Poterba, J. 1989. Lifetime incidence of the distributional burden of excise taxes. American Economic Review, 79(2), pp.325-330. https://doi.org/10.3386/W2833 [ Links ]
Prometherum Carbon. 2014. Carbon trading in South Africa. Trading offsets against the proposed carbon tax. Available at: <sagreenfund.org.za> [Accessed: 12 April 2021]. [ Links ]
Raffinetti, E. & Aimar, F. 2016. Package 'GiniWegNeg'. Available at: <https://cran.r-project.org/web/packages/GiniWegNeg/GiniWegNeg.pdf> [Accessed: 16 August 2021]. [ Links ]
Raffinetti, E., Siletti, E. & Vernizzi, A. 2017. Analyzing the effects of negative and non-negative values on income inequality. Evidence from the Survey of Household Income and Wealth of the Bank of Italy (2012), Social Indicators Research, 133, pp. 185-207. https://doi.org/10.1007/s11205-016-1354-x [ Links ]
Renner, S. 2017. Poverty and distributional effects of the carbon tax in Mexico. Courant Research Centre 'Poverty, Equity and Growth in Developing and Transition Countries', University of Gottingen. Discussion Paper No. 223. Available at: <https://www.econstor.eu/bitstream/10419/157268/1/884346315.pdf> [Accessed: 13 May 2021]. [ Links ]
Rogge, K.S. & Hoffmann, H.H. 2010. The impact of the EU ETS on the sectoral innovation system for power generation technologies - Findings for Germany. Energy Policy, 38(12), pp. 7639-7652. https://doi.Org/10.1016/j.enpol.2010.07.047 [ Links ]
SAIT (South African Institute of Taxation). 2020. The carbon tax explained. Available at: <https://www.thesait.org.za/news/498153/The-Carbon-Tax-Act-Explained.htm> [Accessed: 15 May 2021]. [ Links ]
South Africa. 2019. Carbon Tax Act 15 of 2019. Available at: <https://www.gov.za/sites/default/files/gcis_document/201905/4248323-5act15of2019carbontaxact.pdf> [Accessed: 10 April 2021]. [ Links ]
South Africa. 2021. Taxation Laws Amendment Act No. 20 of 2021. Available at: <https://www.sars.gov.za/wp-content/uploads/Legal/AmendActs/LPrim-AA-2021-02-Taxation-Laws-Amendment-Act-20-of-2021-GG-45787-19-Jan-2022.pdf> [Accessed: 10 April 2021]. [ Links ]
Stats SA. 2015. Living Conditions Survey. Available at: <http://www.stat.ssa.gov.za/?p=14074> [Accessed: 15 March 2021]. [ Links ]
Stats SA. 2017. Living conditions of households in South Africa. An analysis of household expenditure and income data using the LCS 2014/2015. Available at: <https://www.statssa.gov.za/publications/P0310/P03102014.pdf> [Accessed: 15 March 2021]. [ Links ]
Stats SA. 2022. Time series data - Excel and ASCII format. Available at: <https://www.statssa.gov.za/?page_id=1847> [Accessed: 6 June 2022]. [ Links ]
Tian, X., Chang, M., Tanikawa, H., Shi, F. & Imura, I. 2013. Structural decomposition analysis of the carbonization process in Beijing: A regional explanation of rapid increasing carbon dioxide emission in China. Energy Policy 53, pp. 279-286. https://doi.Org/10.1016/j.enpol.2012.10.054 [ Links ]
Timmer, M.P., Dietzenbacher, E., Los, B., Stehrer, R. & De Vries, G.J. 2015. An illustrated user guide to the world input-output database: The case of global automotive production. Review of International Economics, 23(3), pp. 575-605. https://doi.org/10.1111/roie.12178 [ Links ]
Tradekey. 2022. Cement clinker price exporters, suppliers and manufacturers in South Africa. Available at: <https://southafrica.tradekey.com/cement-clinker-price.htm> [Accessed: 7 August 2022]. [ Links ]
UN (United Nations). 2018. Handbook on supply and use tables and input-output tables with extensions and applications. Department of Economic and Social Affairs. Statistics Division. Available at: <https://unstats.un.org/unsd/nationalaccount/docs/SUT_IOT_HB_Final_Cover.pdf> [Accessed: 12 May 2021]. [ Links ]
Vargas, M. 2020. Package 'leontief. Available at: <https://cran.r-project.org/web/packages/leontief/leontief.pdf> [Accessed: 17 August 2021]. [ Links ]
Wade, J. 2020. Package 'ioanalysis'. Available at: <https://cran.r-project.org/web/packages/leontief/leontief.pdf> [Accessed: 17 August 2021]. [ Links ]
World Bank. 2019. Report of the high-level commission on carbon pricing and competitiveness. Available at: <https://openknowledge.worldbank.org/bitstream/handle/10986/32419/141917.pdf?sequence=4&isAllowed=y> [Accessed: 12 December 2021]. [ Links ]
World Bank. 2021. GDP (Constant 2010 US$). Available at: <https://data.worldbank.org/indicator/NY.GDP.MKTP.KD> [Accessed: 15 May 2021]. [ Links ]
Received: October 2021
Reviewed and revised: March - August 2022
Published: December 2022
DECLARATION: The author(s) declared no potential conflicts of interest with respect to the research, authorship, and/or publication of this article
1 The South African Carbon Tax Act (no 15 of 2019) was published in 2019. However, there were amendments that were made to it using the South African Taxation Laws Amendment Act No. 20 of 2021. These documents can be accessed using their respective references under the references section.
2 The research used a carbon tax value of R120 per tonne of C02, which corresponded to the 2019 carbon tax rate. However, the carbon tax in 2022 was R144 per tonne of C02.
3 Though the carbon tax in 2019 was R120 per tonne of C02, its value in 2022 is R144 per tonne of C02.

