


Serviços Personalizados
Artigo
 Inglês (pdf)
 Artigo em XML
 Referências do artigo
Indicadores

Links relacionados
-
 Citado por Google
 -
 Similares em Google
Compartilhar

 Permalink
Acta Structilia
versão On-line ISSN 2415-0487
versão impressa ISSN 1023-0564
Acta structilia (Online) vol.28 no.2 Bloemfontein 2021
http://dx.doi.org/10.18820/24150487/as28i2.1
RESEARCH ARTICLE
Building performance evaluation of public housing in Harare, Zimbabwe
Ignatius Morgen ChomboI; Sang Hoon YoumII
IDepartment of Architecture and Architectural Engineering, Yonsei University, Yonsei-ro, Sinchon-dong, Seodaemun-gu, Seoul, South Korea. Phone: +82-2-2123-2780, email: <ignatiusmorgen@gmail.com>
IIDepartment of Architecture and Architectural Engineering, Yonsei University, Yonsei-ro, Sinchon-dong, Seodaemun-gu, Seoul, South Korea. Phone: +82-2-21232793, email: <syoum@yonsei.ac.kr>, ORCID: https://orcid.org/0000-0001-9607-903X
ABSTRACT
This study sought to evaluate the performance of residential building spaces in public housing in Harare, Zimbabwe. It specifically measured building performance indicators determined by the building's characteristics and the physical, locational and service attributes of buildings. A quantitative research design was adopted, in which questionnaires and observations were used in data collection. A two-stage sampling technique was used, because the population could be subdivided into clusters. From residents in three clusters, which include Highfield-Venice Flats, Avenues Flats and Mbare Flats, 263 respondents were conveniently chosen. Results from the independent t-test that was conducted showed that, at 95% confidence level, there exist significant differences in residential satisfaction among residents of Highfield-Venice Flats and those of Avenues Flats (t = 2.159, p-value= 0.035>0.05). Overall, residents are dissatisfied with the attributes of the buildings in which they live and the general residential situation. There is a general dissatisfaction with the buildings, suggesting that the building performance is not meeting their needs and expectations. Housing attribute preferences, privacy, dwelling proximity, and neighbourhood attachment showed a significant and positive impact on general residential satisfaction. Hence, there is a need to improve housing attribute preferences such as improving the quality of air and lighting as well as noise levels, since respondents expressed dissatisfaction with these attributes. Housing ceilings can be installed to reduce noise levels. More so, the quality of air and lighting can be improved by inserting more air ventilations and wider windowpanes. Privacy should be improved by ensuring that the residential structures have boundary walls that may be needed by the residents. More so, dwelling proximity ought to be improved. The Ministry of National Housing and Social Amenities and other public housing institutions can consider developing structures such as shopping centres, public schools as well as roads and social amenities such as parks, pools and workout facilities before they build residential houses.
Keywords: Building performance, public housing, residential building, Harare
ABSTRAK
Hierdie studie poog om die prestasie van residensiéle bouruimtes in openbare behuising in Harare, Zimbabwe, te evalueer. Die studie het spesifiek die bouprestasie-aanwysers gemeet wat bepaal word deur die gebou se eienskappe en die fisiese, ligging- en dienskenmerke van geboue. 'n Kwantitatiewe navorsingsontwerp is aangeneem waarin vraelyste en waarnemings in data-insameling gebruik is. Monsters is in twee stadiums geneem omdat die populasie in groepe onderverdeel kon word. Uit inwoners in drie groepe wat Highfield-Venice woonstelle, Avenues woonstelle en Mbare woonstelle insluit, is 263 respondente gerieflik gekies. Resultate van die onafhanklike t-toets wat uitgevoer is, het getoon dat daar op 95% vertrouensvlak beduidende verskille bestaan in die tevredenheid tussen inwoners van Highfield-Venice woonstelle en dié van Avenues woonstelle (t = 2.159, p-waarde = 0.035> 0.05). In die algemeen is inwoners ontevrede oor die eienskappe van die geboue waarin hulle woon en die algemene woongebied. Daar is 'n algemene ontevredenheid oor die geboue wat daarop dui dat die bouprestasie nie aan hul behoeftes en verwagtinge voldoen nie. Voorkeure ten opsigte van behuising, privaatheid, nabyheid van die woning en woonbuurte het 'n beduidende en positiewe impak op die algemene tevredenheid van die woonplek. Daarom is dit nodig om voorkeure vir behuisingskenmerke te verbeter, soos die verbetering van die kwaliteit van lug en beligting sowel as die geraasvlakke, aangesien respondente ontevrede was met hierdie eienskappe. Huisplafonne kan ge'ínstalleer word om geraasvlakke te verminder. Die kwaliteit van lug en beligting kan verbeter word deur meer lugventilasies en groter vensters in te voeg. Privaatheid moet verbeter word deur te verseker dat die woonstrukture grensmure het wat deur die inwoners nodig mag wees. Die nabyheid van die woonstel moet verbeter word. Die Ministerie van Nasionale Behuising en Sosiale Geriewe en ander openbare behuisingsinstellings kan die ontwikkeling van strukture soos winkelsentrums, openbare skole sowel as paaie en sosiale geriewe soos parke, swembaddens en oefensentrums oorweeg voordat hulle woonhuise bou.
Sleutelwoorde: Bouprestasie, openbare behuising, residensiéle gebou, Harare
1. INTRODUCTION
Ibem, Opoko, Adeboye and Amole (2013: 178) stipulated that the crucial aim of buildings is to provide occupants with conducive, safe, comfortable, healthy, and secured indoor environments to carry out different kinds of activities ranging from work, study, leisure, and family life to social interactions. In order to achieve this, buildings are designed, planned, constructed, and managed based on standards and specifications established by governments, professionals and experts who are supposed to have adequate knowledge of users' needs and expectations. Studies have, however, shown that sometimes standards and specifications do not conform to the changing needs and expectations of users (Ibem et al., 2013: 179; Preiser & Hardy, 2014: 181; Gopikrishnan & Topkar, 2017: 295; Gopikrishnan & Paul, 2018: 638) and thus, users are not always satisfied with the performance of their buildings. The consequences of this are manifested in building-related illness and 'sick building syndrome' (Ibem et al., 2013: 181) that increase the desire for re-modelling or modifications or abandonment of completed buildings (Mallory-Hill, Preiser & Watson, 2012: 328), which may cause waste of energy and sometimes even damage to the building envelope components and the surrounding environment (Mitterer, Künzel, Herkel & Holm, 2012: 231).
Many reasons may be adduced as to why buildings perform poorly in meeting users' needs and expectations. As Kelly, Crawford-Brown and Pollitt (2012: 6861) rightly observed, whereas designers in other fields of human endeavour expend considerable resources in examining the actual functioning and user satisfaction with everyday services and products and refining their design accordingly, professionals in the building industry appear not to have done well in this area. The main reason is the lack of adequate knowledge of users' changing needs and preferences by architects and other professionals who design, construct and maintain buildings. This is obviously due to inadequate research on this subject. In light of the above, Fatoye and Odusami (2009: 929) suggested that one of the ways to improve the overall performance of buildings is to explore and understand users' needs, expectations, and aspirations through regular performance evaluation. Therefore, building performance evaluation (BPE) is used to constantly examine the extent to which buildings are effective and efficient in meeting the needs and expectations of users (Preiser & Hardy, 2014: 185; Gopikrishnan & Topkar, 2017: 296).
Among other functions, BPE relates clients' goals and performance criteria set by experts to the measurable effects of buildings on the users and surrounding environment (Gopikrishnan & Paul, 2018). It also helps understand how occupants feel about their buildings, and thus provides basic information on users' needs, preferences, and satisfaction (Ibem et al., 2013: 178). Put succinctly, BPE primarily seeks to improve the quality of design, construction, and management of buildings and, by extension, promotes sustainable built environment. Therefore, the need for BPE to be part of the research agenda of architects and other professionals in the building industry cannot be over emphasized (Fatoye & Odusami, 2009: 929).
Existing studies (Ilesanmi, 2010; Ibem et al., 2013; Clement & Kayode, 2012) focus on the general performance of public housing in meeting occupants' needs and expectations. From these studies, it is established that the physical characteristics of residential buildings have a significant influence on occupants' satisfaction with their residential environment. This implies that the dwelling unit component of housing plays a vital role in determining the quality of residential environment, in particular, and the performance of housing projects, in general (Gopikrishnan & Topkar, 2017: 296). Hence, using the Relative Performance Index, the study sought to examine the residents' satisfaction to building performance of residential building spaces in public housing in Harare.
2. LITERATURE REVIEW
2.1 Residential satisfaction
Residential satisfaction is a multidimensional concept formed and defined over several decades and includes several theories and frameworks. Residential satisfaction of habitable buildings in terms of the quality of residential environments includes a subjective evaluation of the performance of products or services in meeting the needs and expectations of users or customers during or after occupation (Clement & Kayode, 2012: 105; Fatoye & Odusami, 2009: 929). It compares the benefits or values users or customers derive to what was expected when a product or service is consumed (Clement & Kayode, 2012: 106). According to the expectancy-disconfirmation theory, on which most of the studies on satisfaction draw, this means that, if the performance of a product or service meets users' or customers' needs and expectations, the user or customer is said to be satisfied with the product and/or service, and vice versa (Mustafa, 2017: 415).
Researchers have found that the most utilised methods of quantification are conducted by way of questionnaires and this is done by using two approaches. One way is to measure residential satisfaction with one or more general questions about satisfaction with a specified degree of residential environment (Smrke, Blenkus & Socan, 2018: 69). Another way is assessment, by asking respondents on degrees of satisfaction with specific components of the residential environment which often tend to result in an index of residential satisfaction (Smrke et al., 2018: 67).
Residential satisfaction can be divided into dwelling unit, neighbourhood, and community satisfaction (Ibem et al., 2013: 178). Buys and Miller (2012: 336) pointed out that most of the research on residential satisfaction focused only on the neighbourhoods, whereas less was known about the satisfaction level of dwellings (Aigbavboa & Thwala, 2016: 85). This research will focus on neighbourhoods and dwellings' satisfaction attributes and levels.
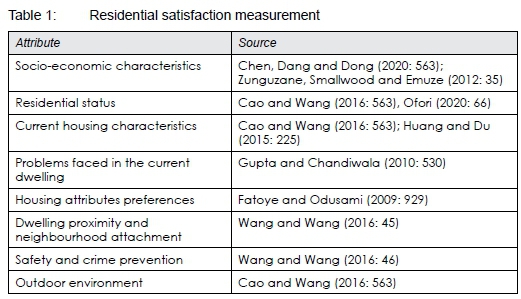
Smrke et al. (2018: 67) showed that household economics, which form socio-economic characteristics, is an important determinant of residential satisfaction. They also found that residential environment, neighbourhood characteristics including dwelling proximity and neighbourhood attachment, as well as safety and crime prevention predict residential satisfaction. Ibem and Amole (2013a: 563) and Buys and Miller (2012: 319) found that housing characteristics such as spatial (functional) comfort, indoor air quality, visual comfort, thermal comfort, acoustic comfort, and building integrity (structural and material performance) influence residential satisfaction. Gupta and Chandiwala (2010: 536) established that residential satisfaction is based on experiences and interactions with residential buildings. If the people have had a bad experience with a certain type of dwelling, they are likely to show low satisfaction. Fatoye and Odusami (2009: 929) indicated that, at the inception of building occupation, residents build various expectations on the performance of their buildings, which shows that they have various preferences of housing attributes. Cao and Wang (2016: 26) noted that residents consider the effect of environmental issues on their building as a significant factor of residential satisfaction.
For purposes of this study, residential satisfaction is determined by eight attributes as shown in Table 1.
2.2 Building performance evaluation
A building is a product and contains an investment that is required to bring favourable returns not only for the investor but also for the user (Gopikrishnan & Topkar, 2017: 295). When dealing with the community and users, it is a requirement that the building must meet the needs and expectations of the users, by supporting their daily activities and needs and improving their welfare through the quality of the built environment (Ibem et al., 2013: 178). Building performance evaluation assesses the architectural, functional, technical and economic value of buildings, by identifying the major weaknesses and strengths of buildings from the user's perspective (Gopikrishnan & Topkar, 2017: 178; Ibem et al., 2013: 178), with the potential to improve the quality of buildings after their construction through the provision of feedbacks on causes and effects of the environment and issues that relate to the building (Amini, Mahdavinejad & Bemanian, 2019: 184). Gupta and Chandiwala (2010: 530) stated that evaluation and performance of residential buildings are based on either observation or user satisfaction surveys, as it allows users to give their feedback, feelings, views, and opinions about a building based on their experiences and interactions.
Jiboye (2012: 236) noted that building performance indicators (BPIs) are an ideal way of identifying a condition that can be measured if one is to evaluate specific qualities and performances. Kian, Feriadi, Sulistio and Seng (2001: 10) and Kim, Yang, Yeo and Kim (2005: 1103) suggested the use of six BPIs, namely spatial (functional) comfort, indoor air quality, visual comfort, thermal comfort, acoustic comfort, and building integrity (structural and material performance). Carratt, Kokogiannakis and Daly (2020: 121408) emphasised the concept of BPE being based on the building users' experience, with BPIs being based on the parameters related to the spatial (functional) comfort, indoor air quality, visual comfort, thermal comfort, acoustic comfort, and building integrity (structural and material performance) of the satisfaction, behaviour, physiological and psychological comfort of the occupants.
BPE can be intentionally used for assisting in the formation and implementation of government policies, and the development of new strategies and typologies in building theories, whilst able to assist, through sharing of information, the performance of building spaces to professionals, contractors, and the building industry stakeholders (Kim et al., 2005: 1103). Approaches to BPE include those that specify on functional aspects, physical condition, safety and statutory requirements; quality assessment of building needs and facilities provided; serviceability of building with respect to occupants' needs and facilities provided; environmental performance in terms of indoor quality, air quality, intrusion, control, appearance, and lighting; energy consumption and indoor air quality; user satisfaction with the design and construction of and services in the building; post-occupancy evaluation of technical, functional and behavioural aspect of the buildings (Gupta & Chandiwala, 2010: 535).
Various typical studies in countries such as Nigeria (Adedire & Adegbile, 2018; Zunguzane, Smallwood & Emuze, 2012), Ghana (Ofori, 2020), and South Africa (Landman, Matsebe & Mmonwa, 2009) focus on user needs and expectations and play a part in determining the quality of residential environment and the performance of housing in general. Ibem et al. (2012) revealed that, in Nigeria, Papua New Guinea and Ghana, respectively, residents were dissatisfied with the building features. In Nigeria (Adedire and Adegbile, 2018: 146), residents were found to be most satisfied with design features, rooms numbers, and rooms sizes in their dwelling units.
3. STUDY AREA
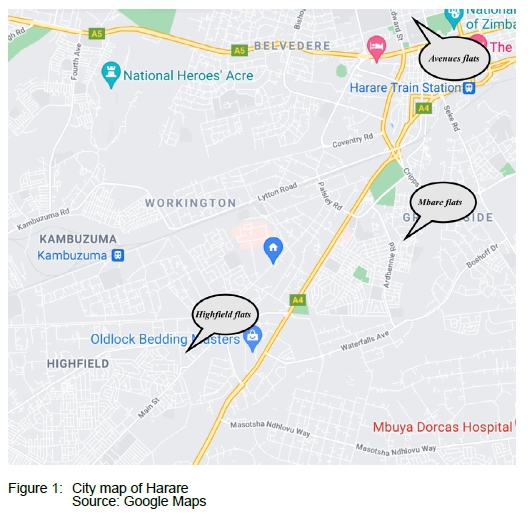
This research focused on Harare, the capital city of Zimbabwe, as the most populous city and the most densified and urban city in the country prove it to be a model for generalisation or sampling case that can represent the whole country by providing concise empirical data. It was established in 1890, when the British South African Company's pioneer column settled at Harare Kopje and hoisted the Union Jack (Iweka, 2014: 120). The settlement began to grow from this point and was named after the then British Prime Minister, Lord Salisbury. Salisbury, renamed Harare at independence, was established as the seat of government. Colonial laws ensured that it was a settlement with restrictive, racialised laws and planning mechanisms. Harare had a predicted population of approximately 1 800 000 people in 2015. This figure is expected to grow (by 3.54% annually) to 2,337,000 people by 2025 (UN Habitat, 2014: 137).
4. RESEARCH METHODOLOGY
The aim of this study is to measure residential satisfaction levels in public housing units measured as building performance indicators determined by the building's characteristics and the physical, locational, and service attributes of buildings. A quantitative research methodology in the form of a questionnaire survey design was adopted, as this type of design allows for the use of structured questionnaire surveys that enable researchers to generalise their findings from a sample of a population (Creswell, 2014: 10). A questionnaire survey with similar questions allowed the researcher to compare data from the different neighbourhoods surveyed.
Descriptive analysis was used to summarise the questionnaire data on the building characteristics and attribute performance by using frequencies and percentages (numerical) to reduce the number of responses to a mean score (Lawless & Heymann, 2010: 227). From these mean scores and Relative Performance Index, the variables to measure residential satisfaction could be determined and set.
Inferential analysis was used to examine the relationships among these quantitative variables. Several inferential analysis methods are available, but t-test, Pearson's R test and regression analysis were used. Using these tests, coefficient and probability-values (p-values) could be extracted, and thus explain the strength of the relationship between a pair of variables (Bewick, Cheek & Ball, 2003: 452).
4.1 Sampling method and size
Statistics from the Zimbabwe Statistical Agency show that, in 2016, Harare had a total of 12,483 housing units and a population of 153,265, specifically in the neighbourhoods Highfields, Mbare, and Avenues (Zimstats, 2017: 55). These were chosen since they are among the biggest public housing neighbourhoods and differ largely in terms of residential characteristics. Whilst Mbare and Highfields are highly crowded with various housing typologies, Avenues neighbourhood is less crowded with almost similar housing typologies.
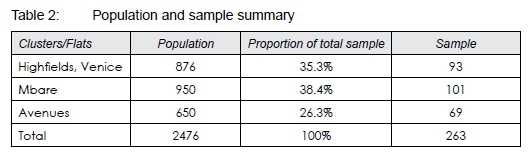
Two-stage sampling technique was used, because the population could be subdivided into clusters, and random samples could be collected from each cluster (Alvi, 2016: 22). In the first stage, three clusters were purposively selected from the council-owned flats in the residential areas of Highfields, Mbare and Avenues. From the cluster sample, quota sampling was used to select 2,476 housing units (see Table 2) to represent the population of council-owned flats. The Raosoft sample size calculator (2004) with a 90% confidence interval and 5% margin of error recommends a sample size for a total population of 2,476 to be 244. The current research uses a total sample size of 263 which is validated by the Raosoft sample size calculator (2004). Proportion is used to determine sample size for each residential housing neighbourhood (see Table 2).
4.2 Data collection
Between 10 and 18 April 2021, the researcher and research assistants distributed the structured questionnaire by hand to the 263 selected residents living in council-owned flats in Harare, Zimbabwe. The researcher and assistants left questionnaires with the residents during the morning from 8am to 11am, and collected them in the late afternoon from 3pm to 6pm each day. Among the residents who were able to respond to the questionnaires instantly, they did so for about 10 to 15 minutes and returned the completed questionnaires to the researcher.
The researcher also made use of observations to determine the housing typologies and materials used in building the residential buildings. Observations helped determine external characteristics such as safety and security structures (for instance, burglar bars, boundary walls, or fences). The observations were recorded in the questionnaire spaces if they had been left unfilled by the respondents.
The building attributes that determine resident satisfaction listed in the questionnaire were extracted from reviews of the literature (Ibem & Amole, 2013a: 563; Ibem & Amole, 2013b: 55), resulting in the formulation of a questionnaire divided into three parts. Part one, on the respondent's profile, obtained personal information on age, gender, marital status, years of living in unit, monthly income, and nature of tenure. Part two is a set of 25 Likert-scale items related to the construct 'building attributes' that determines resident satisfaction. Participants were requested to rate their level of satisfaction on the items regarding the attributions of the buildings in which they are living. Part three covers 10 tick-box questions on the type of physical elements of the buildings in which they are living. The results from these measurements form the items used in the descriptive analysis. To reduce the respondents' bias, closed-ended questions were preferred for Part two (Akintoye & Main, 2007: 601). The researcher ensured no bias, as no participation incentives were offered to respondents. Thus, participation by the respondents in the study was entirely voluntary.
4.3 Data analysis and interpretation of the findings
Descriptive and inferential statistics data was analysed using the Scientific Package for Social Sciences (SPSS) version 25.0 software. Frequencies and percentages were calculated in order to analyse the respondents' demographic profile, and the characteristics of buildings. Mean score ratings were also calculated to analyse residential satisfaction levels and the performance of buildings (Pallant, 2013: 134).
4.3.1 Descriptive analysis
To measure the residents' satisfaction levels with the building attributes, 27 attributes were rated on a five-point Likert scale. Likert-type or frequency scales use fixed choice response formats and are designed to measure attitudes or opinions (Wegner, 2012: 11). The following scale measurement was used regarding mean scores, where 1 = Very dissatisfied (>1.00 and £1.80); 2 = Dissatisfied (>1.81 and <2.60); 3 = Neutral (>2.61 and <3.40); 4 = Satisfied (>3.41 and <4.20), and 5 = Very satisfied (>4.21 and < 5.00).
In the evaluation of building performance, Relative Performance Index (RPIa) was computed for each building attribute as the sum of the actual satisfaction score (MS) on the five-point Likert scale given by all respondents on each building attribute (ASSac) as a proportion of the sum of maximum possible satisfaction score on the five-point Likert scale that all the respondents could give on each attribute (ASSmax). The RPIa is taken as a measure of the relative contribution of importance of each building attribute towards enhancing the activities and well-being of the residents. This is expressed mathematically as:
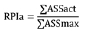
In the result expressing the maximum value of RPIa is 1.00 and the building attributes with RPIa value closer to 1.00 are considered to have the most contribution to the performance of the buildings in meeting occupants' needs and expectations.
4.3.2 Inferential analysis
Inferential analysis in form of t-test and Levene's Test of Equality of Variances were done to test if there were any significant differences in residential satisfaction between residents of the different sampled flats in various public housing neighbourhoods.
Pearson's R correlation test was employed to And any significant relationship between residential satisfaction and amenities in the building (Fenton & Neil, 2019: 18). The correlation coefficient adopted R values between -1 and 1, where: 1 indicates a strong positive relationship; -1 indicates a strong negative relationship, and 0 indicates no relationship at all.
Other tests performed include the ANOVA test for significance and the regression analysis to determine factors with significant impact on general residential satisfaction. The independent variables (neighbourhood attachment, residential situation, privacy, housing attribute preferences, dwelling proximity, socioeconomic characteristics, current housing characteristics) were tested for having significant influence on residential satisfaction (dependent variable).
5. RESULTS
5.1. Characteristics of respondents
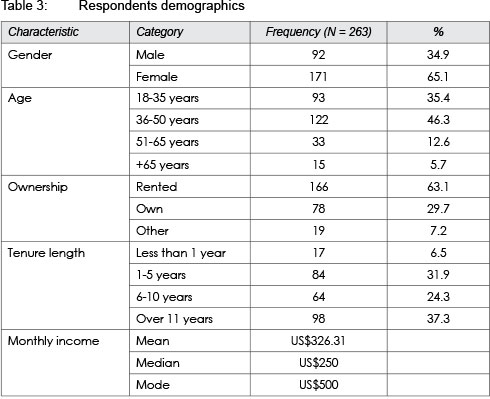
Table 3 shows that the vastmajority of the residents (65.1%) were females and rented (63.1%) their housing units. A large portion (64.4%) of the residents are 36 years or older and have lived in their housing units for over six years (61.6%), signifying the longest tenure (more than 11 years) as shown by 37.3% of the residents, indicating their capability to provide well-considered responses. The average monthly income for residents in high density housing in the three neighbourhoods were US$326.31 per month, showing that residents, on average, earn below the poverty date line, which according to the 2021 poverty date line pegged at US$418 (Zimstat, 2021: 2).
5.2 Characteristics of the buildings
Table 4 shows the most common type of building sampled being mid-rise typology (85.9%) constructed of mixed materials of cement, bricks, concrete steel and timber materials. In cases where the respondents were not sure about the construction materials used in building the residential structures, the researcher made use of observations.
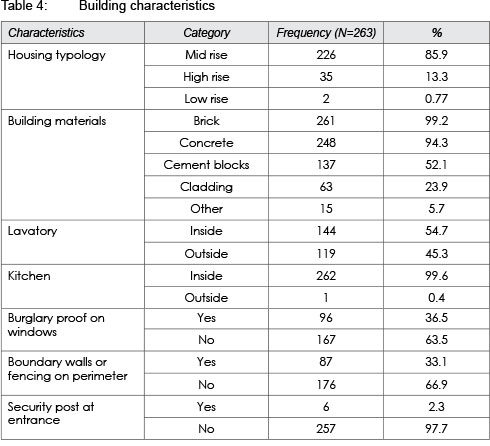
External characteristics of the buildings showed that safety and security is lacking on the premises and the buildings as only 36.5% of the housing units had burglar bars on doors and windows, 33.1% had boundary walls or fences around their building units, and only 2.3% had a security post at their building's entrance.
5.3 Users' satisfaction with building attributes and performance of the buildings
Table 5 shows the mean scores, ASSac, RPIa and ranking of the 27 building attributes that measures resident's satisfaction with building performance indicators. The average mean score (MS) of 2.17 indicates that overall, residents are dissatisfied with the attributes of the buildings in which they live and the general residential situation.
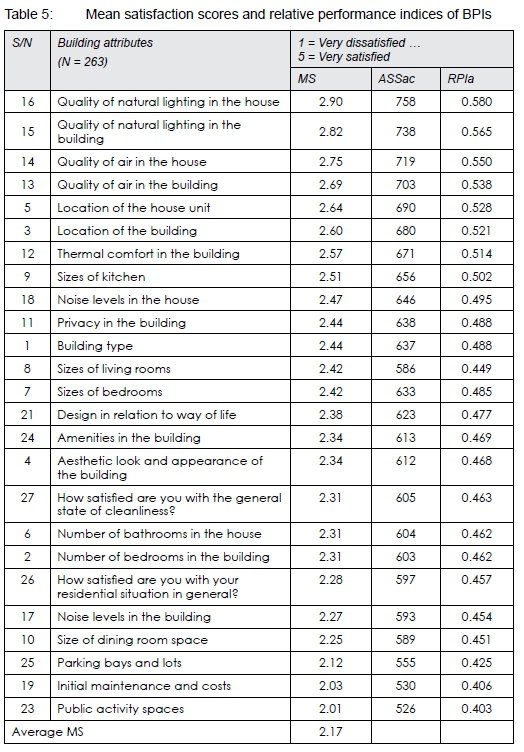
With MS above 2.61, 'Quality of natural lighting in the house (MS=2.90), 'Quality of natural lighting in the building (MS=2.82), Quality of air in the house (MS=2.75), 'Quality of air in the building' (MS=2.69), and 'Location of the house unit' (MS=2.64) were rated the attributes with which the residents were neither satisfied nor dissatisfied. Building attributes with MS between 2.01 and 2.27 show that residents are mostly dissatisfied with 'Public activity spaces' (MS=2.01), 'Initial maintenance and costs' (MS=2.03), 'Parking bays and lots' (MS=2.12), 'Size of dining room space' (MS=2.25), and 'Noise levels in the building' (MS=2.27).
Building attributes with RPIa value closer to 1.00 are considered to contribute the most to the performance of the buildings in meeting occupants' needs and expectations. Results in Table 5 show that none of the 27 building attributes had values above 0.580, indicating that the building performance indicators measured in this study do not satisfy the needs and expectations of the occupants. Results show the expected result with lowest RPIa value of 0.403 and the highest RPIa value of 0.580. This suggests that these attributes contribute the most and least, respectively, to performance of the buildings sampled. It can be deduced that performance of the different attributes with RPIa values of 0.502 and above contributed highly to the performance of the building with those with RPIa between 0.495 and 0.462 contributing moderately, and those with values below 0.462 contributing minimally.
5.4 Inferential results
Table 6 shows the independent samples test results indicating any significant differences in residential satisfaction between residents of the different sampled flats in various public housing neighbourhoods. The researcher assumed unequal variances, since residential satisfaction in the neighbourhoods is likely to differ and no test was performed to determine whether the variances were equal. The independent t-test that was conducted showed that at 95% confidence level, there are significant differences in residential satisfaction between residents of Highfield Venice Flats and those of Avenues Flats (t = 2.159, p-value= 0.053>0.05).
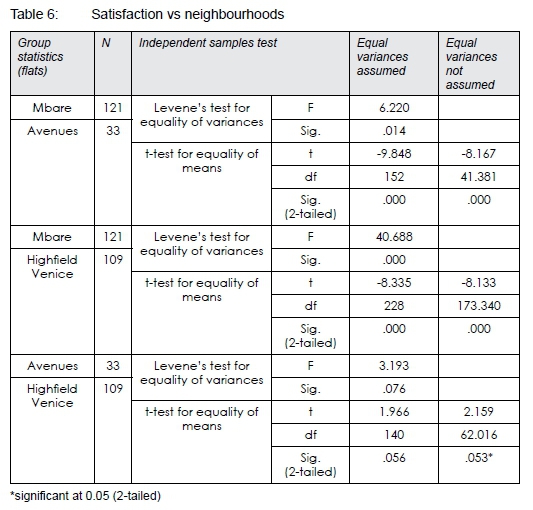
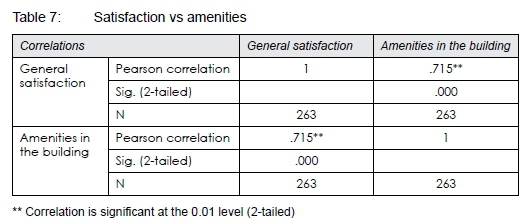
Table 7 shows the correlation results to test if poor building amenities are associated with dissatisfaction among residents in public housing neighbourhoods in Harare. The Pearson correlation test shows that there is a strong positive relationship between residential satisfaction and satisfaction with amenities in the building (r=0.715**, p-value = 0.000<0.01). Hence, poor building amenities are related to dissatisfaction among residents in high-density housing in Harare and vice versa.
Regression analyses were conducted to examine if potential predictors significantly affect general residential satisfaction. Tables 8 and 9 show the Model summary and Anova test results of the model. In Table 8, the R Square value shows that 68.1% of the variance in satisfaction scores can be predicted from the neighbourhood attachment, housing attribute preferences, residential situation, socio-economic characteristics, dwelling proximity, current housing characteristics, and privacy variables. The regression model is statistically significant, since the p-value of 0.00 is less than 0.05 and, therefore, the independent variables reliably predict the dependent variable.
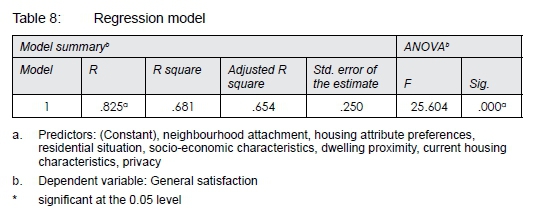
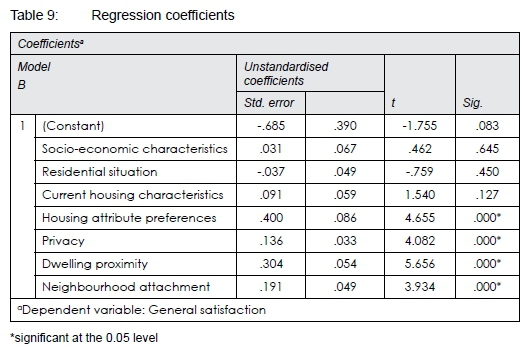
Table 9 shows that, when general residential satisfaction was predicted, it was found that housing attribute preferences (B=0.40; p=0.00); privacy (B=0.136; p=0.00); dwelling proximity (B=0.304; p=0.00), and neighbourhood attachment (B=0.191; p=0.00) were statistically significant predictors, since their p-values were below 0.05.
However, coefficients of other variables, including socio-economic characteristics, residential situation and current housing characteristics, were found to be statistically insignificant predictors of residential satisfaction, since their p-values are above 0.05.
6. CONCLUSIONS
This study set to evaluate Harare's public housing satisfaction levels in public housing neighbourhoods. The respondents' results suggest that there is a general dissatisfaction with the buildings, suggesting that the building performance is not meeting their needs and expectations.
It can be concluded that factors including housing attribute preferences, privacy, dwelling proximity, and neighbourhood attachment, determine residential satisfaction in the public housing neighbourhoods. The findings of this study imply that, in order to enhance the performance of residential buildings in public housing in Harare in meeting the expectations and needs of the occupants, some steps need to be taken that are targeted towards enhancing the determinants of residential satisfaction.
First, there is a need to improve housing attribute preferences, since regression analysis results showed that these have a positive and significant impact on residential satisfaction. Improvement can be done in preferences such as improving the quality of air and lighting as well as noise levels, since respondents expressed dissatisfaction with these attributes. Housing ceilings can be installed to reduce noise levels. Quality of air and lighting can be improved by inserting more air ventilations and wider windowpanes.
Secondly, privacy should be improved, since results from regression analysis showed that this has a positive and significant impact on residential satisfaction. Privacy can be improved by ensuring that the residential structures have boundary walls that are needed by the residents. Dwelling proximity and neighbourhood environment ought to be considered when setting up residential sites.
Thirdly, there is a need to improve dwelling proximity, which was also found to be a significant and positive determinant of residential satisfaction. The Ministry of National Housing and Social Amenities can consider developing structures such as shopping centres, public schools as well as roads and social amenities such as parks, pools and workout facilities before they build residential houses. This helps in ensuring that construction of these structures is not abandoned after residential houses have been built.
7. LIMITATIONS
Besides the findings of this study, the research is limited in a number of ways. First, the number of neighbourhoods investigated cannot be generalised for all public housing neighbourhood typologies, as it studied mid-rise buildings and not single-story detached houses. Secondly, with the onset of the COVID-19 pandemic, the researcher could not visit more areas with different housing typologies, in order to collect data from respondents.
REFERENCES
Adedire, F. & Adegbile, M. 2018. Assessment of housing quality in Ibeju-Lekki peri-urban settlement, Lagos State, Nigeria. Acta Structilia, 25(1), pp. 126-151. https://doi.org/10.18820/24150487/as25iL5 [ Links ]
Aigbavboa, C. & Thwala, W.D. 2016. Mega construction projects: Using stakeholder management for enhanced sustainable construction. American Journal of Engineering Research (AJER), 5(5), pp.80-86. [ Links ]
Akintoye, A. & Main, J. 2007. Collaborative relationships in construction: The UK contractors' perception. Engineering, Construction and Architectural Management Journal, 14(6), pp. 597-617. https://doi.org/10.1108/09699980710829049 [ Links ]
Alvi, A.M. 2016. Manual for selecting sampling techniques in research. University of Karachi, Iqra University, Karachi, Sindh, Pakistan. [ Links ]
Amini, M., Mahdavinejad, M. & Bemanian, M. 2019. Future of interactive architecture in developing countries: Challenges and opportunities in case of Tehran. Journal of Construction in Developing Countries, 24(1), pp. 163184. https://doi.org/10.21315/jcdc2019.24.1.9 [ Links ]
Bewick, V., Cheek, L. & Ball, J. 2003. Statistics review 7: Correlation and regression. Critical Care, 7(6), pp. 451-459. https://doi.org/10.1186/cc2401 [ Links ]
Buys, L. & Miller, E. 2012. Residential satisfaction in inner urban higher-density Brisbane, Australia: Role of dwelling design, neighbourhood and neighbours. Journal of Environmental Planning and Management, 55(3), pp. 319-338. https://doi.org/10.1080/09640568.2011.597592 [ Links ]
Cao, X.J. & Wang, D. 2016. Environmental correlates of residential satisfaction: An exploration of mismatched neighborhood characteristics in the Twin Cities. Landscape and Urban Planning, vol. 150, pp. 26-35. https://doi.org/10.1016/j.landurbplan.2016.02.007 [ Links ]
Carratt, A., Kokogiannakis, G. & Daly, D. 2020. A critical review of methods for the performance evaluation of passive thermal retrofits in residential buildings. Journal of Cleaner Production, vol. 263, Article 121408. http://dx.doi.org/10.1016/j.jclepro.2020.121408 [ Links ]
Chen, Y., Dang, Y. & Dong, G. 2020. An investigation of migrants' residential satisfaction in Beijing. Urban Studies, 57(3), pp. 563-582. https://doi.org/10.1177/0042098019836918 [ Links ]
Clement, O.I. & Kayode, O. 2012. Public housing provision and user satisfaction in Ondo State, Nigeria. British Journal of Arts and Social Sciences, 8(1), pp.103-111. [ Links ]
Creswell, J.W. 2014. Research design: Qualitative, quantitative and mixed methods approaches. 4th edition. Thousand Oaks, CA: Sage. [ Links ]
Fatoye, E.O. & Odusami, K.T. 2009. Occupants' satisfaction approach to housing performance evaluation: The case of Nigeria. In: Proceedings of the RICS COBRA Research Conference, University of Cape Town, 10-11 September, pp. 929-943. [ Links ]
Fenton, N. & Neil, M. 2019. Risk assessment and decision analysis with Bayesian networks. Boca Rayton, FL: CRC Press. https://doi.org/10.1201/b21982 [ Links ]
Gopikrishnan, S. & Paul, V.K. 2018. Validation and ranking of user requirement related building performance attributes and sub-attributes for government residential buildings. Facilities, 36(13/14), pp. 638-656. https://doi.org/10.1108/F-09-2017-0094 [ Links ]
Gopikrishnan, S. & Topkar, V.M. 2017. Attributes and descriptors for building performance evaluation. HBRC Journal, 13(3), pp.291-296. https:// doi.org/10.1016/j.hbrcj.2015.08.004 [ Links ]
Gupta, R. & Chandiwala, S. 2010. Understanding occupants: Feedback techniques for large-scale low-carbon domestic refurbishments. Building Research and Information, 38(5), pp. 530-548. https://doi.org/10.1080/09613218.2010.495216 [ Links ]
Huang, Z. & Du, X. 2015. Assessment and determinants of residential satisfaction with public housing in Hangzhou, China. Habitat International, vol. 47, pp. 218-230. https://doi.org/10.1016/j.habitatint.2015.01.025 [ Links ]
Ibem, E.O. & Amole, D. 2013a. Residential satisfaction in public core housing in Abeokuta, Ogun State, Nigeria. Social Indicators Research, vol. 113, pp. 563-581. https://doi.org/10.1007/s11205-012-0111-z [ Links ]
Ibem, E.O. & Amole, D. 2013b. Subjective life satisfaction in public housing in urban areas of Ogun State, Nigeria. Cities, vol. 35, pp. 51-61. https://doi.org/10.1016/j.cities.2013.06.004 [ Links ]
Ibem, E.O., Opoko, A.P., Adeboye, A.B. & Amole, D. 2013. Performance evaluation of residential buildings in public housing estates in Ogun State, Nigeria: Users' satisfaction perspective. Frontiers of Architectural Research, 2(2), pp.178-190. https://doi.org/10.1016/j.foar.2013.02.001 [ Links ]
Ilesanmi, A.O. 2010. Post-occupancy evaluation and residents' satisfaction with public housing in Lagos, Nigeria. Journal of Building Appraisal, 6(2), pp.153-169. https://doi.org/10.1057/jba.2010.20 [ Links ]
Iweka, A.C.O. 2014. A post-occupancy evaluation of dwelling density in multifamily apartments in public housing estates in Lagos. PhD thesis. Nigeria, University of Lagos School of Postgraduate Studies. [ Links ]
Jiboye, A.D. 2012. Post-occupancy evaluation of residential satisfaction in Lagos, Nigeria: Feedback for residential improvement. Frontiers of Architectural Research, 1(3), pp. 236-243. https://doi.org/10.1016/j.foar.2012.08.001 [ Links ]
Kelly, S., Crawford-Brown, D. & Pollitt, M.G. 2012. Building performance evaluation and certification in the UK: Is SAP fit for purpose? Renewable and Sustainable Energy Reviews, 16(9), pp. 6861-6878. https://doi.org/10.1016/j.rser.2012.07.018 [ Links ]
Kian, P.S., Feriadi, H., Sulistio, W. & Seng, K.C. 2001. A case study on total building performance evaluation of an intelligent office building in Singapore. Civil Engineering Dimension, 3(1), pp. 9-15. [ Links ]
Kim, S.S., Yang, I.H., Yeo, M.S. & Kim, K.W. 2005. Development of a housing performance evaluation model for multi-family residential buildings in Korea. Building and Environment, 40(8), pp. 1103-1116. https://doi.org/10.1016/j.buildenv.2004.09.014 [ Links ]
Landman, K., Matsebe, G. & Mmonwa, M. 2009. Assessing the physical characteristics of medium density mixed housing in South Africa. Town and Regional Planning nr 54, pp. 15-26. [ Links ]
Lawless, H.T. & Heymann, H. 2010. Descriptive analysis. In: Lawless, H.T. Sensory evaluation of food - Principles and practices. New York, NY: Springer, pp. 227-257. https://doi.org/10.1007/978-1-4419-6488-5_10 [ Links ]
Mallory-Hill, S., Preiser, W.F. & Watson, C.G. 2012. Enhancing building performance. London, UK: John Wiley and Sons. [ Links ]
Mitterer, C., Künzel, H.M., Herkel, S. & Holm, A. 2012. Optimizing energy efficiency and occupant comfort with climate-specific design of the building. Frontiers of Architectural Research, 1(3), pp. 229-235. https://doi.org/10.1016/j.foar.2012.06.002 [ Links ]
Mustafa, F.A. 2017. Performance assessment of buildings via post-occupancy evaluation: A case study of the building of the architecture and software engineering departments in Salahaddin University-Erbil, Iraq. Frontiers of Architectural Research, 6(3), pp. 412-429. https://doi.org/10.1016/j.foar.2017.06.004 [ Links ]
Ofori, P. 2020. Housing poverty in developing countries: Challenges and implications for decent accommodation in Swedru, Ghana. Acta Structilia, 27(2), pp. 57-92. https://doi.org/10.18820/24150487/as27i2.3 [ Links ]
Pallant, J. 2013. SPSS survival manual: A step-by-step guide to data analysis using IBM SPSS. 5th edition. Crows Nest, Australia: Allen and Unwin. [ Links ]
Preiser, W.F. & Hardy, A. 2014. Historical review of building performance evaluation. In: Preiser, W.F.E. (Ed.). Architecture beyond criticism. London: Routledge, pp. 181-193. https://doi.org/10.4324/9781315740652 [ Links ]
Raosoft. 2004. Sample size calculator. [Online]. Available at: <http://www.raosoft.com/samplesize.html> [Accessed: 25 June 2021]. [ Links ]
Smrke, U., Blenkus, M. & Socan, G. 2018. Residential satisfaction questionnaires: A systematic review. Urbani izziv, 29(2), pp. 67-82. https://doi.org/10.5379/urbani-izziv-en-2018-29-02-001 [ Links ]
UN Habitat. 2014. The state of African cities. United Nations Human Settlements Programme, Nairobi, Kenya, pp. 1-207. [ Links ]
Wang, D. & Wang, F. 2016. Contributions of the usage and affective experience of the residential environment to residential satisfaction. Housing Studies, 31(1), pp. 42-60. https://doi.org/10.1080/02673037.2015.1025372 [ Links ]
Wegner, T. 2012. Applied business statistics methods and Excel-based applications solutions manual. 4th edition. Cape Town: Juta. [ Links ]
Zimstats (Zimbabwe National Statistics Agency). 2017. Population Projections Thematic Report. Zimstats, Harare. [ Links ]
Zimstats (Zimbabwe National Statistics Agency). 2021. Poverty Datum Lines - May 2021. Zimstats, Harare. [Online]. Available at: <https://www.zimstat.co.zw/wp-content/uploads/publications/Income/Prices/2021/PDL/PDL_05_2021.pdf>. [Accessed: 8 July 2021]. [ Links ]
Zunguzane, N., Smallwood, J. & Emuze, F. 2012. Perceptions of the quality of low-income houses in South Africa: Defects and their causes. Acta Structilia, 19(1), pp. 19-38. [ Links ]
Received: June 2021
Peer reviewed and revised: September 2021
Published: December 2021
DECLARATION: The author(s) declared no potential conflicts of interest with respect to the research, authorship, and/or publication of this article.

