


Services on Demand
Article
 English (pdf)
 Article in xml format
 Article references
Indicators

Related links
-
 Cited by Google
 -
 Similars in Google
Share

 Permalink
Acta Structilia
On-line version ISSN 2415-0487
Print version ISSN 1023-0564
Acta structilia (Online) vol.26 n.2 Bloemfontein 2019
http://dx.doi.org/10.18820/24150487/as26i2.2
RESEARCH ARTICLES
Effectiveness of contractor development programme in KwaZulu-Natal
Theo HauptI; Weziwe HadebeII; Mariam AkinloluIII
IProf. Theo (T.C.) Haupt, Research Professor, Faculty of Engineering, Mangosuthu University of Technology, 511 Griffiths Mxenge Highway, Umlazi, Durban, 4031. Phone: +27 82 6863457, E-mail: <theo.haupt@mut.ac.za>
IIMs Weziwe (W.) Hadebe, School of Engineering, University of KwaZulu-Natal, Durban, South Africa. Phone: +27 71 864 6465, E-mail: <Weziwemhlongo@gmail.com>
IIIMs Mariam (M.) Akinlolu, School of Engineering, University of KwaZulu-Natal, Durban, South Africa. Phone: +27840503384, E-mail: <akinlolumariam@gmail.com>
ABSTRACT
The article investigates the level of satisfaction with the South African Department of Public Work's Contractor Development Programme (CDP) in terms of its effectiveness. A mixed method research approach (combination of quantitative and qualitative approach) is employed for the collection of both statistical and in-depth information on the perceptions of participants on the CDP. Survey data collected from 364 participants and interview data from six focus-group participants in the KwaZulu-Natal (KZN) province of South Africa forms the data sets for the article. Data was analysed using the Statistical Package for the Social Sciences (SPSS) version 23. Descriptive statistics is used to report the reliability of the various constructs, mean scores, standard deviations, and correlations. The findings show that participants not only deemed the programme unsatisfactory, but also reported an overall negative experience with the programme. Specific findings show that the CDP offers no training opportunities to registered members, lacks effective communication mediums, and benefited only those with political connections. The correlation results show that there is a strong relation between population and registering on the CDP, thus confirming that the open and easy access when registering on the CDP allows any interested person to automatically become a contractor creating the possibility of abuse of the programme. The study was limited to KZN contractors only and may, therefore, not be generalised to the entire national population of contractors. This article is relevant, as it gives insight into how satisfied contractors are with the CDP. It may help potential contractors to consider whether the CDP will be beneficial to them, before they decide to join the programme.
Keywords: CIDB, Construction Industry Development Board, contractor development, contractor development programme, contractor growth, contractor performance
ABSTRAK
Die artikel ondersoek die vlak van tevredenheid met die Suid-Afrikaanse Departement van Openbare Werke se kontrakteurontwikkelingsprogram (KOP) in terme van die doeltreffendheid daarvan. ' n Gemengde navorsingsbenadering (kombinasie van kwantitatiewe en kwalitatiewe benaderings) is gebruik. Die metode maak gebruik van die versameling van beide statistiese en in-diepte inligting oor die persepsies van deelnemers op die KOP oor die effektiwiteit daarvan. Opname-data versamel van 364 deelnemers en onderhouddata van ses fokusgroep-deelnemers in die KwaZulu-Natal (KZN) provinsie van Suid-Afrika vorm die datastelle vir die artikel. Data is geanaliseer met behulp van die SPSS-weergawe 23. Beskrywende statistiek is gebruik om die betroubaarheid van die verskillende konstrukte, gemiddelde tellings, standaardafwykings en korrelasies te rapporteer. Die bevindinge toon dat deelnemers nie net die program as onbevredigend beskou het nie, maar ook 'n algehele negatiewe ervaring met die program gerapporteer het. Spesifieke bevindings toon dat die KOP nie opleidingsgeleenthede aan geregistreerde lede bied nie, nie effektiewe kommunikasiemediums het nie en slegs diegene met politieke verbindings bevoordeel. Die korrelasieresultate toon dat daar 'n sterk verband is tussen die populasie en registrasie op die KOP wat bevestig dat die oop en maklike toegang tot die program deur enige belanghebbende persoon om outomaties 'n kontrakteur te word, die moontlikheid skep dat die program misbruik word. Die studie is slegs beperk tot KZN kontrakteurs en mag dus nie noodwendig tot die hele nasionale bevolking van kontrakteurs genasionaliseer word nie. Hierdie artikel is relevant, aangesien dit insig gee oor hoe tevrede kontrakteurs met die KOP is. Dit kan potensiële kontrakteurs help om te besluit of die KOP voordelig sal wees voordat hulle besluit om by die program aan te sluit.
Sleutelwoorde: Kontrakteursgroei, kontrakteursontwikkeling, kontrakteurs-ontwikkelingsprogram, Ontwikkelingsraad vir die Konstruksiebedryf, ORKB
1. Introduction
Although the government is implementing and awarding tenders in its construction-led projects through the Contractor Development Programme (CDP), this programme of the South African Department of Public Works focuses on the development of contractors who aim to execute public sector construction projects, especially those regarded as previously marginalised and primarily Black-owned and emerging contractors. In the context of this article, an emerging contractor is a "sole trader, partnership or legal entity that adheres to statutory labour practices, is registered with the South African Revenue Service and is a continuing and independent enterprise for profit, providing a commercially useful function" (ECDP, 2015: 15).
By focusing primarily on emerging contractors, the programme focuses on contractors registered in Construction Industry Development Board (CIDB) Grades 2 and 3 who display the potential to develop and grow their businesses. Through learnerships and mentoring, which are part of the development programme, the emerging contractor's skills in the business side of contracting are developed such as tendering, pricing, financial management, marketing, and contract administration. In KwaZulu-Natal alone, the programme has 6 900 contractors between Grades 1 to 3, of which the majority is Grade 1. Despite an increase in the number of government-led construction projects, contractors remain dissatisfied with the programme operations (Mgqongisa, 2018). Particular to this article, the CIDB's lowest contractor grading, Grade 1, offers 'no barrier' to entry into the industry, resulting in 'open access' programmes for all interested parties (Greve, 2014: 1). Moreover, 'open access' to such programmes makes it difficult for companies/clients to select high-potential entities from the 'magnitude' of those registered. This is counter-productive, resulting in that the programme's goals are not being achieved (CIDB, 2014: 49).
This article is, therefore, approached with the assumption that, while the CDPs are critical in assisting contractors to achieve overall improved performance, growth and development, the openness of registration on these programmes is, in fact, hindering the development of contractors. It is, therefore, important to examine the level of satisfaction with the CDP in terms of its effectiveness. Without identifying the satisfaction with the growth and development aspects of the programme, it may be difficult to run these programmes successfully.
2. Literature review
2.1 The construction industry in South Africa
The construction industry plays a crucial role in fostering development in the formal and informal sectors of the South African economy (CIDB, 2011: 22). The industry is instrumental for overall investment and serves as a key driver of economic development. Although, like other economic sectors such as manufacturing, agriculture and mining, the industry contributes to the economic development, it provides means for other sectors to realise growth (CIDB, 2011: 22).
For example, construction within agriculture is crucial for the sector to expand.
According to Statistics South Africa (2016: 12), the construction industry in South Africa is also the main contributor to employment and growth. In 2012, the industry created one million work opportunities, with an additional estimate of 424 000 individuals employed in the formal sector (Public Works, 2012: 19). In the period between September 2005 and September 2006, the annual employment growth was 9.5%, with this sector increasing its figures by 390 000 people in the period between 2001 and 2006 (Provincial Treasury, 2008: 16). Moreover, the industry has seen a significant increase in growth of 14%, a 4% increase from 10% in 2005. Furthermore, figures indicate that, notwithstanding domestic and global economic challenges, the industry's confidence in South Africa has improved slightly in the first quarter of 2017 (South African Reserve Bank, 2017: 55). This follows a mild improvement in construction activity and drop in the investor confidence in the period between 2011 and 2015 (Stats SA, 2016: 63). While overall investment in the economy increased by 4.4% year to year in the fourth quarter, the real growth in construction works was 2.3% year on year in the fourth quarter of 2016, up from 1.3% in the third quarter (Stats SA, 2016: 63).
Historically, public sector infrastructure expenditure has increased by 15.8% per year between the 2003-2004 and the 2006-2007 financial years (Public Works, 2012: 25). The construction industry alone has successfully contributed 35% to the total gross domestic fixed investment. In this process, close to 230 000 work opportunities have been created and the poverty gap was slightly decreased. Combined, the total value of the construction industry in 2006 was estimated at R122 345 billion. This is 38% of the total gross capital formation. The government alone, through its public infrastructure investment, remains the single main contributor of construction, thus contributing between 40% and 50% to the entire construction expenditure. The government's infrastructure investment has seen the construction of government houses, bridges, roads, schools, clinics and many more infrastructures. All these have seen an influx of entrepreneurs under the small and medium categories who are trying to venture into the construction sector. These entrepreneurs are attracted to the returns that the industry brings (Chadhliwa, 2015: 48). The system controls in place to regulate the influx of emerging contractors appear to be weak, thus opening up to any individual to qualify to be an entrepreneur. The fact that government is the main driver of construction investment is good in that it can easily roll out empowerment programmes such as the CDP and should be able to regulate this programme through incentives and punitive measures, if it wants to realise its goals to empower the previously disadvantaged groups (Chadhliwa, 2015: 48).
Ntuli and Allopi (2013: 91) indicated a number of challenges facing the construction industry in South Africa. These challenges were assessed or observed when projects were being rolled out. The challenges include poor performance, decrease in market capitalisation, poor marketing strategies, lack of opportunities, compliance and, most importantly, lack of necessary skills to compete better in the construction market (Ofori, 2007: 1; Windapo & Cattel, 2013: 66). In fact, shortage of skills and poor management were identified as the biggest challenges facing the South African construction industry (Mbande, 2010: 213). In a survey conducted in 2013 (Business Live), the annual international Business Report from Grant Thornton discovered that a shortage of skilled workers is the main obstacle to expansion of 58% of medium-to-large businesses in South Africa (Maswangany, 2013: online). Some of the main contractors have no idea of basic construction requirements. Some have qualifications in construction, but they lack basic management skills. This leads to mismanagement of funds, poor operations, and not meeting project deadlines. Accurate predictions of project completion and meeting completion dates result in clients being satisfied, giving contractors a comparative advantage over others (Heyns & Luke, 2012: 109).
This lack of skills in the industry appears to link with a very low survival rate in South Africa's SME sector (Mahembe, Chimya & Mbewe, 2011: 24). This is a major cause for concern, because those emerging without skills, resources or management skills are bound to fail. In addition, the failure of emerging contractors, due to lack of necessary skills, is linked with the fact that many obtain opportunities through corrupt means. For example, a contractor without any skill would secure a tender before establishing a business (Merena, 2018: 1). Windapo and Cattel (2013: 68) indicate that some companies pay governmental departments to have tenders secured or fast tracked, thus leading to entity failure and other challenges. Instead of possessing the necessary required skills, the vast majority of the emerging entrepreneurs required capital (Thwala & Mofokeng, 2012: 715). Even though skills developed by the contractors on the development programme are a priority, this area remains a challenge and hindrance to achieving the objectives of the programme. The inability to wholly understand the construction process, the lack of project management skills, the complexity of the project, uncertainty, poor communication, as well as the inadequate integration and coordination of tasks all result in delays in project delivery (Aiyetan, Smallwood & Shakantu, 2011: 21).
2.2 Historical overview of contractor development programme
The economic exclusiveness of South Africa emanates from the economic structures designed by the apartheid regime to protect the interests of the minority (Govender & Watermeyer, 2000: 3). In this process, economic opportunities favoured mostly Whites and Blacks were systematically sidelined. The Black majority's access to economic opportunities began in 1994, after the first democratic elections. To redress the economic consequences of apartheid, South Africa, under the new government, introduced a number of reforms seeking to ensure inclusive economy. Such instruments seeking to redress the effects of the apartheid system include policies, strategies, plans and programmes of actions. Moreover, a number of legislative organs such as parliament and government structures are used as tools to promote inclusive socio-economic opportunities. Such tools include public sector procurement systems that seek to "increase the base of economic activity, provide economic opportunities for the previously disadvantaged individuals and to address skewed racial ownership patterns as indicated in the PPPFA Act 23 of 2000" (Bhorat, Murray, Muzi, Servaas & Ingrid, 2001: 32).
Employment and business opportunities for previously marginalised individuals and communities are provided by means of targeted procurement and a variety of techniques, all of which seek to provide opportunities for the targeted enterprises. According to Thwala and Mofokeng (2012: 715), targeted procurement, in a practical, realistic and measurable manner, allows government to achieve certain socio-economic objectives through engineering and construction works contracts. In addition, it enables organs of state to "operationalise policies in a transparent, targeted, visible and measurable manner when engaging in economic activity with the private sector, without compromising principles such as cost, efficiency, competition, transparency and equitability" (Windapo & Cattel, 2013: 69). In 1966, in the context of the construction industry, the government through Public Works introduced an affirmative procurement policy in the quest to redress the economic burdens of apartheid. For many in the industry, this was the first attempt to ensure that previously disadvantaged construction firms (primarily Black owned) are awarded an equal opportunity to those owned by Whites. This policy mainly targeted affirmable business enterprises (ABEs), defined as enterprises that are registered with the South African Revenue Services (SARS), conforming to labour standards, and that Black persons own, manage and control, with turnovers within prescribed limits (Watermeyer, Gouden, Letchmiah & Sheze, 1998: 15-17).
The introduction of ABEs was followed by another government policy, Black-Economic Empowerment (BEE), seeking to transform the economy to include more Blacks. It follows a research by Bhorat et al. (2001: 50), which indicates that the historical and deliberate marginalisation of Black South Africans from contributing freely in the mainstream economy resulted in a society marked by vast inconsistencies and inequalities. As a result, the government's BEE policy objective was centred on strengthening South Africa's shared economy, in order to meet the needs of all the people of South Africa and significantly minimise the gap between citizens irrespective of race, in terms of skills and opportunities in the shortest possible time. However, due to the sluggish implementation of this policy, frustrations began to arise and those promised to benefit from this policy immediately accused the policy of lacking commitment and the fear that it may not meet its objectives (Thwala & Mofokeng, 2012: 720). Sluggish transformation through BEE has seen construction industry suffering transformation and inclusion (Tshetu, 2014: 4). Those contractors who did not possess all the necessary resources, capacity or expertise with which to fulfil contracts in their own right were the most frustrated (Thwala & Mafokeng, 2012: 720). In a nutshell, the construction industry was never spared from the sluggish implementation of BEE. Thus, the CDP was developed premised on the compelling need to unlock growth constraints, to develop sustainable contracting capacity, and to elevate the enterprise development of previously disadvantaged individuals, as per above (CIDB, 2011: 43).
The public sector-led CDP consists of a partnership between the CIDB, the National and Provincial Public Works, and other willing stakeholders and partners. The main objectives of the programme are to increase the capacity, equity ownership, sustainability, quality and performance of contractors registered with the CDIB. The ultimate goal is to effectively raise the construction industry's contribution to South Africa's accelerated and shared growth initiative.
To achieve this objective, participants within the National Contractor Development Programme should commit to all or some of the following developmental outcomes:
• Improve the grading status of contractors in targeted categories and grades;
• Increase the number of Black women, the disabled, and youth-owned companies in targeted categories;
• Create sustainable contracting enterprises by enabling continuous work through a competitive process;
• Improve the performance of contractors in terms of quality, employment practices, skills development, safety, health and the environment, and
• Improve the business management and technical skills of these contractors (CIDB, 2011: 45).
2.3 Contractor development programme
2.3.1 Selection criteria
As outlined in the programme framework, targeting specific contractors forms an integral part of the design of a CDP. The guidelines hereunder should be followed when identifying target groups:
• Ownership: CDPs should target the development of Black women, the disabled, and youth-owned companies. Specifically, CDPs should target the development of companies in those Classes of Works (CoWs) and Grades where imbalances in such ownership exist.
• Supply and demand: CDPs should target the development of new contracting capacity only where demonstrable shortages exist that are aligned with the service delivery objectives of the client.
• Performance improvement (or competence development): CDPs should aim to improve the performance of contractors - particularly in those areas that align with the service delivery objectives of the client.
• Local economic objectives: Where feasible, targeting of contractors should reflect local economic objectives (CIDB, 2011: 12).
2.3.2 Programme support initiatives
As envisioned in the CDP implementation manual, the crucial element in any CDP is the support initiatives provided or arranged by clients. These include mentoring, technical skills development, business and financial management training, access to finance, or a combination of the above.
2.3.2.i Training
This initiative requires the client to organise training with an accredited institution. The training should be aligned with the Requirements and Guidelines for CIDB Contractor Competence Accreditation, available from the CIDB, which are deemed to be minimum standards necessary for running a contracting enterprise and for supervising building and construction works within the fields of business management; building and construction works management (operational and supervision); legislative issues, and training strategy.
A training strategy determines the overall training programme and logistics to conduct training. It should address the training approach, objectives and outcomes, based on the contractors' training requirements stated earlier, as well as the process of identifying and mobilising training institutions that can provide the required training. The following logistical arrangements should be addressed: the number of people to be trained; the venue and date of the training; the training materials required; the expected input and output of the training, and the training service provider must identify suitable training service providers to provide the training.
The training should be accredited with the Construction Education and Training Authority and be provided and structured to such an extent that the contractor can meet the requirements for CIDB Contractor Competence Accreditation. This typically involves the attainment of formal NQF level qualifications, or workplace training and experience leading to the equivalent competence.
2.3.2.ii Mentoring
A contractor's mentorship needs are to be identified and an appropriate mentorship intervention should be developed. Mentorship should revolve primarily around the contractor's business management skills and knowledge, such as tendering and marketing. Mentors must be registered as mentors with the Council of Project and Construction Management Professionals.
2.3.3 Contractor assessment
The purpose of the assessment is to select contractors who meet the entry level requirements in line with the focus of the CDP, and to determine their developmental needs. All contractors applying for development must be registered in the CIDB Register of Contractors (CIBD, 2011: 52).
2.3.3.i Criteria for access
Clients should apply the following criteria in order to determine which contractors get access to CDPs: competence; financial upgrading; socio-economic goals, and competence (CIDB, 2011).
The contractors must be assessed in order to determine their level of competence, as outlined in the Requirements and Guidelines for CIDB Contractor Competence Accreditation. The competence assessment can be done in terms of formal qualifications and experience requirements, or in terms of the requirements for an external competence assessment undertaken by a CIDB-recognised external Competence Assessment Panel. The competence assessment will then also be used to evaluate the mentoring and training requirements of contractors who are enrolled within a CDP.
2.3.3.ii Financial upgrading factor
The contractor must be assessed to determine a financial upgrading factor and to measure how close the contractor is to upgrading to the next grade designation. The financial upgrading factor is determined in line with the requirements of the CIDB Register of Contractors based on the following: best annual turnover; largest contract, and available capital (based on the current CIDB requirements).
Once the rate for each area has been determined, the client should allocate an overall financial upgrading factor rating, using the following formula: Best annual turnover + largest contract + available capital = Overall financial upgrading factor rating (CIDB, 2011: 14).
2.3.3.iii Awarding points for socio-economic goals
The selection process for the contractors should give preference to enterprises with historically disadvantaged individual equity ownership (women, the disabled and youth ownership). Therefore, contractors must be scored out of a maximum of 20 points for socioeconomic goals in line with the referencing policy of the department (CIDB, 2011: 16).
2.3.3.iv Selecting contractors for development
The contractor rating (out of 80) should be added to the points awarded for socio-economic objectives (out of 20), in order to determine the overall score awarded to the contractor. Contractors should then be ranked from highest score to lowest score and the cut-off point is determined by the budget available. In order for a contractor to be selected for contractor development, a minimum score of 20 should be obtained for the overall score awarded (CIDB, 2011: 33).
2.3.4 Shortcomings of the programme
The assessment of the programme shows that, although the programme has achieved many successes, the following shortcomings remain a challenge to the programme and, to some extent, hinder greater achievements (Hadebe, 2017: 32).
2.3.4.i Poor coordination of subcontractors
The vast majority of the emerging contractors are subcontracted and need to be properly coordinated by the prime contractor to ensure timeous delivery of assigned aspects of works. However, while main contractors are expected to swiftly coordinate subcontractors, this has proven to be a major challenge, which, at times, leads to the suffering of all those involved in the project.
2.3.4.ii Inappropriate construction methods
The construction industry is a complex industry that requires activities to be carried out using best practices, tools and techniques. When construction procedures are flawed, errors occur, thus leading to rework and delays. A plan that is not realistic and that does not conform to construction methods will lead to a delay in project completion or, in a worst-case scenario, could lead to the collapse of a project. At times, local contractors fail to comply with practicable work programmes at the initial stage of project planning. This, in turn, impairs the monitoring of project progress against the stipulated time.
2.3.4.iii Inadequate experience
Experience in the construction industry can be a matter of life and death for a project or even the business of the contractor. Particular to this study, contractors who simply gain entrance to the CDP without prior experience in construction are among those who hinder the programme's progress.
2.3.4.iv Incompetent and poor management
Important to this study, proper construction management is the backbone of any successful construction business. Contractor's employees who are not skilled in project management are not able to manage their project site appropriately, thus culminating in faulty work, reworks and delay in completion of tasks. In addition, a study by the CIDB (2011: 41) on lack of management shortcomings of subcontractors identified the following:
• Overall, management practices of specialist subcontractors were considered by main contractors to be good, but for generalist and trade subcontractors were considered to be fair to poor;
• Financial management skills and business management systems of general subcontractors were poor, with business management skills and management and supervision being fair;
• Lack of financial pricing and estimating skills;
• Lack of access to finances and continued support from CDIB;
• Poor health and safety management practices; and
• Reluctance to train employees.
2.3.4.v Lack of skills
Proper management, financial management, and overall technical skills in the construction industry are the apex. Without these skills, construction activities could potentially be a dangerous activity, a fruitless exercise, and a losing game.
Although the principal aim of the CDP or emerging CDP is to address the need to unlock economic growth constraints, develop sustainable contracting capacity, and elevate enterprise development of previously disadvantaged individuals, there is limited literature evaluating the achievement of these objectives.
3. Research methodology
This study examines the level of satisfaction with the CDP, in the KwaZulu Natal province, in terms of its effectiveness. The study uses a mixed methods design, in which qualitative and quantitative data are collected in parallel, analysed separately, and then merged (Creswell & Plano-Clark, 2007; Grbich, 2013: 27). In this study, the focus-group interviews explored the experience, performance, growth and development of six CDP participants. The semi-structured questionnaire survey examined 364 CDP beneficiaries in terms of their overall satisfaction and experience with the CDP. The reason for collecting both quantitative and qualitative data is to elaborate on specific findings from the breakdown of the focus-group transcripts, and crosscheck the data against the questionnaire data set such as similar experiences and satisfaction with the CDP suggested from the respondents (Creswell & Plano-Clark, 2007).
3.1 Sampling technique and response rate
A combined list of 6 900 Grades 1 to 3 contractors, registered on the CIDB KwaZulu-Natal contractors' list, was obtained from the CIDB database. This includes 5 000 registered contractors under Grade 1; 1 502 under Grade 2, and 398 under Grade 3 who are beneficiaries of the CDP, making it impossible to obtain responses from the entire population. For the quantitative questionnaire survey, non-probability convenience sampling (Alvi, 2016: 29) was used to select 364 CDP beneficiaries, residing in Pietermaritzburg city in the Msunduzi Local Municipality in the KwaZulu-Natal province of South Africa, who were accessible and available to participate in the study, indicating a 5% sample size for the study. For populations of 5 000 or above, population size is virtually irrelevant and a sample size of +/-400 is adequate (Leedy & Omrod, 2014: 136). Respondents were contacted prior to the questionnaires being emailed to them, resulting in a speedy response and a 100% response rate. According to Moyo and Crafford (2010: 68), contemporary built-environment survey response rates range from 7% to 40%, in general.
For qualitative data collection, purposive convenience sampling was used to sample six participants who simultaneously participated in the focus-group interviews. Purposive sampling allows the researcher to choose participants based on their characteristics, pre-knowledge and capability of providing adequate knowledge deemed necessary for a study (Bless, Higson-Smith & Sithole, 2013: 172; Du Plooy 2009: 123). The rule of thumb in determining the size of the focus group should range between 6 and 10, plus a moderator and an assistant (Bernard, 2011).
3.2 Data collection
A structured questionnaire survey was distributed to 364 registered Grades 1 to 3 contractors, registered on the CIDB KwaZulu-Natal contractors' list in South Africa from August to September 2017. The questionnaire consisted of four sections. The first section obtained the biographic profile of the targeted population, namely gender, population group, position in the business, highest educational level, number of years' experience in the business, and the type of business. Section two is a set of 16 Likert-scale items relating to the construct overall satisfaction with the registration process of the CDP. Section three covers a set of 10 Likert-scale items regarding the construct experience with the registration process of the CDP. Section four entails a set of 10 items used to rank the challenges with the CDP according to their seriousness as experienced by contractors. To reduce the respondent's bias, closed-ended questions were preferred for sections 2 to 4 (Akintoye & Main, 2007: 601). The questionnaire was administered to the study sample, along with a consent letter indicating the risks and benefits of participating in the study and that participants are not coerced to participate in the study.
For the collection of qualitative data, a semi-structured interview schedule with seven pre-set questions was used to gain a detailed picture of the focus-group participant's overall satisfaction and challenges experienced with the CDP. Participants' oral responses were digitally recorded, and additional field notes were jotted down on paper.
3.3 Data analysis and interpretation
The Statistical Package for the Social Sciences (SPSS) version 23 was used to conduct descriptive and statistical analysis of the data computing the frequencies, mean scores and standard deviations to measure central tendency (Salkind, 2014: 229; Bless et al., 2013: 33; Field, 2013; Pallant, 2013). The frequencies and percentages of responses were generated and reported, in order to analyse and describe the respondents' profile (Naoum, 2007: 103).
A 5-point interval Likert scale was used to measure how strongly respondents felt regarding the statements in the Likert-scale constructs. Likert-type or frequency scales use fixed choice response formats and are designed to measure attitudes or opinions and even perceptions (Leedy & Ormrod, 2014: 185). Participants rated the items in the constructs satisfaction and experience to measure their level of satisfaction/agreement with the registration process and overall experience of the CDP on a five-point Likert scale. The following scale measurement was used regarding mean scores, where 1 = Totally dissatisfied/Strongly agree (>1.00 and <1.80); 2 = Dissatisfied/Agree (>1.81 and <2.60); 3 = Neutral (>2.61 and <3.40); 4 = Satisfied/Disagree (>3.41 and <4.20), and 5 = Totally satisfied/Strongly disagree (>4.21 and <5.00). For the purposes of this article, overall 'Satisfaction level' was classified in terms of combined mean scores, where Low = mean scores 1 and 2 (>1.00 and <2.32); Medium = mean score 3 (>2.33 and <3.66), and High = mean scores 4 and 5 (>3.67 and <5.00). For the purposes of this article, experience 'Level of agreement' was classified in terms of combined mean scores, where High = mean scores 1 and 2 (>1.00 and <2.32); Moderate = mean score 3 (>2.33 and <3.66), and Low = mean scores 4 and 5 (>3.67 and <5.00). For the purposes of analysis, it is important to note that the scale intervals were equally distributed. To analyse them, descriptive statistics such as means and standard deviations were reported to show the central tendency and to combine the MSs of the entire set of items in the constructs to generate the composite (average) score for the elements.
For the analysis of the internal reliability of the statements in the constructs satisfaction and experience, Cronbach's alpha values were tested (Kolbehdori & Sobhiyah, 2014: 347). Taber (2018: 1279) suggests that the acceptable values of Cronbach's alpha would range from 0.60 to 0.95. In this article, a cut-off value of 0.60 reliability was adopted.
Using thematic data analysis, a nuanced account of the data could be presented by transcribing, coding and setting themes from the responses of the focus-group interviews (Clarke & Braun, 2013: 120). Thematic analysis is a method of identifying, analysing and reporting patterns (themes) within data (Fereday & Muir-Cochrane, 2006: 84). For this article, all discussions during the interviews were recorded and used as the interview data. Using Microsoft Excel (Bowen, Edwards & Cattel, 2012: 523), the raw data on contractor satisfaction was analysed and categorised into conceptual themes as registration, objectives, identification, growth and development, performance, training, and overall experience. For the challenges experienced with CDP, themes were coded as finance, payment, communication, and training. Responses were tabulated.
To analyse the challenges that contractors experience with the CDP, items were ranked from most to least serious, where 1 = affect most and 10 = affect least. The frequencies and percentages were reported.
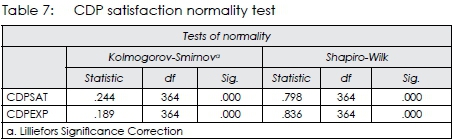
To test if the sample was drawn from a normally distributed population that determines the selection of using parametric/nonparametric test to do correlation analysis, the Shapiro-Wilks and Kolmogorov-Smirnov tests were used (Hain, 2010: 8). These tests (Table 7) compare the observed and expected frequencies of values, in order to assess if the data are taken from a normal distributed population. For this study, the significance level was set at 0.00. This means that, if the p-value for the normality test is higher than 0.00, nonparametric tests should be used for correlation analysis (Ghasemi & Zahediasl, 2012: 486).
For inferential statistics, the nonparametric test, Spearman's rank correlation coefficient (Spearman's rho) was used to establish the degree of association between the level of satisfaction and the level of experience, respectively, with the CDP, tested against variables taken from the profile data of the sample of participating Grades 1 to 3 contractors (Tustin, Ligthelm, Martins & Van Wyk, 2005: 558). Inferential statistics enabled the researchers to investigate the possible association in the variables from data about the population on the grounds of what is observed in the sample (Rodgers & Nicewander, 1988: 63; Terre Blanche, Durrheim & Painter, 2006: 564). In the Spearman's rho test, as the values of the test vary from -1.00 to +1.00, values closer to 1.00 show a strong relationship (Bishara & Hittner, 2012: 399).
3.4 Limitations of the study
The scope of the study was limited to Grades 1 to 3 CIDB-registered (GB Contractors) in the KwaZulu-Natal province of South Africa and cannot be generalised across South Africa.
4. Results and discussion
4.1 Respondent's profile
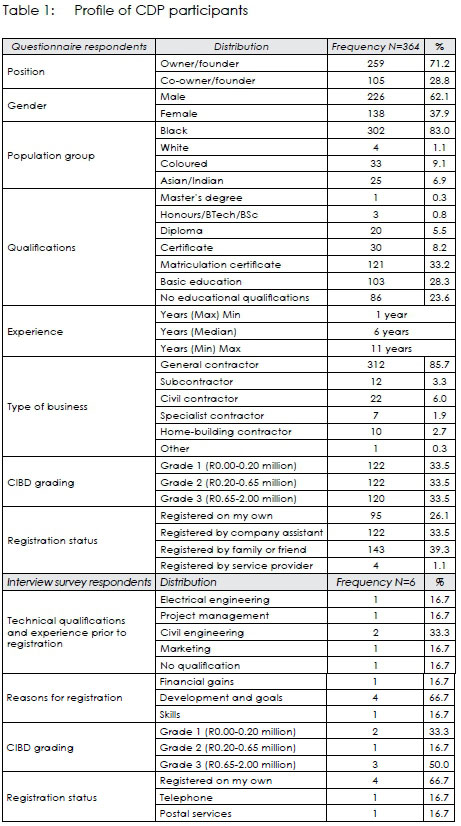
Table 1 presents a summary of the demographic data of the respondents. Based on frequency of occurrence, the majority of the respondents were Black (83.0%) males (62.1%). The vast majority of the respondents, 259 (71.2%) occupied the position of owners, and 105 (28.8%) of the CDP beneficiaries are co-owners of their businesses. Of the respondents, 85.7% are general contractors that have between 1-11 years' experience. Whereas most of the participants (33.2%) had matriculated and 28.3% had some form of basic education, nearly a quarter (23.6%) had no education. Although 66.7% of the interviewees registered on their own, the vast majority (72.8%) of the respondents did not register on the CDP on their own and were either assisted or registered by a family member or a friend (39.3%) or by a company assistant (33.5%).
Respondents were equally distributed in CIDB grading with 33.5% in Grade 1, 33.5% in Grade 2, and 33% in Grade 3 contractors. Of the interview participants, half (50%) were registered as Grade 3, 16.7% as Grade 2, and 33.3% as Grade 1. The majority of the interviewees (66.7%) were registered with the CDP for growth and development of their businesses.
4.2 Satisfaction measurement with overall registration on the CDP
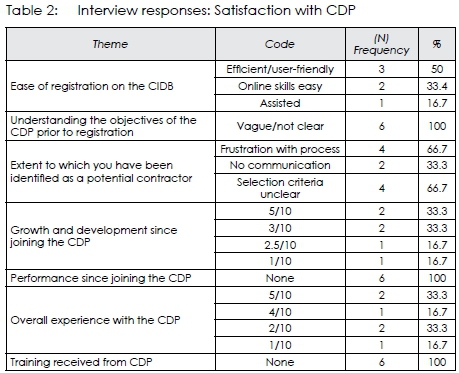
Table 2 shows the interviewees' general views on their overall satisfaction with the CDP.
The responses in Table 2 show that all six interviewees (100%) indicated that, prior to registration, the objectives of the CDP were not clear; they had no improvement in performance since joining the programme, and they received no training from the CDP. Although half of the interviewees find online registration user-friendly, two thirds (66.7%) feel frustrated with the registration process, because the selection criteria is unclear. The majority (66.7%) is not satisfied with their growth, development and overall experience with the CDP and all rated below 5/10.
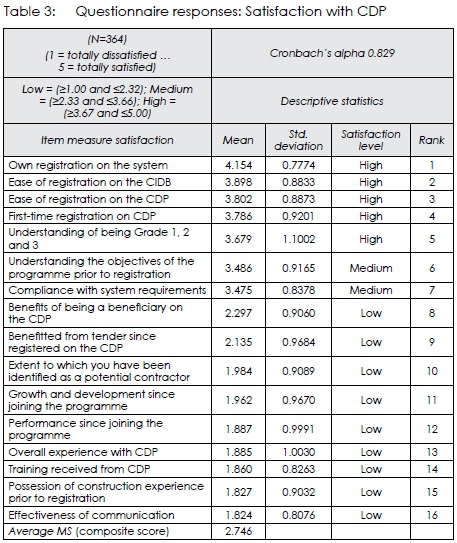
Table 3 ranks the mean scores to show the level of satisfaction with the 16 items rated in the construct 'satisfaction' on satisfaction aspects with the overall process of registration on the CDP as perceived by respondents in practice.
Table 3 indicates a composite score (average MS) of 2.746 for the satisfaction items, indicating that, on the mean evaluation scale, respondents generally have a "medium" level of satisfaction with the overall process of registration on the CDP. The Cronbach's alpha was greater than 0.60 at 0.829, indicating good internal reliability, as recommended by Taber (2018: 1279). The respondents expressed high levels of satisfaction with five items with mean score ratings above >3.67 as: own registration on the system (4.154); ease of registration on the CIDB (3.898) and on the CDP (3.802); first-time registration on CDP (3.786) and understanding of being Grade 1, 2 or 3 (3.679). Showing MS of 3.486 to 3.475, CDP respondents show medium levels of satisfaction in understanding the objectives of the programme prior to registration and the compliance with system requirements. Participants further expressed low levels of satisfaction with the remaining nine items with means ranging from 2.297 to 1.824. It appears that respondents were not satisfied with the benefits of participating in the CDP, including their actual performance, growth and development, training and effectiveness of communication about the programme itself. CIDB (2009) emphasises an open and easy access for registration on the CDP. This study confirmed that registration on the CDP was easy and open to contractors. Contractors indicated overall high satisfaction with system registration. This is indicative of system openness and easiness. Mhulanga (2018) found that performance of contractors in CDPs needed further development. Respondents indicated that their time, cost, quality and health and safety management performances have not improved since they joined the CDP.
4.3 CDP experience
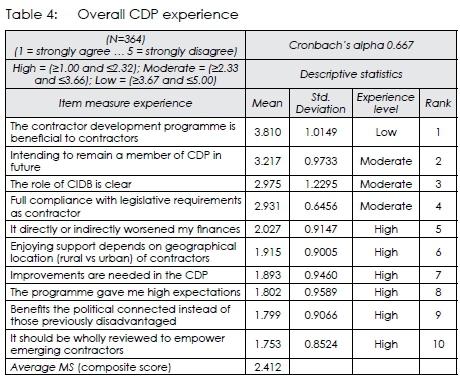
Table 4 ranks the mean scores to show the level of agreement on items in the construct 'experience' that measured the overall experience with the CDP as perceived by respondents in practice.
Table 4 indicates a composite score (average MS) of 2.412 for the experience items, indicating that, on the mean evaluation scale, respondents generally have a "moderate" level of agreement with their overall experience of the CDP. The Cronbach's alpha was greater than 0.60 at 0.667, indicating acceptable internal reliability, as recommended by Taber (2018: 1279). With MS ratings ranging between >2.33 and <3.66, CDP respondents showed moderate levels of agreement in that they intend to remain a member of CDP in future (3.217), that the role of the CIDB is clear to them (2.975) and that contractors fully comply with legislative requirements (2.931). Showing MS of 3.810, CDP respondents did not agree that the CDP benefits them. The respondents expressed high levels of agreement with six items with mean score ratings ranging between >1.00 and <2.32.
This indicates that contractors opined that participating in the CPD affected their financial position by directly or indirectly aggravating their finances (2.027); that their geographical location (rural vs urban) affected the level of support they received (1.915); that the CDP needed improvement (1.893); that the CDP created high expectations that were unfulfilled (1.802); that the CDP benefitted only those with political connections instead of those previously disadvantaged (1.799), and that the entire programme needs to be reviewed to empower emerging contractors (1.753). Findings from this study are consistent with Mahlangu's (2018) study on the effectiveness of a contractor programme in the development of small contractors in the Eastern Cape. The study found that CDPs had been less beneficial to the end users, with beneficiaries expressing that they did not reap the intended benefits of the programme. Mohlala (2015) found that CPDs have not been effective in addressing the challenges experienced by South African emerging contractors. Studies have emphasised that, for an effective and successful CDP, an extensive training approach for contractors must be incorporated in the programme (Thwala, 2009: 31; Croswell & McCutcheon, 2001: 367).
4.4 Challenges experienced with the CDP
Table 5 shows the interviewees' general views on the challenges experienced with the CDP.
The responses in Table 5 show that all six interviewees indicated that poor communication is the most serious challenge they experienced with the CDP. Half of the interviewees find late payments by clients, financial constraints and limited access to funding challenging. Four interviewees find skills shortage challenging and reported that lack of training and development contribute to this challenge.
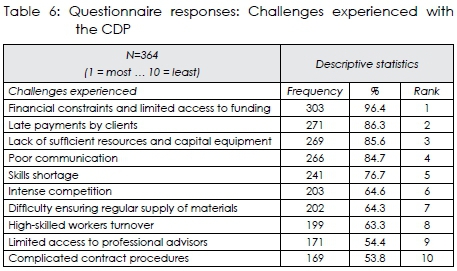
Table 6 ranks the frequency to show the seriousness of the CDP challenges from the highest priority to the lowest as experienced by contractors (respondents) in practice.
The results in Table 6 show that financial constraints and limited access to funding were the top ranked challenges experienced by 94.4% of the respondents. Late payments by clients (86.3%), lack of sufficient resources, capital equipment (85.6%), and poor communication (84.7%) were ranked as serious challenges experienced by over 80% of the respondents. Skills shortage is also one of the major concerns for 76.7% of the contractors. Just over half of the respondents experienced limited access to professional advisors (54.4%) and complicated contract procedures. These findings have been attested to of the interview participants by Merena (2018) in the exploratory study of funds management by emerging contractors. Mashatole (2014), Hove and Banjo (2015) as well as Dapaah and
Musonda (2014) identified that the majority of the small contractors in CDP experienced challenges such as limited access to funding such as bank loans, lack of proper communication, shortage of supply of competent staff, inability to obtain regular supply of plant and material, lack of sufficient resources for project execution, and late payments by clients which leads to project delays.
4.5 Inferential statistics
4.5.1 Normality of data
Table 7 shows the significance test results to assess if the sample was drawn from a normally distributed population that determines the choice of parametric/nonparametric test to do correlation analysis.
In Table 7, the Kolmogorov-Smirnov test results show that, with significance (p-value) levels of over 0.00 for satisfaction (0.244) and experience (0.189), the data is not normally distributed. The Shapiro-Wilk test results also show p-values greater than 0.00 for satisfaction (0.798) and experience (0.836). This means that the sample is not coming from a normally distributed population. Therefore, a non-parametric test should be used to analyse correlation between the constructs (Neideen & Brasel, 2007: 94).
4.5.2 Correlation analysis
Table 8 shows the non-parametric test, Spearman's correlation coefficients, that determine the relationship between 364 values in the constructs 'Satisfaction' and 'Experience'.
Results in Table 8 show that, although not significant, there is a strong positive relationship between the two constructs 'satisfaction' and 'experience' (rs = 0.190, p = 0.000). Significant is that there is a strong negative correlation between registration on the CDP and 'satisfaction' (rs = -0.254, p = 0.000). Very significant is that there is a strong negative correlation between registration on the CDP and 'experience' (rs = -0.154, p = 0.030).
There is a strong positive relationship (rs = 0.173) between population growth and registration on the CDP (p = 0.010). This result shows that contractors were not satisfied with their experiences at the CDPs as a result of the open registration created for all population groups.
5. Conclusion
Appropriate literature elicited a range of structured questions used to obtain quantitative and qualitative data from the survey and interview participants. Analysis of the results from the surveys determined how satisfied contractors were with their experience of the CDP. The research results show that contractors are not satisfied with their performance, growth and development since they joined the programme. The CDP offers no training opportunities to registered members and lacks effective communication mediums. Contractors did not agree with the general belief that it was beneficial to them to participate in the CDP. Participating contractors felt that the CDP affected their financial position, due to late payments. Their geographical location affected the level of support they received, and the CDP benefited only those with political connections. The CDP created expectations that were unfulfilled. The CDP, therefore, needs to be improved and the entire programme needs to be reviewed to ensure that the target group, namely emerging contractors, are adequately supported and empowered. The correlation results show that there is a strong relation between population and registering on the CDP. The open and easy access when registering on the CDP allows any interested person to automatically become a contractor, thus creating the possibility of abuse of the programme. Without clear criteria to include only the intended beneficiaries, namely previously disadvantaged, and filter out the opportunistic contractors, it would be difficult for the programme to realise its objectives. Therefore, findings indicate that open or easy access by all interested parties to participate in CDPs is counter-productive with unintended consequences.
These findings are imperative for the improvement of the CDP to achieve its goals. The study simply revealed that, in its current form, the programme is working against its own objectives. There is a need to reform and improve the programme so that it can benefit deserving contractors, and ultimately achieve its objectives.
The success of the CDP should not depend on the number of tenders given out to contractors, but rather on the development, growth and improved prospects for business sustainability. This changed focus should target graduating public sector contractors to different grades on the CIDB Register of Contractors, and ultimately unlock growth constraints, develop sustainable contracting capacity, and elevate the enterprise development of previously disadvantaged contractors.
6. Further recommendations
The study highlighted researchable areas in view of addressing numerous gaps in the CDP. More studies should be conducted to expand on this study, with particular focus on registration aspects that appear to allow the influx of contractors, thus stressing the capacity to cater for the needy contractors. Moreover, similar studies are required to focus on longitudinal analysis of the effectiveness of CDP covering a broader scope.
References
Aiyetan, A., Smallwood, J. & Shakantu, W. 2011. A systems thinking approach to eliminate delays on building construction projects in South Africa. Acta Structilia, 18(2), pp. 19-39. [ Links ]
Akintoye, A. & Main, J. 2007. Collaborative relationships in construction: The UK contractor's perception. Engineering, Construction and Architectural Management, 14(6), pp. 597-617. https://doi.org/10.1108/09699980710829049 [ Links ]
Alvi, M.H. 2016. A manual for selecting sampling techniques in research. Munich Personal RePEc Archive (MPRA) Paper No. 70218, pp. 1-55. [ Links ]
Bernard, H.R. 2011. Research methods in anthropology, qualitative and quantitative approaches. 5th edition. Plymouth, UK: AltaMira Press. [ Links ]
Bishara, A.J. & Hittner, J.B. 2012. Testing the significance of a correlation with non-normal data: Comparison of Pearson, Spearman, transformation, and resampling approaches. Psychological Methods, 17(3), pp. 399-417. https://doi.org/10.1037/a0028087 [ Links ]
Bhorat, H., Murray, L., Muzi, M., Servaas, V. & Ingrid, W. 2001. Fighting poverty: Labour markets and inequality in South Africa. Cape Town: UCT Press. [ Links ]
Bless, C., Higson-Smith, C. & Sithole, S.L. 2013. Fundamentals in social research methods: An African perspective. 5th edition. Cape Town: Juta & Company Ltd. [ Links ]
Bowen, P., Edwards, P. & Cattell, K. 2012. Corruption in the South African construction industry: A mixed methods study. Proceedings of the 28th Annual ARCOM Conference, 3-5 September 2012, Edinburgh, UK, Association of Researchers in Construction Management, pp. 521-531. [ Links ]
Chadhliwa, T.Q. 2015. Challenges facing small and medium enterprise contractors in delivering grade R classrooms for the Western Cape Department of Transport and Public Works. Unpublished dissertation, University of Stellenbosch. [ Links ]
CIDB (Construction Industry Development Board). 2009. Status quo report: SA Contractor Development Programmes. [Online]. Available at: <idb.org.za/publications/Documents/ind_reps_sa_contractor_development_programmes.pdf.> [Accessed: 12 March 2017]. [ Links ]
CIDB (Construction Industry Development Board). 2011. Guidelines for implementing Contractor Development Programmes. Pretoria: CIDB. [Online]. Available at: <http://www.cidb.org.za/publications/Documents/Guidelines%20for%20Implementing%20Contractor%20Development%20Programmes.pdf> [Accessed: 12 March 2017]. [ Links ]
CIDB (Construction Industry Development Board). 2014. Study of Grade 1 Contractors: SA Contractor Development Programmes. [Online]. Available at: <http://www.cidb.org.za/publications/Documents/Study%20of%20Grade%201%20Contractors%20Report.pdf> [Accessed: 12 March 2017]. [ Links ]
Clarke, V. & Braun, V. 2013. Teaching thematic analysis: Overcoming challenges and developing strategies for effective learning. The Psychologist, 26(2), pp. 120-123. [ Links ]
Creswell, J.W. & Plano-Clark, V.L. 2007. Designing and conducting mixed methods research. Thousand Oaks, CA: Sage Publications. [ Links ]
Croswell, C. & McCutcheon, R.T. 2001. Small contractor development and employment - A brief survey of sub-Saharan experience in relation to civil construction. First International Conference on Employment Creation in Development, University of the Witwatersrand, Johannesburg, South Africa. https://doi.org/10.1007/s12132-001-0012-8 [ Links ]
Dapaah, A. & Musonda, I. 2014. Perceptions of contractor development programmes in some developing countries. International Journal of Emerging Technology and Advanced Engineering, 4(10), pp. 622-628. [ Links ]
Du Plooy, G. 2009. Communication research: Techniques, methods and applications. Cape Town: Juta Legal and Academic Publishers. [ Links ]
ECDP (Emerging Contractor Development Programme). 2005. Emerging Contractor Development Programme Evaluation Report. Department of Public Works. Pretoria: Government Printer. [ Links ]
Fereday, J. & Muir-Cochrane, E. 2006. Demonstrating rigor using thematic analysis: A hybrid approach of inductive and deductive coding and theme development. International Journal of Qualitative Methods, 5(1), pp. 80-92. https://doi.org/10.1177/160940690600500107 [ Links ]
Field, A. 2013. Discovering statistics using IBM SPSS statistics. 4th edition. Thousand Oaks, CA: Sage Publications. [ Links ]
Ghasemi, A. & Zahediasl, S. 2012. Normality tests for statistical analysis: A guide for non-statisticians. International Journal of Endocrinology and Metabolism, 10(2), pp. 486-489. https://doi.org/10.5812/ijem.3505 [ Links ]
Govender, J.N. & Watermeyer, R.B. 2000. Potential procurement strategies for construction industry development in the SADC region. Unpublished paper, Department of Public Works, Pretoria. [ Links ]
Grbich, C. 2013. Qualitative data analysis: An introduction. City Road, London: Sage Publications. [ Links ]
Greve, N. 2014. CIDB Grade 1 offers 'no barrier' to industry entry, needs rehaul. Creamer's Engineering News, 8 April 2014. [Online]. Available at: <http://www.engineeringnews.co.za/article/cidb-grade-1-offers-no-barrier-to-industry-entry-needs-rehaul-2014-04-08> [Accessed: 12 March 2017]. [ Links ]
Hadebe, W.A. 2017. Effectiveness of contractor development programme in KwaZulu-Natal. Unpublished thesis (MSc). Durban: University of KwaZulu-Natal. [ Links ]
Hain, J. 2010. Comparison of common tests for normality. Unpublished thesis (PhD). Würzburg: Julius-Maximilians-Universität Würzburg. [ Links ]
Heyns, G. & Luke, R. 2012. Skills requirements in the supply chain industry in South Africa. Journal of Transport and Supply Chain Management, 6(1), pp. 107-125. https://doi.org/10.4102/jtscm.v6i1.34 [ Links ]
Hove, G. & Banjo, A. 2015. Performance in the construction industry: A conceptual and theoretical analysis. Open Journal of Business and Management, vol. 3, pp. 177-184. https://doi.org/10.4236/ojbm.2015.32017 [ Links ]
Kolbehdori, S. & Sobhiyah, M.H. 2014. Effect of negotiations about the formation of construction consortium on consortium successful performance in Iran's construction industry. International Journal of Management, Accounting and Economy, 1(5), pp. 346-349. [ Links ]
Leedy, P.D. & Ormrod, J.E. 2014. Practical research: Planning and design. 10th edition. Boston, NY: Pearson. [ Links ]
Mahembe, E., Chiumya, C. & Mbewe, M. 2011. Literature review on small and medium enterprises' access to credit and support in South Africa. Prepared for: National Creditor Regulator, Underhill Corporate Solutions. [ Links ]
Mashatole, S. 2014. Constraints faced by small contractors in the Gauteng province of South Africa. In: Mokrys, M., Badura, S. & Lieskovsky, A. (Eds). Proceedings of the Conference of Informatics and Management Sciences, 24-28 March 2014, Zilina, Slovak Republic. Zilina: EDIS Publishing Institution of the University of Zilina, pp. 57-68. [ Links ]
Maswanganyi, N. 2013. Red tape, skills shortage top concerns for South African business. Business live. [Online]. 13 May. Available at: <https://www.businesslive.co.za/archive/2013-05-13-red-tape-skills-shortage-top-concerns-for-south-african-business/> [Accessed: 13 March 2017]. [ Links ]
Mbande, C. 2010. Overcoming construction constraints through infrastructure delivery. In: Proceedings of the Association of Schools of Construction of Southern Africa (ASOCSA), Fifth Built Environment Conference. Durban, South Africa, 18-20 July 2010. Bellville: ASOCSA, pp. 213-232. [ Links ]
Merena, A.A. 2018. An exploration of funds management by emerging contractors. Unpublished thesis (Master of Building Science). Durban: Durban University of Technology. [ Links ]
Mhulanga, I.N. 2018. The effectiveness of a contractor development programme in the development of small contractors - An evaluation of a road construction project in the Eastern Cape. Unpublished thesis (MEng). Johannesburg: University of the Witwatersrand. [ Links ]
Moyo, A. & Crafford, G.J. 2010. The impact of hyperinflation on Zimbabwean construction industry. Acta Structilia, 17(2), pp. 53-83. [ Links ]
Mgqongisa, M. 2018. Impact of structured training programme on emerging contractors within the Western Cape province in South Africa. Unpublished dissertation (MTech). Cape Town: Cape Peninsula University of Technology. [ Links ]
Neideen, T. & Brasel, K. 2007. Understanding statistical tests. Journal of Surgical Education, 64(2), pp. 93-96. https://doi.org/10.1016/'.jsurg.2007.02.001 [ Links ]
Naoum, S. 2007. Dissertation research and writing for construction students. London: Routledge, Taylor & Francis. [ Links ]
Ntuli, B. & Allopi, D. 2013. Capacity challenges facing civil engineering contractors in KwaZulu-Natal, South Africa. International Journal of Engineering and Innovative Technology, 2(110), pp. 90-97. [ Links ]
Ofori, G. 2007. Construction in developing countries. Construction Management and Economics, 25(1), pp. 1-6. https://doi.org/10.1080/01446190601114134 [ Links ]
Pallant, J. 2013. SPSS, Survival manual: A step-by-step guide to data analysis using IBM, SPSS. 5th edition. London: Allen & Unwin. [ Links ]
Provincial Treasury. 2008. Western Cape Provincial Economic Review & Outlook 2008. Cape Town: Government Printers. [Online]. Available at: <https://www.westerncape.gov.za/text/2009/2/per_o_2008.pdf.> [Accessed: 13 March 2017]. [ Links ]
Public Works. 2012. Annual Report: South African Department of Public Works, 2012/2013. [Online]. Available at: <https://www.gov.za/sites/default/files/gcis_document/201409/public-works-ar-2013a.pdf> [Accessed: 12 June 2017]. [ Links ]
Rodgers, J.L. & Nicewander, W.A. 1988. Thirteen ways to look at the correlation coefficient. The American Statistician, 42(1), pp. 59-66. https://doi.org/10.1080/00031305.1988.10475524 [ Links ]
Salkind, N.J. 2014. Exploring research. 8th edition. USA, Edinburgh Gate: Harlow. [ Links ]
South African Reserve Bank. 2017. Quarterly Bulletin. Pretoria: South African Reserve Bank. [ Links ]
Statistics South Africa. 2016. Gross domestic product, second quarter. Pretoria: Government Printer. [ Links ]
Taber, K.S. 2018. The use of Cronbach's Alpha when developing and reporting research instruments in science education. Research in Science Education, 48(6), pp. 1273-1296. https://doi.org/10.1007/s11165-016-9602-2 [ Links ]
Terre Blanche, M., Durrheim, K. & Painter, D. (Eds). 2006. Research in practice: Applied methods for social sciences. 2nd edition. Cape Town: UCT Press. [ Links ]
Thwala, W.D. 2009. A critical evaluation of pre- and post-1994 large-scale development programmes in South Africa, with particular focus on employment creation. Unpublished thesis (PhD Philosophy in Engineering). Johannesburg: University of the Witwatersrand. [ Links ]
Thwala, W.D. & Mofokeng, G. 2012. An exploratory study of problems facing small and medium-sized contractors in the Free State province of South Africa. In: Quah, D.H. (Ed.). Business dynamics in the 21st century. Rijeka, Croatia: InTech, pp.143-154. [ Links ]
Tshetu, T.N. 2014. An analysis of Black Economic Empowerment (BBE)-owned companies' success stories. Unpublished MBA dissertation. Gordon Institute of Business, University of Pretoria. [ Links ]
Tustin, D.H., Ligthelm, A.A., Martins, J.H. & Van Wyk, H.J. 2005. Marketing research in practice. Pretoria: Unisa Press. [ Links ]
Watermeyer, R.B., Gounden, S., Letchmiah, D.R. & Shezi, S. 1998. Targeted procurement: A means by which socio-economic objectives can be realised through engineering and construction works contracts. Journal South African Institute of Civil Engineering, 40(4), pp. 15-25. [ Links ]
Windapo, A. & Cattel, K. 2013. The South African construction industry: Perceptions of key challenges facing its performance, development and growth. Journal of Construction in Developing Countries, 18(2), pp. 65-79. [ Links ]
Peer reviewed and revised April 2019
Published December 2019
* The authors declared no conflict of interest for the article or title

