Services on Demand
Article
Indicators
Related links
-
 Cited by Google
 -
 Similars in Google
Share
Acta Structilia
On-line version ISSN 2415-0487
Print version ISSN 1023-0564
Acta structilia (Online) vol.25 n.2 Bloemfontein 2018
http://dx.doi.org/10.18820/24150487/as25i2.1
RESEARCH ARTICLES
Adoption of Building Information Modelling in the construction industry in Kenya
Mutonyi NasilaI; Chris CloeteII
IDepartment of Construction Economics, University of Pretoria, Private Bag X20, Hatfield, Pretoria, South Africa. Beglin Woods Architects, Kenya, PO Box 22759, Nairobi. Phone: +254 723 872 479, email: <nasilamutonyi@gmail.com>
IISACSC Chair in Shopping Centre Studies, Department of Construction Economics, University of Pretoria, Private Bag X20, Hatfield, Pretoria, South Africa. Phone: +27 795192717, email: <chris.cloete@up.ac.za> ORCID: 0000-0002-0800-1679
ABSTRACT
The current implementation of Building Information Modelling (BIM) by construction professionals in the Kenyan construction industry is an area of concern. BIM is increasingly being applied worldwide to improve communication between project stakeholders, visualization of design, detect potential clashes, reduced redesign during project implementation, improve design quality, reduce costs, and improve the rate of return for projects. However, the application of BIM in the Kenyan construction industry is still lagging, resulting in poor co-ordination of information among construction project stakeholders. This study determines the current state of BIM application, the benefits of BIM application and the BIM application barriers in Kenya. A quantitative research approach was used and data was collected, using an online questionnaire survey from 310 registered construction professionals selected by stratified sampling. The benefits and barriers factors that influence BIM application in Kenya were rated and set as the independent variables with 'years of experience' and 'total completed projects' as the dependent variables. The data was analysed using the Statistical Package for the Social Sciences (SPSS) version 24. Principal components analysis (PCA) was used to extract the main factors for benefits and barriers of BIM implementation. Chi-square tests were used to determine relationships between independent and dependent variables. Improved communication was ranked as the most important BIM benefit, while the high cost of buying and updating software was ranked as the main barrier to the application of BIM. Based on the results of the study, improved design quality is influenced by the number of years of experience one has in the building construction industry. The number of projects undertaken by a company using BIM in any capacity has an influence on greater productivity, due to easy retrieval of information. It is recommended that BIM training should be undertaken by software vendors in vocational and tertiary institutions as well as in construction firms. In addition, the government should formulate policies and standards to support the use of BIM. This study adds to the body of knowledge about BIM application in Nairobi, Kenya that is beneficial to developers, architects, engineers, quantity surveyors, project managers, contractors, and facility managers.
Keywords: Building information modelling (BIM), BIM adoption, Kenyan construction sector
ABSTRAK
Die huidige toepassing van Bou-Inligting Modellering (BIM) deur professionele konsultante in die konstruksiebedryf in Kenia is 'n bron van kommer. BIM word toenemend wêreldwyd toegepas om kommunikasie tussen projekbelanghebbendes te verbeter, ontwerpe te visualiseer, potensiële botsings te identifiseer, herontwerp tydens projekimplementering te verminder, ontwerpkwaliteit te verbeter, koste te verminder en die opbrengskoers van projekte te verhoog. Die stadige aanvaarding van BIM in die konstruksiebedryf in Kenia het swak koördinasie van inligting tussen betrokkenes in konstruksie-projekte tot gevolg. Hierdie studie ondersoek die huidige stand van BIM-toepassing, voordele van BIM-toepassing en BIM-toepassinghindernisse in Kenia. 'n Kwantitatiewe navorsingsbenadering is gebruik en data is ingesamel, met behulp van 'n aanlyn-vraelysopname van 310 geregistreerde konstruksie-werknemers wat gekies is deur gestratifiseerde steekproefneming. Die voordele en hindernisse wat BIM-toepassing in Kenia beïnvloed, is gemeet en gestel as die onafhanklike veranderlikes met 'jare ondervinding' en 'totale voltooide projekte' as die afhanklike veranderlikes. Die data is geanaliseer met behulp van die Statistiese Pakket vir die Sosiale Wetenskappe (SPSS) weergawe 24. Principal component analysis (PCA) is gebruik om die beangrikste faktore vir voordele en hindernisse van BIM-implementering te bepaal. Chi-square toetse is gebruik om verhoudings tussen onafhanklike en afhanklike veranderlikes te bepaal. Verbeterde kommunikasie is as die belangrikste voordeel van BIM beskou, terwyl die hoë koste van die aankoop en opdatering van sagteware as die belangrikste hindernisse tot BIM-toepassing beskou is. Volgens bevindinge word die verbeterde ontwerpkwaliteit beïnvloed deur die aantal jare ondervinding in die boukonstruksiebedryf. Die aantal projekte wat deur 'n maatskappy onderneem word met BIM in enige hoedanigheid beïnvloed groter produktiwiteit as gevolg van maklike herwinning van inligting. Daar word aanbeveel dat BIM-opleiding deur sagtewareleweransiers onderneem word in beroeps- en tersiêre instellings en konstruksiemaatskappye. Daarbenewens moet die regering beleide en standaarde formuleer om die gebruik van BIM te ondersteun. Die studie dra by tot die korpus van kennis oor die toepassing van BIM in Nairobi, Kenia, en behoort van waarde te wees vir ontwikkelaars, argitekte, ingenieurs, bourekenaars, projekbestuurders, kontrakteurs, en fasiliteitsbestuurders.
Sleutelwoorde: Bou-Inligtingsmodellering (BIM), aanvaarding van BIM, Keniaanse konstruksiebedryf
1. Introduction
The construction sector is one of the key drivers of economic growth in Kenya, accounting for 7% of the gross national product (Turner & Townsend, 2017). Despite its critical role in the Kenyan economy, the construction sector is faced with various challenges that have decreased the productivity and the rate of return on investments. Among the most important challenges is the poor collaboration of information among stakeholders. This has led to increased wastage, cost overruns, rework, time overruns, and miscommunication among project stakeholders (Balah & Akut, 2015: 60). The old-fashioned two-dimensional (2D) approach to execute projects in the built environment industry impedes the efficient exchange of data among all stakeholders which occurs in all stages of the project development, namely from concept to construction and eventually to the management of the facility that is in operation (Rohena, 2011). The introduction of Building Information Modelling (BIM) in the construction industry brought about new ways of conceiving, designing, constructing, and operating new buildings (Azhar, Khalfan & Jaqsood, 2012: 15).
BIM is extensively used worldwide to design a visual presentation of the building process used to enhance the exchange of information among construction professionals (architects, engineers, quantity surveyors, and project managers) in digital format (Eastman, Teicholtz, Sacks & Sacks, 2008; Silva, Salvado, Couto & Vale e Azevedo, 2016: 476). Martínez-Rojas, Durán-Álvarez, Martínez-Aires & López-Alonso (2015) emphasize three major types of digital data involved in BIM: the three-dimensional modelling of a building (geometric), a description of the properties of the components (semantic), and details of the interrelationships between properties and components (topological).
Appropriate application of BIM by construction professionals (architects, engineers, project managers, and facility managers) allows for benefits relating to five main aspects, namely design, scheduling, documentation, budgeting, and communication (Azhar et al., 2012). However, application of BIM is also subject to several obstacles, including (in order of importance) the high cost of execution, lack of awareness about the utilization of BIM, absence of government support for its application, absence of training facilities, deficient research and innovation, and absence of laws and policies mandating its use (Adebimpe & Etiene, 2016: 232).
BIM is a relatively new concept in Kenya and the adoption and implementation thereof is slow, because Kenya has different regulation bodies for the different sections of the building industry. These professionals' bodies are the Board of Registration of Architects and Quantity Surveyors (BORAQS), the Engineers' Board of Kenya (EBK), and the Institute of Construction Project Managers in Kenya (ICPMK). The anticipated audience for BIM is, therefore, fragmented and lacking a united focus to adopt and implement BIM in large-scale and complex building projects (Njue & Musyimi, 2017: 86).
Communication failures between the design and construction teams, due to fragmented information, is an area of concern and highlights the need to determine the views of these professionals on the status of implementation of BIM in the Kenyan construction industry, as well as its benefits and impediments to its implementation.
2. Literature review
2.1 Building information modelling concept
Every single developing meaning of BIM depicts its transformative abilities and effect on the Architecture, Engineering, and Construction (AEC) industry and, very recently, on facility management (Kassem, Iqbal, Kelly et al., 2014: 127). BIM is not a new idea; early investigations were done on BIM since the 1970s. For instance, the use of personal computers (PCs) as opposed to representations in building design was contemplated as early as 1970 (Matarneh & Hamed, 2017b: 326). Eastman, Teicholz, Sacks and Liston (2011) considered BIM as "...the key medium to plan critical thinking, coordination and for correspondence". Since then, several studies have been carried out on the application of integrated computer technologies in design and construction management (Matarneh & Hamed, 2017b: 327).
Eastman et al. (2008) note that, due to BIM innovation, a precise virtual model of a building is developed carefully and, once finalized, the computer-produced model contains the exact geometry and important information expected to help in the design, manufacture, and procurement of an actual building. BIM is not only a technology, but also a process. The technology part of BIM enables stakeholders to picture at an early stage any opportunities in the design, construction or functional issues, while the process segment allows for close cooperation and integration of roles played by all members of the design and construction team (Azhar et al., 2012).
The BIM concept is based primarily on the reconciliation of procedures, upheld by an information-rich 3D display that permits one to clearly follow the entire life cycle of the project (Sampaio, 2017: 195). In addition, all factors considered, it is expected that the entire procedure is more direct and simpler in exchange of data among all stakeholders, in developing the design, and later in the administration of the building. The collaborative feature in BIM plays a vital role in all aspects of construction and project management, including design, scheduling, estimating, resource allocation, supply chain management, an account of deliverables during construction, and structural management (Bhuskade, 2015: 834; Kushwaha, 2016: 102). The ability of BIM to do parametric design and store data about the life cycle of buildings can be used to investigate and regulate energy consumption, initial costs, ongoing costs in a building, as well as the implementation of other sustainable design principles in the construction industry (Anbouhi, Farahza & Ayatollahi, 2016: 99).
Silva et al. (2016) provide a summary of the implementation of BIM in various countries (see also Khosrowshahi & Arayici, 2012; Hadzaman, Takim & Nawawi, 2015; Enshassi & AbUHamra, 2017; Telaga, 2018; Ahuja et al., 2018).
2.1.1 Levels of Building Information Modelling maturity
The essence of categorising BIM into maturity levels from 0 to 3 is to substantiate the types of technical and collaborative working involved at each level and give a comprehensive explanation of the processes, tools, and techniques used (CDBB, 2011: 15-16). The United Kingdom adopted a unique system that describes the credentials of the designers and the design teams by assessing the BIM process applied against a diagram that outlines the four levels of BIM process maturity (Sacks, Gurevich & Shrestha, 2016: 491). The four levels include:
• 0 - CAD: Basic CAD features using only drawings, lines, arcs and text. Unmanaged CAD probably 2D, with paper (or electronic paper) as the most likely data exchange mechanism;
• 1 - 'Lonely BIM': Includes some basic 3D elements, beginning of BIM;
• 2 - 'Collaborative BIM': Includes the required information, supply chain management, and requires teams to be working together with 3D BIM, however with no obligation for the 4D programme, 5D cost and operation elements to be included within the model, and
• 3 - 'Intelligent BIM': Full integration of the BIM model into the life cycle management of the project.
2.2 Awareness level of Building Information Modelling
Adebimpe and Etiene (2016: 233) as well as Kugbeadjor, Suresh and Renukappa (2015: 540) emphasise that expanding awareness on BIM utilization and its advantages is the first and most vital stride to its implementation, to be done through government intervention, training, and retraining of building sector experts and association of the different expert bodies in the building industry. Although education and training assume a major part in the BIM appropriation process, a noteworthy number of associations are hesitant to invest in BIM, principally because of the cost involved (Kugbeadjor et al., 2015: 533).
Adebimpe and Etiene (2016: 233) caution that expanded awareness in the application of BIM ought to be done by utilising reasonable means and by considering the unique nature of the national construction industry. Important professional bodies, agencies and associations, working together, ought to advise the legislature on the advantages of implementing BIM.
The following recommendations may be made on increasing the awareness of BIM in the construction industry (Matarneh & Hamed, 2017b: 333):
• Government should set standards and codes for BIM industry;
• Proper and open standards have a noteworthy part to play in the achievement of BIM as a development factor. There is a requirement for all-encompassing co-appointment among the business' partners, including the administration, business, BIM vendors, customers, and instructional associations;
• To address the deficiency of BIM professionals, the industry and scholastic foundations should come together to create syllabuses that are in accordance with improvements in industry practice and techniques, and
• To establish a framework within each firm to guarantee that the professionals hold, really apply and likewise share the information picked up from such BIM projects.
2.3 Application of Building Information Modelling
BIM offers a variety of applications in the construction industry (Shaikh, Raju, Malim, & Jayaraj, 2016: 206). Three-dimensional modelling and rendering can be produced, design drawings and shop drawings can be generated, and construction standards can be reviewed by examining object parameters, while cost estimates and construction schedules can be applied in renovations, maintenance, and operations to make facility management more efficient (Sarkar & Modi, 2015: 54). In addition, various examinations and simulations can be carried out on the model to enhance the overall performance of any project (Azhar, Nadeem, Mok & Leung, 2008). In summary, BIM projects facilitate efficient administration of construction projects and can be applied in all construction project stages: pre-construction stage, construction stage and post-construction stage (Latiffi, Mohammed, Kasim & Fathi, 2013: 3).
2.3.1 Pre-construction stage
The use of BIM during the pre-construction stage is more visible than during the construction and post-construction stages, considering the executions associated with this stage, for example, design, scheduling and estimating (Latiffi et al., 2013: 3). Sarkar and Modi (2015: 55) conclude that BIM can be applied in the pre-construction phase for conceptual design, sketching, space planning, site inventory, and guaranteeing programme consistency with respect to site-related variables.
2.3.2 Construction stage
Yamazaki, Tabuchi, Kataoka and Shimazaki (2014) note that challenges in the construction procedure are quickly comprehended and tackled by reviewing forms generated by BIM during the construction phase. In addition to creative engineering and enhanced construction innovations, basic investigation in the construction procedure, mechanized crash checking innovation, continuous construction simulation, and 3D estimation innovation are keys to productively utilizing BIM during construction (Yamazaki et al., 2014).
2.3.3 Post-construction stage
In the post-construction stage, BIM keeps track of built asset, manages facilities proactively, enables scheduled maintenance, and provides a review of maintenance history (Latiffi et al., 2013: 3). Sarkar and Modi (2015: 55) emphasise that, in this stage, BIM allows facility management to be implemented in relation to renovations, maintenance, operation, cost estimation by investigating the quantities of materials, and construction sequencing to make scheduling more consistent.
2.4 Benefits of using Building Information Modelling
Application of BIM in the construction industry can help overcome most of the challenges encountered in the process of design and construction relating to the exchange of data between members of the project team. Latiffi et al. (2013: 4) emphasise that the benefits of implementing BIM in construction projects are related to five main aspects: design, scheduling, documentation, budget, and communication.
Generally, BIM technology allows for efficient collaboration of project stakeholders by allowing changes done by members of the design team to be updated in real-time and shared to all project stakeholders (Doumbouya, Gao & Guan, 2016). BIM has the capacity to minimize rework, design errors, omissions, design conflicts, and changes during construction processes (Matarneh & Hamed, 2017b: 332).
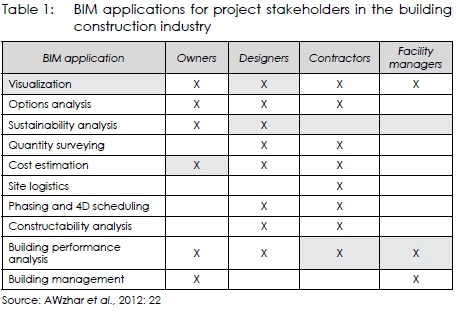
Table 1 illustrates BIM applications for all stakeholders in the building construction industry.
In summary, the benefits of adopting BIM and using BIM technology on projects in the construction industry are:
• Reduce rework during construction;
• Maximize productivity;
• Reduce conflict/changes;
• Clash detection;
• Enhance collaboration and communication;
• Improve visualization;
• Improve project documentation;
• Enhance design review;
• Faster and more effective method;
• Improve quality;
• Reduced construction time;
• Reduce contingencies, and
• Reduce construction cost (Azhar et al., 2012: 22; Adebimpe & Etiene, 2016: 233; Matarneh & Hamed, 2017b: 332; Chan, 2014: 31; Gerges, Austin, Mayouf et al., 2017: 7; Shaikh et al., 2016: 207; Eastman et al., 2008; Silva et al., 2016: 479).
2.5 Barriers to the implementation of Building Information Modelling
The implementation of any innovation technology is confronted with difficulties prior to full implementation (Matarneh & Hamed, 2017a: 189). Like any other innovative technology, several obstacles hamper the implementation of BIM in the building construction industry. Azhar et al. (2012: 25) classify BIM application-related challenges in two broad categories: technology-related challenges and process-related challenges. The following are some of the key technology-and process-related challenges encountered in BIM adoption in the building construction industry:
• Lack of support and incentives from construction policymakers to professionals and experts using BIM;
• Lack of standards and codes for BIM application;
• Lack of awareness about BIM, resulting in professionals comparing BIM to CAD;
• Lack of client demand;
• Lack of a BIM specialist in the region and majority of nonexpert staff in architectural firms;
• High costs (software, hardware upgrade, training, and time);
• BIM requires radical changes in workflow, practices, and procedures and, therefore, resistance to change from design and construction firms;
• Too many legal barriers;
• Lacking due to exchange and interoperability;
• Inadequate BIM application research and development;
• Lack of IT infrastructure to successfully implement BIM, and
• Professionals in the industry entrenched in the current 2D drafting practices and the steep learning curve to develop BIM expertise (Adebimpe & Etiene, 2016: 233; Matarneh & Hamed, 2017a: 189; Chan, 2014: 32; Gerges et al., 2017: 9; Shaikh et al., 2016: 207; Eastman et al., 2008; Silva et al., 2016: 479).
The review of the literature on BIM revealed that application of BIM in the construction industry helps overcome most of the challenges encountered in the process of design and construction relating to exchanging data between members of the project team (project owners, designers, contractors, and facility managers). The benefits of implementing BIM in construction projects relate to five main aspects: design, scheduling, documentation, budget, and communication (Azhar et al., 2012; Latiffi et al., 2013: 4).
Despite these benefits, the application of BIM encounters a number of obstacles, including, in order of importance, the high cost of execution; lack of awareness on the utilization of BIM; absence of government support for its application; absence of training facilities to promote its utilization; deficient research and innovation, and absence of laws and policies mandating its utilization (Adebimpe & Etiene, 2016: 232). These barriers have contributed to the low level of BIM application and awareness in the construction industry (Matarneh & Hamed, 2017a: 189; Balah & Akut, 2015).
3. Research
The purpose of the research was to determine the current status of implementation of BIM in the Kenyan construction industry, as well as its benefits and impediments to its implementation. A quantitative research design was adopted. This type of design allows for the use of structured questionnaire surveys, enabling researchers to generalise their findings from a sample of a population (Creswell, 2003: 5). In the questionnaire, two constructs (benefits [consisting of 25 measurements] and barriers [consisting of 16 measurements]) were extracted and set respectively as the variables for the benefits and barriers of BIM application in the Kenyan construction industry (Netemeyer, Bearden & Sharma, 2003). Exploratory factor analysis (EFA) was used to assess these measured variables in terms of their validity and reliability. EFA is a technique that analyses the characteristics of each of the defined BIM benefits and barriers (original variables), in order to reduce it to a common score (smaller number of factors), by examining relationships among these quantitative factors (Pallant, 2013: 192; Yong & Pearce, 2013: 80; Rossoni, Engelbert & Bellegard, 2016: 200). Several factor analysis methods are available, but principle component analysis (PCA) was used, because the Eigenvalues could be extracted, which explains whether the factors tested had or had not a noticeable effect on people's responses to the variables in the original test (analysed construct) (Rossoni et al., 2016: 201; Yang, Shen & Ho, 2009: 163-164; Pallant, 2013: 192). Inferential analysis was used to establish the degree of association respectively between the number of years and the number of projects undertaken, tested against the application of BIM technology in the Kenyan construction industry (Fisher, 1978).
3.1 Sampling method and size
A combined list of 1 599 members, registered in Kenya, was obtained from official bodies of the Board of Registration of Architects and Quantity Surveyors (BORAQS); the Engineers' Board of Kenya (EBK) and the Institute of Construction Project Managers in Kenya (ICPMK). The list was stratified between those members involved in architecture (736), quantity surveying (397), engineering (376), and project management (90).
Stratified sampling was used to divide the population in smaller proportional groups, Shi (2015: 3) resulting in a sample size of 310 representing architects (163), quantity surveyors (51), engineers (65), and project managers (31). The advantage of this method is that it narrows the difference between different types of individuals in the sample through classification (Shi, 2015: 3). The sample size for research done in construction-related populations was calculated in accordance with the table recommended by Krejcie & Morgan (1970: 608). From the table, the recommended sample size for a population of 1 000 is 278, and for 10 000, 370. This recommendation validates the sample size of 310 as efficient for the population of 1 599.
3.2 Response rate
Out of the 310 questionnaires sent out, a total of 195 completed questionnaires were returned, resulting in a high response rate of 63%.
3.3 Data collection
An online structured questionnaire survey was distributed to 310 participants by sharing the questionnaire link (https://freeonlinesurveys.com/s/AfUfnTRr) through text messages and social media platforms such as Facebook, WhatsApp, LinkedIn, Twitter, Google and Yahoo e-mail. The survey was opened on 26 September 2017 and closed on 1 December 2018.
Topics on BIM application used in the questionnaire were extracted from reviews of the literature, resulting in the formulation of a questionnaire divided into four sections. Section one on respondent's profile elicited personal information on years of experience in the construction industry as well as in the use of BIM, number of projects undertaken using BIM, software based for projects, and the type of tools used for BIM. It also obtained information on the type of employer and the nature of the job of the respondents. Section 2 set four questions on the awareness of BIM, in general, as perceived by the participants. Section 3 set one question on the benefits of BIM, consisting of 25 measures. Section 4 set one question on the barriers of BIM implementation, consisting of 15 measures. The respondents were required to indicate their level of agreement, in practice, with these measures defining the importance of BIM application. The data from these measurements forms the variables used in the EFA, which tested the validity and reliability of the measured factors. To reduce the respondent's bias, closed-ended questions were preferred for Sections two, three and four (Vicente & Reis, 2010: 260).
3.4 Data analysis and interpretation of findings
The Statistical Package for Social Science (SPSS) version 24 was used to determine the factor analysability of the BIM application variables, using inferential statistics (Pallant, 2013).
Descriptive statistics based on frequencies and percentages was used to measure central tendency and dispersion in order to describe the characteristics of the respondents as well as the current status of BIM application in the construction industry (Naoum, 2007: 103).
To rank the importance of the barriers and benefits of BIM application respectively, the measures on barriers (15) and benefits (25) were rated on a five-point Likert scale. Likert-type or frequency scales use fixed choice response formats and are designed to obtain levels of agreement by measuring attitudes or opinions (Bowling, 1997). The following scale measurement was used regarding mean scores, where 1 = least important (> 1.00 < and <1.80), 2 = somewhat important (> 1.81 and < 2.60), 3 = neutral (> 2.61 and < 3.40), 4 = important (>3.41 and < 4.20), and 5 = most important (>4.21 and < 5.00).
Cronbach's alpha values were extracted to analyse the internal consistency of reliability of the variables in the questions on BIM application (Kolbehdori & Sobhiyah, 2014: 347; Wahab, Ayodele & Moody, 2010: 67). Acceptable values of Cronbach's alpha would range from 0.70 to 0.95 (Tavakol & Dennick, 2011: 54-55, Garson, 2013: 30). In the current study, a cut-off value of 0.70 was preferred.
To confirm whether the data from the measurements was sufficient for factor analysis (test the validity), the Kaiser-Meyer-Olkin (KMO) test (Lorenzo-Seva, Timmerman & Kiers, 2011) and the Bartlett's sphericity test (Hair, Black, Babin et al., 2006: 110) were performed. In the KMO test, as the values of the test vary from 0 to 1, values above 0.7 are recommended as being desirable for applying EFA (Hair et al., 2006). A statistically significant Bartlett test (p < 0.05) indicates that sufficient correlations exist between the variables to continue with the factor analysis (Hair et al., 2006: 110; Pallant, 2013: 190).
For factor extraction, Principal Components Analysis (PCA) was used, as this method allows for extracting Eigenvalues where the highest Eigenvalues in the data are, therefore, the principal components in the data, and they are retained to form a set of variables with new names/labels (Rossoni et al., 2016: 102). PCA also allows for running Scree tests to determine the number of factors to retain. For this study, all components extracted that are above the initial Eigenvalue of 1 are retained (Kaiser, 1960). Components were chosen according to the correlation between the variables. For something to be labeled as a component (and give a new name), it should have at least 3 representative variables (Tabachnick & Fidell, 2013).
The Pearson's chi-square (P-value) test for independence was used to determine if there was a relationship between the number of years and the number of projects (dependent variables) undertaken and the application of BIM technology (independent variables) in the Kenyan construction industry.
• Null hypothesis H0: There is no association between the two statements.
• Alternative hypothesis H1: There exists at least some significant association.
The P-value (or the calculated probability) is the probability of the event occurring by chance, if the null hypothesis is true (Kamanga & Stern, 2013: 82). The pairs of variables analysed were limited to those with an observed P-value less than 0.100 (p < 0.100) with the significance level of (0.100). All pairs of variables with P-values above 0.100 were not considered and thus not included in this article.
3.5 Limitation of the study
It should be noted that, although the study was not conducted throughout Kenya, all professionals in the construction industry are registered in Nairobi. In addition, the professionals in the sample population are active across the country and hence the data is representative of the whole of Kenya.
3.6 Ethical clearance
The online questionnaire was circulated with an introductory message stating the aim, purpose, and confirmation that all information received will be treated with strict confidentiality and for academic purposes only. Prior to data collection, a formal request in writing to get authorization to collect data from construction professionals was done to relevant professional bodies in Kenya.
4. Results and discussion
Although 195 completed responses were received, only 146 responses were valid for reporting results on the barriers, and 137 responses were valid for reporting the results on the benefits of applying BIM in the construction industry.
4.1 Respondent's profile
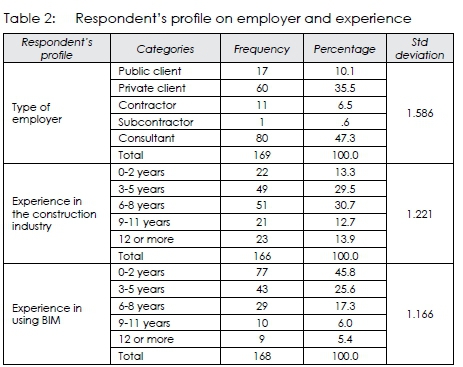
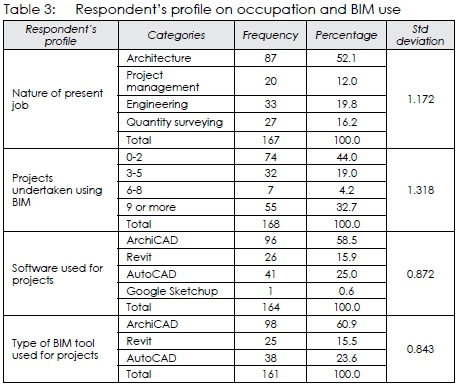
Tables 2 and 3 show the general demographic and work experience data of the respondents. Based on frequency of occurrence, the vast majority of the respondents have 0-2 years' (45.8%) experience of BIM in the construction industry and (30.7%) have between 6-8 years' experience. Of the respondents, 47.3 % are consultants and 35.5% work for private clients. The vast majority (52.1%) of the respondents are in the field of architecture. Whereas most of the professionals (42.8%) had undertaken a fairly limited number of projects (less than 5), nearly a third (32.7%) had completed 9 or more projects using BIM. Archicad was used predominantly as software as well as BIM tool.
4.2 Current status of the implementation of Building Information Modelling
Based on the frequency results from Table 3, very few respondents have undertaken projects using BIM. This confirms that the current adoption of BIM is still very low. These findings agree with results obtained by Matarneh & Hamed (2017a: 189), which indicate that the current state of BIM implementation in Jordan is still lagging, since only large AEC organisations (5%) have prompted a serious move towards BIM in certain categories, while 95% of organisations are not using BIM in any capacity.
Table 4 shows the current status of BIM application as perceived by the respondents.
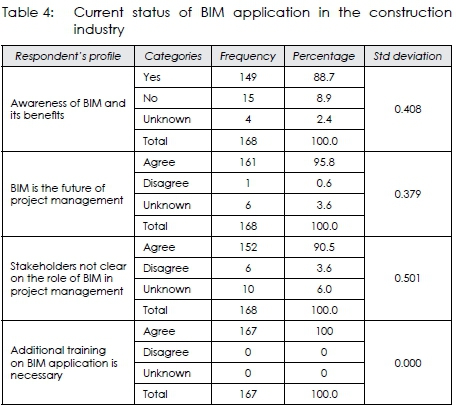
Based on frequencies, results show that most of the stakeholders are not yet clear about the role of BIM in project management and thus require additional training. These findings are also consistent with the results obtained by Abuhamra (2015) and Shaikh et al. (2016: 207), confirming that the level of BIM awareness is low among construction professionals. Balah and Akut (2015) carried out a similar study in Nigeria and found that only 30% of stakeholders claimed to be aware of BIM, with only 7% of the respondents having a proper understanding of BIM.
4.3 Benefits of implementing Building Information Modelling
Table 5 ranks the mean scores to show which of the 25 variables measuring the benefits when applying BIM applications in construction are considered important by construction professionals.
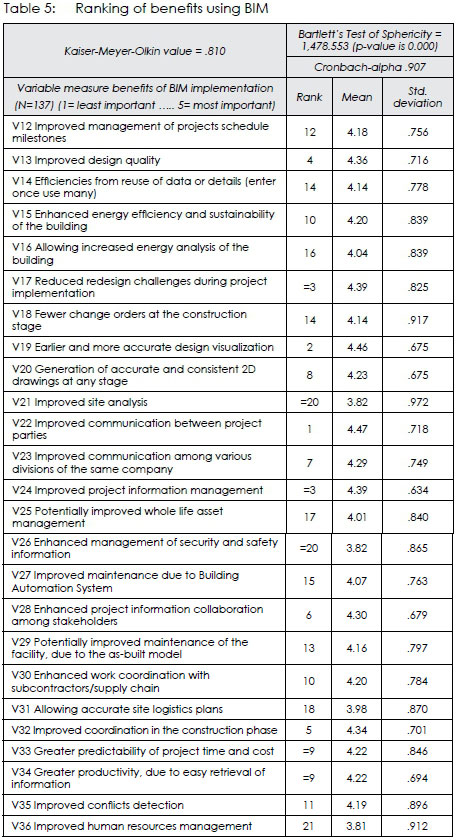
The respondents indicated the most important benefits of applying BIM in the construction industry in Kenya, with mean score ratings above >4.21 as: improve communication (4.47); accurate design visualization (4.46); improve project information management (4.39); reduce redesign challenges during project implementation (4.39); improve design quality (4.36), improve coordination in the construction phase (4.34); enhance project information collaboration among stakeholders (4.30); improve communication among various divisions of the same company (4.29); generation of accurate and consistent 2D drawings at any stage (4.23); greater predictability of project time and cost (4.22), and greater productivity, due to easy retrieval of information (4.22).
The Cronbach alpha was greater than 0.70 at .907, indicating acceptable internal reliability as recommended by Hair et al. (2006: 102). The Kaiser-Meyer-Olkin (KMO) measure was .810, indicating that the data were sufficient for factor analysis. The Bartlett's Test of Sphericity (p=0.00) with significance of p<0.05 showed that there is some relationship between the variables. These results suggest that the data on the benefits of BIM can be used for factor analysis.
4.3.1 Factor analysis of Building Information Modelling benefits
The 25 benefits variables were subjected to component analysis in order to study the trend of inter-correlations between variables and to group these variables with similar characteristics into a set of reduced variables according to the hidden components in the collected data. The results report the component extraction, Eigenvalues, correlation and interpretation.
In Figure 1, the scree plot consists of the Eigenvalues and the data points above the break (point of inflexion), which are the components that are meaningful to retain. Using a cut-off value of initial Eigenvalues greater than one (>1.0), there were 7 components that explain a cumulative variance of 66.07%.
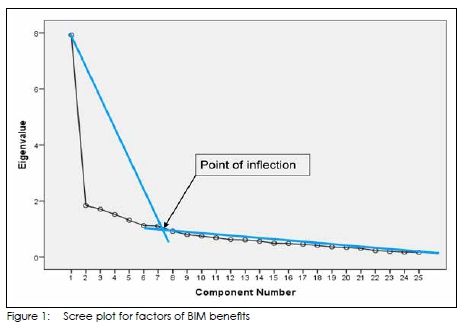
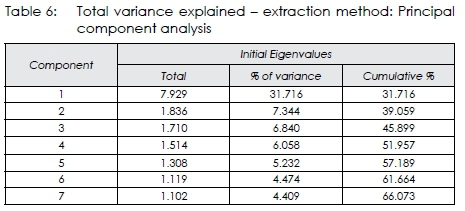
The scree plot confirms the finding of retaining seven components. As a result, components from eight to twenty-five are not significant and thus not included for analysis. Table 6 shows the seven components that are meaningful to retain, where component 1 explains 31.716% of the total variance; component 2, 7.344%; component 3, 6.840%; component 4, 6.058%; component 5, 5.232%; component 6, 4.474%, and component 7, 4.409%.
Using Varimax rotation method with significant factor of .04, Table 7 shows the component loadings of correlation between components and variables after rotation. V12 Improved management of projects milestones (0.391) was removed from the analysis, as it was not significant in the model. Correlation exists between variables in components 1, 2 and 7 labelled as Factor 1: Comprehensive project management. Correlations were identified between variables in components 3, 5 and 7 labelled as Factor 2: Design and building performance analyses, and correlations were identified between variables in component 4 labelled as Factor 3: Project data management.
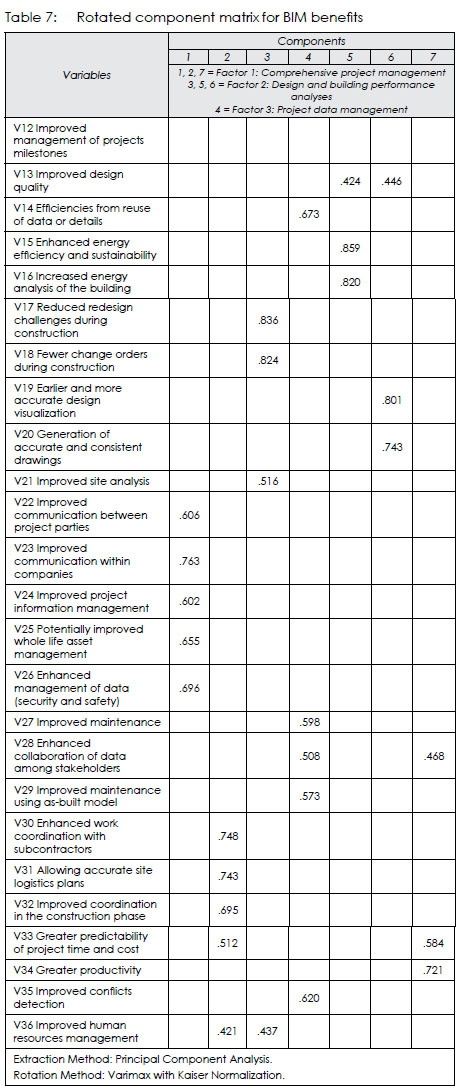
In Factor 1: Comprehensive project management (components 1, 2 and 7), the variables that had high loading are: Communication (0.763); work coordination (0.748); greater productivity (0.721), and accurate site logistics plans (0.743). Studies on the benefits of implementing BIM in construction projects show similarity to variables in Factor 1: Enhance collaboration and communication (Eastman, Teicholtz, Sacks, & Sacks, 2008); enhance design efficiency, scheduling, and documentation; reduces budget and reduced construction time (Adebimpe & Etiene, 2016); better communication, and efficient administration of construction projects (Latiffi et al., 2013).
In Factor 2: Design and building performance analyses (components 3, 5 and 6), the variables that scored high weights were: Enhanced energy efficiency and sustainability (0. 859); reduced redesign (0.836); fewer change orders during construction (0.824), and increased energy analysis of the building (0.820). These findings are consistent with similar results obtained for BIM benefits such as greater efficiency in change-order management (Brown, 2015); enhance design review (Shaikh et al., 2016); reduce rework during construction (Matarneh & Hamed, 2017b), and site analysis - reduction of expenses incurred on utility and demolition (Latiffi et al., 2013); energy optimization of the building (Abuhamra, 2015), and building performance analyses (e.g., energy modelling) (Azhar et al., 2012).
In Factor 3: Project data management (component 4), the variables with high scores were: Efficiencies from reuse of data or details (enter once use many) (0.673); improved conflicts detection (0.620); improved maintenance (0.598), and with the available building data (as-built model), BIM enables easier facility management (0.573). This finding agrees with similar studies that identified BIM benefits such as BIM enhances collaboration and communication among stakeholders (Eastman, Teicholtz, Sacks & Sacks, 2008); clash detection (Shaikh et al., 2016), and BIM allows for easier facility maintenance, due to existing building data (Ahn & Cha, 2014).
4.4 Barriers in the implementation of Building Information Modelling
Table 8 ranks the mean scores to show which of the 15 variables measuring the barriers when applying BIM applications in construction are considered important by construction professionals.
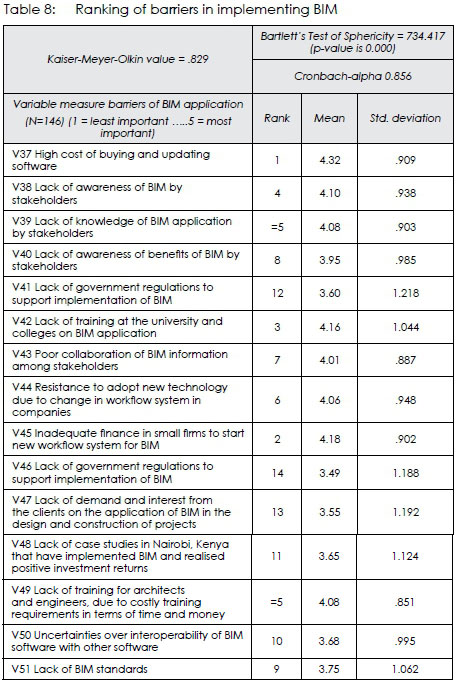
The respondents indicated the most important barrier when implementing BIM in the construction industry in Kenya, with mean score ratings above (>4.21) as high cost of buying and updating software (4.32), and important barriers as inadequate finance to start new workflow system for BIM (4.18); lack of training at the university and colleges on BIM application (4.16); lack of awareness of BIM by stakeholders (4.10); lack of knowledge of BIM application by stakeholders (4.08); lack of training for architects and engineers due to costly training requirements in terms of time and money (4.08); resistance to adopt new technology, due to change in workflow system in companies (4.06), and poor collaboration of BIM information among stakeholders (4.01).
The Cronbach alpha was greater than 0.70 at 0.856, indicating acceptable internal reliability as recommended by Hair et al. (2006: 102). The Kaiser-Meyer-Olkin (KMO) measure was 0.829, indicating that the data were sufficient for factor analysis. The Bartlett's Test of Sphericity (p=0.00) with significance of p<0.05 showed that there is some relationship between the variables. These results suggest that the data on the barriers of implementing BIM can be used for factor analysis.
4.4.1 Factor analysis of Building Information Modelling implementation barriers
Fifteen variables on BIM implementation barriers were subjected to component analysis to study the trend of intercorrelations between variables and to group these variables with similar characteristics into a set of reduced variables according to the hidden components in the collected data. The results report the component extraction, Eigenvalues, correlation, and interpretation.
In Figure 2, the scree plot consists of the Eigenvalues and the data points above the break (point of inflection), which are the components that are meaningful to retain. Using a cut-off value of initial Eigenvalues greater than one (>1.0), three components explain a cumulative variance of 53.16%.
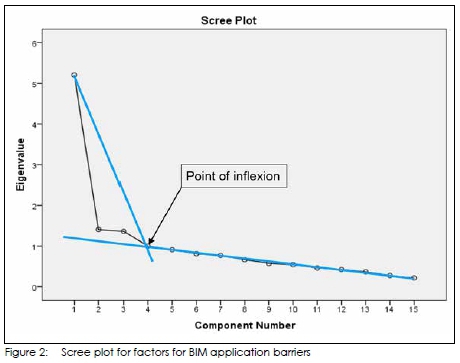
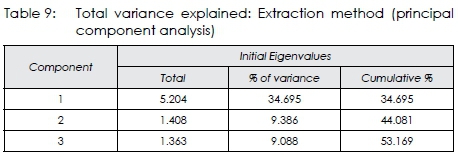
The scree plot confirms the finding of retaining three components. As a result, components from four up to fifteen are not significant and thus not included for analysis. Table 9 shows the three components that are meaningful to retain, where component 1 explains 34.695% of the total variance; component 2 explains 9.386%, and component three explains 9.088% of the variance.
Using Varimax rotation method with significant factor of .04, Table 10 shows the component loadings of correlation between components and variables after rotation. Correlation exists between variables in component 1 labelled as Factor 1: High cost of buying software and lack of training. Correlations were identified between variables in components 2 labelled as Factor 2: Lack of BIM standards and regulations, and correlations were identified between variables in component 3 labelled as Factor 3: Lack of BIM awareness and inadequate finance.
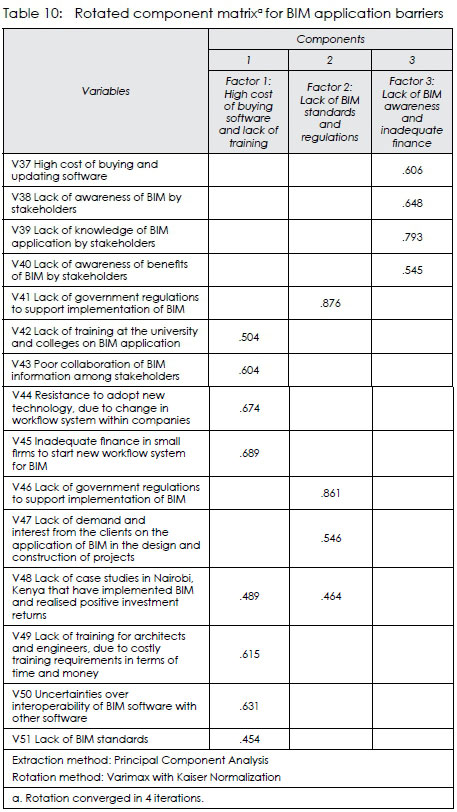
In Factor 1: High cost of buying software and lack of training
(component 1), the variables that had high loading were inadequate finance in small firms to start new workflow system for BIM (0.689); resistance to adopt new technology, due to change in workflow system within companies (0.674); uncertainties over interoperability of BIM software with other software (0. 631), and lack of training for architects and engineers, due to costly training requirements in terms of time and money (0. 615). Studies on the barriers of implementing BIM in construction projects show similarity to variables in Factor 1: Lack of awareness about BIM resulting in professionals comparing BIM to CAD (Gerges et al., 2017); high costs (software, hardware upgrade, training, and time) (Shaikh et al., 2016), and the majority of service providers are not actively using BIM technologies on their projects due to increased costs (Eastman et al., 2008).
In Factor 2: Lack of BIM standards and regulations (component 2), the variables that scored high weights were lack of government regulations to support implementation of BIM (0.861), and lack of government regulations to support implementation of BIM (0.861). These findings concur with results obtained from similar studies such as lack of standards and codes for BIM application (Chan, 2014), and absence of government support (Matarneh & Hamed, 2017b). In their study, Matarneh & Hamed (2017a) recommend that governments should set standards and codes for BIM industry at both the hierarchical and undertaking store network level.
In Factor 3: Lack of BIM awareness and inadequate finance
(component 3), the variables with high scores were lack of knowledge of BIM application by stakeholders (0.793); lack of awareness of BIM by stakeholders (0.648), and high cost of buying and updating software (0.606). These findings concur with results from other studies on BIM awareness. Abuhamra (2015) and Shaikh (2016) confirm that the level of BIM awareness is low among the construction professionals in Gaza strip and Mumbai (India), respectively. Balah and Akut (2015) state that only 30% of stakeholders in Nigeria were knowledgeable of BIM, with only 7% of the respondents having a proper understanding of the concept of BIM. These findings confirm that the level of BIM awareness is still very low in the Nigerian construction industry.
4.5 Inferential analysis
The main objective of this analysis was to establish the degree of association between the number of years and the number of projects undertaken by AEC professions and some of the application of BIM technology by constructing two hypotheses (null and alternative). The hypotheses will be stated as follows:
• Null hypothesis H0: There is no association between the two statements.
• Alternative hypothesis H1: There exists at least some significant association.
For purposes of this article, only the pairs of variables with Asymptotic Significance (2-sided) (P-values) below 0.100 (p < 0.100) were considered, because it shows that the null hypothesis is rejected and that the association between two variables is statistically significant.
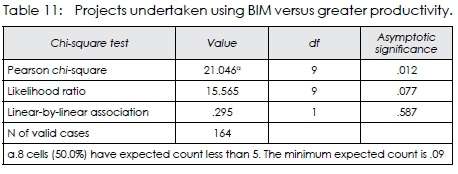
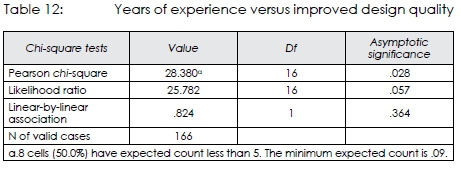
All pairs of variables with P-values above 0.100 were not considered and thus not included for analysis in this article. The chi-square test found an association between the number of projects undertaken and greater productivity (Table 11). An association between the number of years of experience and improved design quality was also observed (Table 12).
4.5.1 The number of projects undertaken versus greater productivity
Figure 3 illustrates the cross-tabulation percentages of the number of projects undertaken using BIM and greater productivity, due to easy retrieval of information.
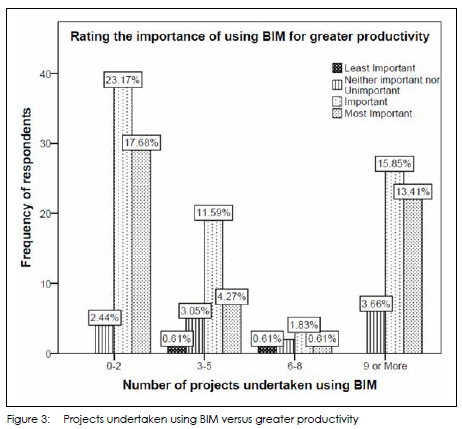
The proportion of professionals from all the project groups who perceived the use of BIM in projects as important was 52.44%, whereas the proportion of project groups who perceived the use of BIM in projects as unimportant was only 9.76%. The difference in proportions is significant, x2(9, N = 164) = 21.04, p = .012 (p < 0.100).
Table 11 shows the calculated results of the chi-square test of independence comparing the frequency of number of projects undertaken by a company using BIM in achieving greater productivity, due to easy retrieval of information. The chi-square test found an association between the number of projects undertaken and greater productivity, x2(9, N = 164) = 21.046, p = .012 (p < 0.100).
The observed P-value (0.012) is far less than the level of significance (0.100) and thus the number of projects undertaken by a company using BIM in any capacity has an influence on greater productivity, due to easy retrieval of information.
4.5.2 Number of years of experience versus improved design quality
Figure 4 illustrates the cross-tabulation percentages of the number of years of experience in the construction industry and improved design quality. The proportion of professionals from all the years of experience groups who perceived improved design quality as important was 44.57%, whereas the proportion of all the years of experience groups who perceived improved design quality as unimportant was only 5.41%. The difference in proportions is significant, x2(16, N = 166) = 28.380, p =.028 (p < 0.100)
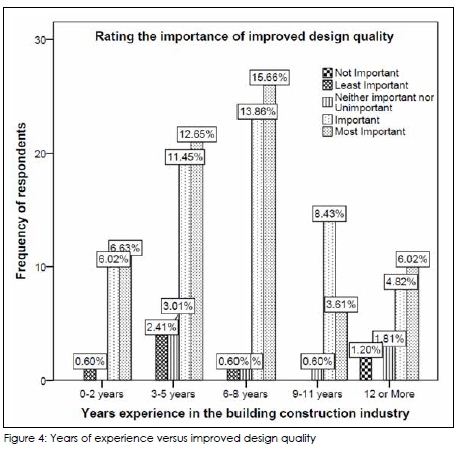
Table 12 shows the calculated results of the chi-square test of independence comparing the frequency of years of experience in the construction industry in achieving improved design quality. The chi-square test found an association between the number of years of experience and design quality, x2(16, N = 166) = 28.380, p =.028 (p < 0.100).
The observed P-value (0.0208) is far less than the level of significance (0.100) and thus the null hypothesis is rejected in favour of the alternative hypothesis. Based on the results of the study, improved design quality is influenced by the number of years of experience one has in the building construction industry.
5. Conclusions and recommendations
The study established that the current status of BIM application among professionals in the Kenyan construction industry is still lagging. Based on the results obtained, the vast majority (90.5%) of the respondents agree that construction industry stakeholders are not yet clear about the role of BIM in project management. This finding indicates that BIM is still a very new concept in the Kenyan construction industry.
Most of the benefits of BIM application were rated as highly important, with a weighted average score higher than 4.0 (80.0%). Among all indicators, improved communication between project parties with a mean of 4.47 (89.4%) had the highest rating and hence, was regarded as the most important indicator. Correlation of BIM benefit variables using factor analysis identified factors 1, 2 and 7 as 'Comprehensive project management', factors 3, 5, and 6 as 'Design and building performance analyses', and factor 4 as 'Project data management'.
The majority of the BIM application barriers were rated as highly important, with a weighted average score higher than 4.0 (80%). Among all indicators, the high cost of buying and updating software with a mean of 4.32 (86.4%) had the highest rating and hence, the most important indicator. Correlation of BIM application barrier variables using factor analysis identified factor 1 as 'High cost of buying software and lack of training"', factor 2 as 'Lack of BIM standards and regulations', and factor 3 as 'Lack of BIM awareness and inadequate finances'.
Based on inferential analysis, the results indicate that the number of projects undertaken using BIM has a considerable influence on greater productivity, due to easy retrieval of information. In addition, improved design quality is influenced by the number of years of experience one has in the building construction industry.
It is recommended that construction firms explore available subscriptions for BIM products that allow a more flexible way to purchase the software through affordable instalments (monthly, quarterly, or annual subscription fee). Tertiary institutions and small firms should also sign up for free versions of BIM software. In addition, BIM training by software vendors should be undertaken in vocational and tertiary institutions as well as construction firms. The government should also formulate policies, BIM standards and regulations to support BIM implementation by introducing state incentives such as tax credit for clients, professionals and contractors using BIM in their projects. This will enhance the application of BIM in the Kenyan construction industry.
References
AbuHamra, L.A.A. 2015. An investigation into building information modeling (BIM) application in architecture, engineering and construction (AEC) industry in Gaza Strip, Gaza: Islamic University of Gaza. [online] Available at: <http://library.iugaza.edu.ps/thesis/116796.pdf> [Accessed: 29 June 2017]. [ Links ]
Adebimpe, O. & Etiene, M. 2016. Assessment of the level of awareness and limitations on the use of building information modelling in Lagos State Akerele. International Journal of Scientific and Research Publications, 6(2), pp. 229-234. [ Links ]
Ahn, D. & Cha, H. 2014. Integration of building maintenance data in application of Building Information Modeling (BIM). Journal of Building Construction and Planning Research, 2(2), pp. 166-172. DOI:10.4236/jbcpr.2014.22015. [ Links ]
Ahuja, R., Sawhney, A., Jain, M., Arif, M. & Rakshit, S. 2018. Factors influencing BIM adoption in emerging markets - the case of India. International Journal of Construction Management, DOI: 10.1080/15623599.2018.1462445. [ Links ]
Anbouhi, M.H., Farahza, N. & Ayatollahi, S.M. 2016. Analysis of thermal behavior of materials in the building envelope using building information modeling (BIM) - A case study approach. Open Journal of Energy Efficiency, 5(3), pp. 88-106. https://doi.org/10.4236/ojee.2016.53009 [ Links ]
Azhar, S., Khalfan, M. & Maqsood, T. 2012. Building information modelling (BIM): Now and beyond. Australasian Journal of Construction, 12(4), pp. 15-28. [ Links ]
Azhar, S., Nadeem, A., Mok, J.Y.N. & Leung, B.H.Y. 2008. Building information modelling (BIM): A new paradigm for visual interactive modelling and simulation for construction projects. In: Proceedings of the 1st International Conference on Construction in Developing Countries (ICCIDC-I) "Advancing and Integrating Construction Education, Research & Practice", 4-5 August 2008, Karachi, Pakistan, pp. 435-446. [ Links ]
Balah, R.N.M. & Akut, K.L. 2015. Assessment of building information modelling (BIM) knowledge in the Nigerian construction industry. International Journal of Civil & Environmental Engineering IJCEE-IJENS, 15(6), pp. 60-69. [ Links ]
Bhuskade, S. 2015. Building information modelling (BIM). International Research Journal of Engineering and Technology (IRJET), 2(2), pp. 834-841. [ Links ]
Bowling, A. 1997. Research methods in health. Buckingham: Open University Press. [ Links ]
Brown, N.C. 2015. BIM benefits for contractors. [online]. Available at: <https://conappguru.com/workflow/bim-benefits-for-contractors/> [Accessed: 29 June 2017]. [ Links ]
CDBB (Centre for Digital Built Britain). 2011. A report for the Government construction client group. Building Information Modelling (BIM) working party strategy paper. Cambridge, University of Cambridge: CDBB. [online] Available at: <https://www.cdbb.cam.ac.uk/Resources/ResoucePublications/BISBIMstrategyReport.pdf> [Accessed: 29 June 2017]. [ Links ]
Chan, C.T.W. 2014. Barriers of implementing BIM in construction industry from the designers' perspective: A Hong Kong experience. Journal of System and Management Sciences, 4(2), pp. 24-40. [ Links ]
Creswell, J.W. 2003. Research design, qualitative and quantitative approaches. London: Sage. [ Links ]
Doumbouya, L., Gao, G. & Guan, C. 2016. Adoption of the building information modelling (BIM) for construction project effectiveness: The review of BIM benefits. American Journal of Civil Engineering and Architecture, 4(3), pp. 74-79. [ Links ]
Eastman, C., Teicholz, P., Sacks, R. & Liston, K. 2011. BIM handbook, a guide to building information modelling. Hoboken: John Wiley & Sons, Inc. [ Links ]
Eastman, C., Teicholtz, P., Sacks, R. & Sacks, K. 2008. BIM handbook: A guide to building information modelling for owners, managers, designers, engineers and contactor. Wiley: Hoboken. https://doi.org/10.1002/9780470261309 [ Links ]
Enshassi, A. & AbuHamra, L. 2017. Challenges to the utilization of BIM in the Palestinian construction industry. Proceedings of the 34th International Symposium on Automation and Robotics in Construction (ISARC2017), 28 June-1 July 2017, Taipei, Taiwan, China: International Association for Automation and Robotics in Construction (I.A.A.R.C), pp. 938-944. https://doi.org/10.22260/ISARC2017/0130 [ Links ]
Fisher, R.A. 1978. Statistical methods and scientific inference. 3rd edition. London: Collier Macmillan. [ Links ]
Garson, G.D. 2013. Scales and measures. Asheboro, NC: Statistical Associates Publishers. [ Links ]
Gerges, M., Austin, S., Mayouf, M., Ahiakwo, O., Jaeger, M., Saad, A. & Gohary, T-E. 2017. An investigation into the implementation of building information modelling in the Middle East. Journal of Information Technology in Construction (ITcon), 22, pp. 1-15. [ Links ]
Hadzaman, N.A.H., Takim, R. & Nawawi, A.H. 2015. BIM roadmap strategic implementation plan: Lesson learnt from Australia, Singapore and Hong Kong. In: Raidén, A.B. & Aboagye-Nimo, E. (Eds). Proceedings of the 31st Annual ARCOM Conference, 7-9 September 2015, Lincoln, UK, Association of Researchers in Construction Management, pp. 611-620. [ Links ]
Hair, J.F., Black, W.C., Babin, J.B., Andersen, R.E. & Taham, R.I. 2006. Multivariate data analysis. 6th edition. Upper Saddle River, NJ: Pearson/Prentice Hall. [ Links ]
Kaiser, H.F. 1960. The application of electronic computers to factor analysis. Educational and Psychological Measurement, 20, pp. 141151. https://doi.org/10.1177/001316446002000116 [ Links ]
Kamanga, M. & Stern, W. 2013. Causes of delay in road construction projects in Malawi. Journal of the South African Institution of Civil Engineering, 55(3), pp. 79-85. [ Links ]
Kassem, M., Iqbal, N., Kelly, G., Lockley, S. & Dawood, N. 2014. Building information modelling: Protocols for collaborative design processes. Journal of Information Technology in Construction (ITcon), 19, pp. 126-149. [ Links ]
Khosrowshahi, F. & Arayici, Y. 2012. Roadmap for implementation of BIM in the UK construction industry. Engineering, Construction and Architectural Management, 19(6), pp. 610-635. DOI: https://doi.org/10.1108/09699981211277531. [ Links ]
Kolbehdori, S. & Sobhiyah, M.H. 2014. Effect of negotiations about the formation of construction consortium on consortium successful performance in Iran's construction industry. International Journal of Management, Accounting and Economy, 1(5), pp. 346-349. [ Links ]
Krejcie, R.V. & Morgan, D.W. 1980. Determining sample size for research activities. Educational and Psychological Measurement, 30, pp. 607-610. https://doi.org/10.1177/001316447003000308 [ Links ]
Kugbeadjor, W., Suresh, S. & Renukappa, S. 2015. BIM awareness and readiness of postgraduate built environment students in West Midlands universities. Working Paper, pp.531-543. [online] Available at: <https://pdfs.semanticscholar.org/3be8/dff7213c808d575b57e5d0891770859d259e.pdf> [Accessed: 19 March 2017]. [ Links ]
Kushwaha, V. 2016. Contribution of building information modelling (BIM) to solve problems in architecture, engineering and construction (AEC) industry and addressing barriers to implementation of BIM. International Research Journal of Engineering and Technology (IRJET), 3(1), pp. 100-105. [ Links ]
Latiffi, A., Mohammed, S., Kasim, N. & Fathi, M.S. 2013. Building information modelling (BIM) application in construction planning. International Journal of Construction Engineering and Management, 2(4A), pp. 1-6. [ Links ]
Lorenzo-Seva, U., Timmerman, M.E. & Kiers, H.A. 2011. The Hull method for selecting the number of common factors. Multivariate Behavioral Research, 46(2), pp. 340-364. https://doi.org/10.1080/00273171.2011.564527 [ Links ]
Martínez-Rojas, M., Durán-Álvarez, J., Martínez-Aires, M. & López-Alonso, M. 2015. Analysis of the BIM applications for the architecture, engineering and construction project management: A bibliometric approach. Sibragec-Elagec 2015 De 7 A 9 De Outubro - São Carlos -Sp, 7(9): 504-510. [Online] Available at: <http://www.infohab.org.br/sibraelagec2015/artigos/SIBRAGECELAGEC_2015_submission_111.pdf> [Accessed: 20 August 2017]. [ Links ]
Matarneh, R. & Hamed, S. 2017a. Exploring the adoption of building information modelling (BIM) in the Jordanian construction industry. Journal of Architectural Engineering Technology, 6(1), p. 189. DOI: 10.4172/2168-9717.1000189. [ Links ]
Matarneh, R. & Hamed, S. 2017b. Barriers to the adoption of building information modelling in the Jordanian building industry. Open Journal of Civil Engineering, 7, pp. 325-333. DOI: https://doi.org/10.4236/ojce.2017.73022. [ Links ]
Naoum, S. 2007. Dissertation research and writing for construction students. London: Routledge, Taylor & Francis. [ Links ]
Netemeyer, R.G., Bearden, W.O.E. & Sharma, S. 2003. Scaling procedures: Issues and applications. Thousand Oaks, CA: Sage. https://doi.org/10.4135/9781412985772 [ Links ]
Njue, P. & Musyimi, M. 2017. Building information modelling in urbanizing Kenya. In: Wang, H. & Ledwon, S. (Eds). Proceedings of the Joint OAPA-ISOCARP Conference/53rd ISOCARP Congress, 24-27 October 2017, Portland, Oregon, USA. USA: ISOCARP, pp. 85-97. [ Links ]
Pallant, J. 2013. SPSS survival manual: A step-by-step guide to data analysis using IBM SPSS. 5th edition. Crows Nest, Australia: Allen and Unwin. [ Links ]
Rohena, R. 2011. Building information modelling (BIM) implementation in naval construction. El Paso, TX: The University of Texas. [ Links ]
Rossoni, L., Engelbert, R. & Bellegard, N.L. 2016. Normal science and its tools: Reviewing the effects of exploratory factor analysis in management. Revista de Administração, 51(2), pp. 198-211. https://doi.org/10.5700/rausp1234 [ Links ]
Sacks, R., Gurevich, U. & Shrestha, P. 2016. A review of building information modelling protocols, guides and standards for large construction clients. Journal of Information Technology in Construction (ITcon), 21, pp. 479-503. [ Links ]
Sampaio, A.Z. 2017. BIM as a computer-aided design methodology in civil engineering. Journal of Software Engineering and Applications, 10(2), pp. 194-210. DOI: https://doi.org/10.4236/jsea.2017.102012. [ Links ]
Sarkar, D. & Modi, R. 2015. Applications of building information modelling (BIM) to real estate projects of Ahmedabad. International Advanced Research Journal in Science, Engineering and Technology, 2(9), pp. 54-58. [ Links ]
Shaikh, A.A., Raju, R., Malim, N.L. & Jayaraj, G.K. 2016. Awareness and adoption of BIM in construction industry. International Journal on Recent and Innovation Trends in Computing and Communication, 4(4), pp. 204-208. [ Links ]
Shi, F. 2015. Study on a stratified sampling investigation method for resident travel and the sampling rate. Discrete Dynamics in Nature and Society, Volume 2015, 3/22/2015, pp. 1-7. DOI: http://dx.doi.org/10.1155/2015/496179 [ Links ]
Silva, M.J., Salvado, F., Couto, P. & Vale e Azevedo, Á. 2016. Roadmap proposal for implementing building information modelling (BIM) in Portugal. Open Journal of Civil Engineering, 6(3), pp. 475-481. https://doi.org/10.4236/ojce.2016.63040 [ Links ]
Tabachnick, B.G. & Fidell, L.S. 2013. Using multivariate statistics. 6th edition. Boston, MA: Allyn & Bacon. [ Links ]
Tavakol, M. & Dennick, R. 2011. Making sense of Cronbach's alpha. International Journal of Medical Education, 2, pp. 53-55. https://doi.org/10.5116/ijme.4dfb.8dfd [ Links ]
Telaga, A.S. 2018. A review of BIM (Building Information Modelling) implementation in Indonesia construction industry. In: Proceedings of the 7thAIC-ICMR on Sciences and Engineering, 18-20 October 2017, Banda Aceh, Indonesia, Vol. 352, Paper 012030. [ Links ]
Turner & Townsend. 2017. International construction market survey 2017. s.l.: Turner & Townsend. [ Links ]
Vicente, P. & Reis, E. 2010. Using questionnaire design to fight nonresponse bias in web surveys. Social Science Computer Review, 28(2), pp. 251-267. DOI: 10.1177/0894439309340751. [ Links ]
Wahab, O.M., Ayodele, A.E. & Moody, J.O. 2010. TLC phytochemical screening in some Nigerian Loranthaceae. Journal of Pharmacognosy and Phytotherapy, 2(5), pp. 64-70. [ Links ]
Yamazaki, Y., Tabuchi, T., Kataoka, M. & Shimazaki, D. 2014. 3D/ BIM applications to large-scale complex building projects in Japan. International Journal of High-Rise Buildings, 3(4), pp. 311-323. [ Links ]
Yang, J., Shen, Q. & Ho, M. 2009. An overview of previous studies in stakeholder management and its implications for the construction industry. Journal of Facilities Management, 7(2), pp. 159-175. https://doi.org/10.1108/14725960910952532 [ Links ]
Yong, G. & Pearce, S. 2013. A beginner's guide to factor analysis: Focusing on exploratory factor analysis. Tutorials in Quantitative Methods for Psychology, 9(2), pp. 79-94. https://doi.org/10.20982/tqmp.09.2.p079 [ Links ]
Peer reviewed and revised
*The authors declared no conflict of interest for the article or title


