


Serviços Personalizados
Artigo
 Inglês (pdf)
 Artigo em XML
 Referências do artigo
Indicadores

Links relacionados
-
 Citado por Google
 -
 Similares em Google
Compartilhar

 Permalink
Clean Air Journal
versão On-line ISSN 2410-972X
versão impressa ISSN 1017-1703
Clean Air J. vol.33 no.1 Pretoria 2023
http://dx.doi.org/10.17159/caj/2023/33/1.15367
RESEARCH ARTICLE
Tropospheric ozone (O3) pollution in Johannesburg, South Africa: Exceedances, diurnal cycles, seasonality, Ox chemistry and O3 production rate
Nadine Borduas-DedekindI, II, *; Mogesh NaidooI; Biqing ZhuIII; Jeffrey GeddesIV; Rebecca M GarlandI, V
ICouncil for Scientific and Industrial Research, Meiring Naude Road, Pretoria, 0001, South Africa
IIDepartment of Chemistry, University of British-Columbia, 2036 Main Mall, Vancouver, V6T 1Z1, Canada
IIILaboratoire des Sciences du Climat et de l'Environnement LSCE, Gif-sur-Yvette, France
IVEarth and Environment, Boston University, 685 Commonwealth Ave, Boston, Massachusetts, 02115, United States of America
VDepartment of Geography, Geoinformatics and Meteorology, University of Pretoria, Pretoria, 0001, South Africa
ABSTRACT
Ground-level ozone (O3) is an air pollutant of major health and environmental concern. The Johannesburg-Pretoria megacity in South Africa is the industrial and economical capital of the country with more than 10 million inhabitants experiencing poor air quality. In 2004, the City of Johannesburg (CoJ) began monitoring trace gases to assess ground-level O3 pollution. Here, we use CoJ's publicly available air quality data, and present the first long-term data analysis of O3, nitric oxide (NO), nitrogen dioxide (NO2), NOx and carbon monoxide (CO) in the City from 2004 to 2011 at three air quality monitoring sites: Buccleuch, Delta Park and Newtown. We quantified CoJ's South African National Ambient Air Quality Standards (NAAQS) exceedances for O3 and NO2, and demonstrate the City's substantial O3 and NO2 air pollution problem. O3 mixing ratios peak in the early afternoon as expected due to photochemical production. To estimate O3 production rates, we summed O3 and NO2 diurnal profiles to obtain Ox mixing ratios at each site. This analysis provided insight into missing volatile organic compound (VOC) reactivity as well as primary NO2 emissions information necessary for developing tropospheric O3 pollution mitigation strategies. Furthermore, CoJ experiences high O3 mixing ratios on weekends due to lower NOx traffic emissions titrating the O3, thereby providing evidence of a VOC-limited regime for O3 production. Seasonal peak O3 occurs in the austral spring, a maximum that we link to increases in water (H2O) concentrations which in turn increases radical chemistry leading to O3. In addition, wintertime VOC and aerosol emissions from biomass burning over the winter add important precursors for O3 formation once radical chemistry is initiated during the first rain events in early spring. In all, this study will help inform air quality modelling and policy work on air pollutants in the City of Johannesburg, South Africa.
Keywords: ozone, nitrogen oxides, Ox, air quality, air pollution, monitoring, Johannesburg, South Africa
Introduction
Ground-level ozone (O3) is a major component of photochemical smog (Jacobs, 1999). It can negatively impact human health and the environment by causing oxidative stress in the human lungs and/or in plant stomata (Monks et al., 2015; Sillman, 2003). O3 is a stressor on agricultural crops, and consequently on the world's food supply (Mills et al., 2018; Wilkinson et al., 2012). O3 has been labelled as the most difficult pollutant to bring into compliance with air quality standards (Jacobs, 1999).
O3 is termed a secondary pollutant because it is formed in the atmosphere from precursor gases such as nitrogen oxides (NOx) and volatile organic compounds (VOCs) in the presence of sunlight (Jacobs, 1999; Pusede et al., 2015). However, O3 has a non-linear dependence on the concentrations of its precursors and thus is notoriously difficult to manage and mitigate. NO and NO2 interconvert rapidly in the atmosphere and their sum is denoted as NOx (Figure 1). Daytime photolysis of NO2 leads to the production of an O atom (Reaction 1) which then goes on to react with abundant oxygen molecules to form O3 (Reaction 2) and involves a third body molecule, most likely N2 (Figure 1). O3 is also destroyed by NO to regenerate NO2, thus forming a null cycle (Reaction 3), traditionally termed the photo-stationary state (Jacobs, 1999). We subsequently refer to Reaction 3 as O3 titration. However, if NO is converted back into NO2 by peroxy radicals (RO2) (Reaction 5), the latter originating from oxidation of VOCs often by OH radicals or direct photolysis (Reaction 4), O3 production ensues (Figure 1). It is the regeneration of NO2 from Reaction 5 instead of from Reaction 3 that leads to O3 production P(O3) and therefore to ground-level O3 pollution.
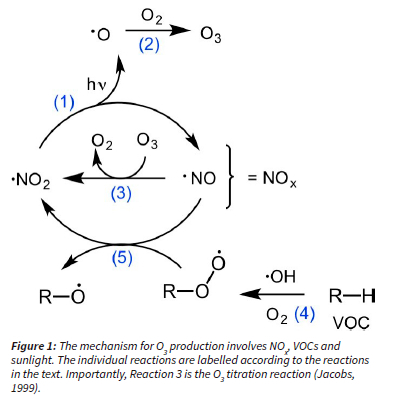
Understanding the termination reactions that remove RO2 and NO2 radicals from this cycle are important in assessing O3 production. In an area with elevated NO2 mixing ratios, NO2 can irreversibly react with OH to form nitric acid, HNO3 (Reaction 6), which is soluble and will be washed out by wet deposition (Figure 1). The other termination pathway occurs in low NOx regions when RO2 (including HO2) radicals self-react to from ROOR (including H2O2) and O2 (Reaction 7) (Figure 1). The latter pathway is negligible in urban areas where considerable NOx mixing ratios are expected. Furthermore, we define the sum of O3 and NO2 as Ox, used as proxy for total oxidants in the atmosphere (Geddes et al., 2009). NOx and VOC emissions can vary considerably depending on location, yet O3 pollution is typically a regional problem due to the transport of precursors from their emission points, further complicating its source apportionment.
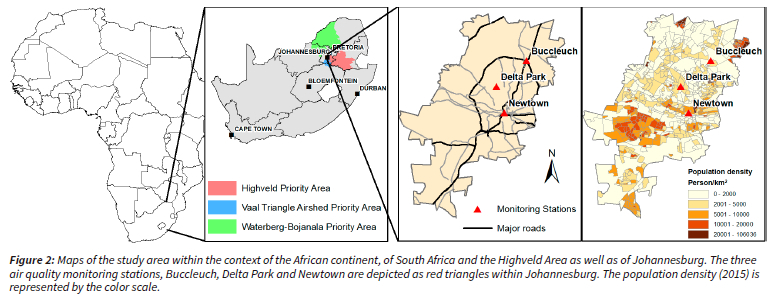
Tropospheric O3 mixing ratios in southern Africa remain high, often exceeding air quality standards. A lack of spatiotemporal monitoring as well as elevated precursor emissions (Mills et al., 2018) hinders abilities to mitigate O3 pollution. South Africa is one of the few countries on the African continent to have comprehensive air quality legislation (Schwela, 2012). The National Environmental Management: Air Quality Act (Act 39 of 2004) (AQA) enacted in 2004 identifies near-surface O3 as a criteria pollutant. The National Ambient Air Quality Standards (NAAQS) for O3 was set in 2009 at 61 ppb (120 μg/m3) for an 8-hour running average, with 11 allowable hourly exceedances per year (Sonjica, 2009). In South Africa, air quality priority areas can be declared for specific regions which consistently exceed standards, or are expected to exceed in the near future, and which require specific air quality management actions from a national level to improve air quality (Legislation, 2005). There are currently three air quality priority areas within South Africa, namely the Vaal Triangle Airshed Priority Area (VTAPA) (van Schalkwyk, DEAT, 2006), the Highveld Priority Area (HPA) (van Schalkwyk, DEAT, 2007) and the Waterberg-Bojanala Priority Area (WBPA) (DEA, 2012). A southern portion of the city of Johannesburg falls within the VTAPA, while the HPA borders the city to the east (Figure 2). The WBPA is approximately 75 km to the north of the city.
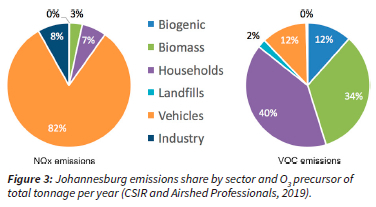
The City of Johannesburg (CoJ) is a rapidly growing urban area within the Gauteng Province of South Africa and is also the most populous city within the province (Figure 2). It is a noticeably higher altitude city at an elevation of 1750 m a.s.l. It is the most economically active in the country, contributing 17% to the country's GDP (Parks Tau and Fowler, 2016). Amidst this economic activity and development, CoJ experiences degraded air quality due to emissions from sources such as a rapidly increasing commercial and private vehicle fleets, household fuel combustion of coal, wood, liquefied petroleum gas and paraffin, mine tailing dumps, and various other industries (Figure 3) (CSIR and Airshed Professionals, 2019). Additionally, emissions emanating outside the city boundaries can also impact the urban air quality, such as a 420 MW pulverized coal fired power plant (Kelvin Power Station) outside the north-eastern edge of the city, as well as pollutants emitted in the adjacent priority areas. Emissions from adjacent priority areas include those from 13 of the country's 15 coal-fired power stations with an installed nominal capacity of 38.5 GW. In addition, CoJ is impacted by large-scale biomass burning that occurs in southern Africa in the austral winter and early spring, from June to October (Archibald et al., 2010; Giglio et al., 2006). NOx is emitted through high temperature combustion from sources such as vehicles and coal-fired power stations; as well as natural sources such as lightning strikes (Maseko et al., 2021). VOC emissions have a variety of sources to the atmosphere, which may be natural (biomass burning or biogenic) or anthropogenic, including from transport, industrial and residential sectors. Indeed, an air quality study in South Africa attributed continental O3 to biomass and residential burning (Laban et al., 2018). From the Irene O3 sondes launch station 15 km north-east of CoJ, biomass burning and long-range transport are known to have important impacts on the variability and magnitude of column O3 (Diab et al., 2004; Raghunandan et al., 2007; Thompson et al., 2007; Witte et al., 2017). However, there has been less research on ground-level O3 mixing ratios in Johannesburg and surrounding regions; though there have been some long-term measurements of O3 in South Africa (Balashov et al., 2014; Krohm, 1993; Rorich and Galpin, 1998).
Literature on ground-level O3 mixing ratios in and around CoJ is primarily based on previous passive sampling measurements of monthly O3 mixing ratios with some continuous monitoring (Zunckel et al., 2004). Indeed, in the 1980s, O3 levels were already known to be unusually high, with a recorded peak of 302 ppbv in the spring of 1984 in Johannesburg (Stevens, 1987). Furthermore, there were 84 exceedances of the previous US EPA hourly standard (80 ppbv) for the time period between 1984-winter 1985 (Stevens, 1987). In that study, emissions from traffic were identified as a key contributor to NOx pollution. However, between 2005-2007, monthly averages of O3, measured by passive sampling, ranged between 0 and 43 ppbv at a rural site (Josipovic et al., 2010). Lourens et al. in 2011 saw few exceedances of the NAAQS in O3 and NOx from passive sampling between 2007 and 2008, but did observe an anti-correlation between high spring O3 mixing ratios and low spring NOx, likely indicative of a VOC-limited regime. A study of ground-level O3 data of 1990-2007 in the Mpumalanga Province (east of Johannesburg) found no statistically significant trend in annual O3, and only one station exhibited a slight negative trend (-0.92 ppb/yr) in spring O3 averages (Balashov et al., 2014). In addition, four out of five stations studied in Mpumalanga Province showed sensitivity to ENSO in December-May, with El Nino amplifying O3 formation (Balashov et al., 2014). Measurement sites in the VTAPA, which include the Diepkloof site in the southern part of CoJ, recorded exceedances of the NAAQS as well as a seasonal increase in springtime O3 (Govender and Sivakumar, 2019). Most of these studies conclude that further research in the Johannesburg-Pretoria Megacity area is needed.
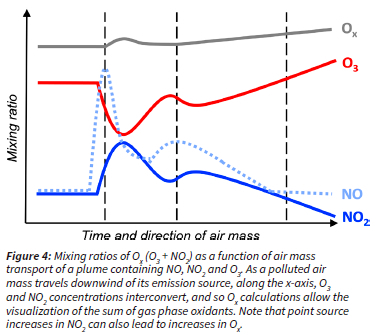
CoJ installed an air quality monitoring network in 2004 to quantify the extent of its air quality problem in its metropolitan area. Since then, air quality data including ozone (O3), nitrogen oxides (NO and NO2) and carbon monoxide (CO) have been measured in real time. In this study, we looked at a dataset from 2004 to 2011 of hourly O3 mixing ratios and its precursors, namely NO, NO2, NO and CO, measured at three different monitoring sites within CoJ. Importantly, we quantify Ox, the sum of NO2 and O3, to estimate the photochemical production of O3 on a regional scale (see Figure 4). To mitigate tropospheric O3 pollution, we must develop strategies to lower O3 production rates, and Ox represents a good proxy for this rate (Geddes et al., 2009; Sokhi et al., 2021). To be clear, high O3 mixing ratios do not equate to high O3 production rates because of the nonlinear formation of this secondary pollutant (see Figure 9 for examples). Since O3 and NO2 interconvert rapidly between each other and form a null cycle (R1, R2 and R3 in Figure 1), changes in either one of these pollutants do not necessarily translate into changes in ozone production (see Figure 4). Furthermore, as a polluted air mass travels downwind of its emission source, O3 and NO2 concentrations continue to interconvert, and so Ox calculations allow the visualization of the sum of gas phase oxidants (Figure 4). We recommend considering Ox chemistry for O3 pollution mitigation strategies. Through this analysis, we aim to better understand O3 pollution within the city to better characterize the pollution and its drivers, and thus inform air quality management.
Methods
Description of studied area
The City of Johannesburg (CoJ) is surrounded by other populous cities (e.g. City of Tshwane), as well as heavily industrialized areas. Specifically, Ekurhuleni Metropolitan Municipality and Mpumalanga Province lie to the east, and the Vaal Triangle lies to the south (Figure 2). The southern part of Johannesburg falls within the Vaal Triangle Airshed Priority Area, and the Highveld Priority Area borders the city to the east (Figure 2). The recently declared Waterberg-Bojanala Priority Area is to the north and northeast of Johannesburg. Thus, transboundary pollution from these priority areas is a concern for the city.
Monitoring stations
Dataset length and availability
The hourly air quality and meteorological data from four monitoring sites, Buccleuch, Delta Park, Newtown and Alexandra (Figure 2) were acquired through the South African Air Quality Information Systems (SAAQIS; https://saaqis.environment.gov.za) with permission from CoJ. O3 was measured at the Alexandra site from 2004 to 2008, but the data collection ended in 2008. Since the Alexandra time-series represented only 3.5 years of data, we omitted this site from our analysis. Therefore, only three air quality monitoring sites, Buccleuch, Delta Park, and Newtown, were chosen for this study for their O3 measurement availability from 2004 to 2011. After 2011, the data availability dropped significantly, and we therefore focus our analysis on the continuous time-series of pollutants between 2004-2011.
Relative humidity (RH) and dewpoint temperature data for the seasonal analysis were not available at Buccleuch, Delta Park or Newtown, and so we used RH, temperature and dewpoint temperature data from the Global Hourly Integrated Surface Database hosted by NOAA. We used weather data from 20042011 at the nearby location of OR Tambo International Airport considered part of the broader CoJ metropolitan area.
Site descriptions
The Buccleuch, Delta Park and Newtown sites are influenced by traffic, residential, and urban environments, respectively. The Buccleuch site (26.0453°S; 28.0991°E) is located at the interchange of three major highways (4 - 6 lanes per direction), the N1, N3 and M1, in the northern part of the city (Figure 2). According to the South African National Roads Agency Limited (SANRAL) vehicle counts, over 146 million vehicles passed through the interchange in 2016, with peak volumes seen at either 08:00 or 16:00 (The South African National Roads Agency LTD, 2016). This amounts to an average daily traffic of 403 590 vehicles per day which is comparable for major metropolitan areas around the world. For context, the Springfield Interchange on the Capital Beltway around Washington DC in the United States saw 430 000 vehicles per day in a 2008 estimate (Washington Post, 2007). Additionally, the interchange between Highway 401 and Highway 400 in Toronto, Canada is considered to be Canada's busiest interchange, with a peak flow over 400 000 vehicles per day in 2004 (Nikolic et al., 2005). Thus, the Buccleuch interchange may be considered to have particularly high volumes of vehicles.
The Delta Park site (26.125°S; 28.0086°E) is situated in the middle-class residential suburb of Blairgowrie. The station itself is located in a semi- to sparsely vegetated park with an approximately 1 km2 area. According to the South African National Land Cover 2018 dataset, the dominant vegetation types in the park are dense forest, woodland and natural grassland (GeoTerralmage, 2018). The nearest busy road is a four lane arterial road (Jan Smuts Avenue) 1.6 km to the north-east.
The Newtown site (26.2052°S; 28.0321°E) is located in downtown Johannesburg in the central business district at an office parking lot, 145 m to the east of the double decker section of the M1 highway.
Instrumentation for trace gas analysis
O3 measurements were made with Thermo 49C UV photometric O3 analyzer (Thermo Fisher Scientific, Franklin, MA, USA), and NO, NO2 and NOx data were from measurements made with the Thermo 42C chemiluminescent gas analyser (Thermo Fisher Scientific, Franklin, MA, USA)). These instruments both use U.S. EPA Designated Methods and show equivalency to the South African monitoring standards.
We further verified our dataset for the reported BTEX (benzene, toluene, ethylbenzene and xylene) interferences to O3 measurements (Xu et al., 2018). We conclude that this interference is unlikely in this study for 2 reasons. (1) BTEX compounds are co-emitted with CO but in our study, CO was anti-correlated with O3 in CoJ's VOC-limited regime for O3 production. In other words, the higher recorded mixing ratios of O3 occurred when CO, and thus BTEX, were lower, thereby avoiding a bias in high O3 mixing ratios due to interference. (2) O3 measurements at Buccleuch, the traffic site, show a clear photochemical diurnal profile, further supporting the validity of the O3 measurements despite a high BTEX environment which would likely have peaked during morning and evening traffic (see CO diurnal profile in Figure 8A).
We also note that alkyl nitrates, such as peroxyacetyl nitrate PAN, and HONO were also likely measured by the NOx analyzer, and thus these measurements are likely an overestimate of NOx (Wooldridge et al., 2010). Meteorological measurements at each site included wind speed, wind direction, temperature, relative humidity, solar radiation and atmospheric pressure data, although at times these datasets were incomplete. Buccleuch and Newtown also had available intermittent CO data measured by a Thermo Model 48C CO analyser. Finally, Buccleuch had incomplete BTEX data and it was deemed unusable for data analysis. This study looks at the available data from July 2004 to December 2011, after which time, the data completeness decreases dramatically and thus is unreliable.
Data analysis
Data quality control
These monitoring stations are intended to be continuous; however numerous issues relating to instrumentation errors, technical problems and power-failures have resulted in incomplete datasets throughout the 2004-2011 study period. Although the data can be publicly requested, we unfortunately do not have access to instrument logs, logbooks or flagged data. Consequently, our data quality control focused on obvious invalid data such as multi-day identical values (unrealistic for short lived species), negative values (nonsensical) and infinity values ("inf", nonsensical). Note that we did first look for baseline drifts which could have occurred due to lack of calibrations, but there was no obvious drift to account for (see Figures S1 and S2). The hourly concentrations were rounded to the nearest integer for O3 and NOx, and to the nearest tenth of a decimal for CO.
To further substantiate the data quality control analysis, diurnal plots for all pollutants were generated with raw versus quality controlled data, to ensure no significant differences were introduced during our quality control. For example, diurnal profiles of CO at Buccleuch showed no difference in mean, concluding that our quality control methods have not altered the overall dataset (Figure S3).
Data completeness
Data completeness varied between years and months but did not show a significant difference between weekdays and weekends. Furthermore, no clear difference in data completeness was observed between seasons and hours of the day, indicating that despite incompleteness, the quality-controlled data showed good representativeness. In all, data availability over the 8-year period across sites binned hourly ranged between 58.8-77.3% for O3, 54.3-64.1% for NOx and 40.5-66.4% for CO, all with standard deviations of less than 5.2% (Table S6).
Statistical analysis
The quality-controlled datasets were checked for normal vs lognormal distributions. All inspected pollutant data showed lognormal distribution, indicating that the data was skewed to lower concentrations, which is typically observed in environmental and air quality observations (Limpert et al., 2001). Indeed, high values were observed, although at lower frequencies. Diurnal cycle plots are used to demonstrate daily profiles of O3 and its precursors.
Statistics for the seasonal analysis were conducted in R using the Simple linear regression method, with the lm() function from the stats package. We report R2 values of the regression models for quantifying how much variability of the monthly mixing ratios of the trace gases can be explained by the change of time. We also report the p-values of the trend slopes, with p-value < 0.01 considered to represent a significant trend.
We attempted to look at trends in O3, NO2 and Ox over our study period, but the dataset is too short to draw conclusions (Figure S11).
Air quality exceedance calculations
O3 and NO2 exceedances were calculated based on the NAAQS for South Africa. An O3 exceedance is an 8-hour running average concentration above 61 ppbv, with an annual allowance of 11 hourly exceedances. The prescribed O3 exceedance is not limited to one exceedance per day, like the WHO (World Health Organization, 2021) and US EPA standards (US EPA, 2020), but rather any 8-h running average that exceeds 61 ppbv. Therefore, multiple exceedances per day can occur in South Africa. NO2 exceedances are defined as those above 106 ppbv and 21 ppbv for hourly and yearly averages, respectively. 88 NO2 hourly exceedances per year and zero NO2 yearly exceedances are allowed by the NAAQS.
H2O concentrations calculations
The partial pressure of H2O was calculated using the dew point temperature as input into the Tetens equation (mbar):
Ph20 = 0.61078 χ exp(17.27 χ dewpointT/(dewpointT + 243.04)) χ 10
The saturation vapour pressure of H2O was also calculated using the ambient recorded temperature within the Tetens equation and subsequently converted into H2O partial pressure using the RH data. Both methods corroborate the partial pressure of H2O. The concentration of H2O was then calculated using:

where Av is Avogadro's number, R is the gas constant and T is the ambient temperature in K. H2O concentrations are reported in molecules/cm3.
Data analysis software
Finally, plots were generated using either R version 3.4.1 or IGOR version 7.
Results and discussion
O3 exceedances in Johannesburg
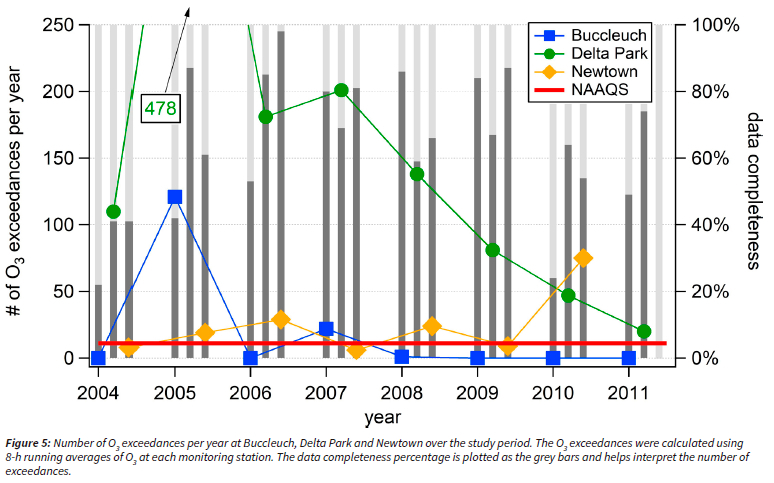
O3 mixing ratios from three air quality monitoring sites show exceedances according to South Africa NAAQS (Figure 5). The number of yearly O3 exceedances from 2004-2011 at Buccleuch, Delta Park and Newtown ranged between 0 - 121, 20 - 427 and 6 - 75, respectively, out of a possible 8 760 hours (Figure 5 and Table S1). Note that since NAAQS exceedances are calculated on an hourly basis in South Africa, multiple exceedances per day are possible. Because of variable data completeness, the number of O3 exceedances likely represent a lower bound (Figure 5). Clearly, CoJ has a substantial and quantifiable ground-level O3 pollution problem, particularly at Delta Park.
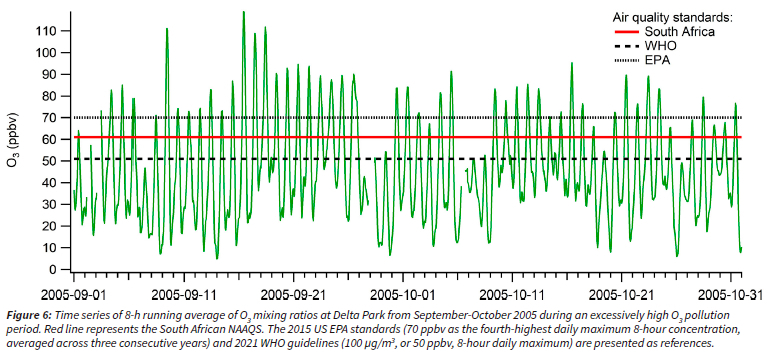
There are clear differences in the number of O3 exceedances per site. O3 exceedances occurred at Delta Park every year, with 478 recorded exceedances in 2005. Delta Park is a residential site and was initially intended to be an urban background site, however, it clearly experiences the highest O3 pollution, concurrently with lower NO concentrations. On the other hand, at Buccleuch, a heavily traffic influenced site, few annual O3 exceedances were observed. This low frequency of exceedance at Buccleuch is attributed to NO titrating O3 mixing ratios through Reaction 3 in Figure 1. At Delta Park, this titration does not occur to the same extent, leading to higher O3 mixing ratios. Newtown is an innercity site near a busy road and experiences O3 exceedances near the NAAQS; however not as many as at Delta Park. Of note, a concerning sustained high O3 pollution period occurred at Delta Park from September to October 2005 (Figure 6, Table S1). 8-h running average O3 exceeded the 61 ppbv set by NAAQS, 51 out of 61 days during the spring of 2005 (Figure 6). Delta Park is in a residential area within Johannesburg, and we expect these high O3 mixing ratios had non-negligible effects on the health of the residents in the spring of 2005.
CoJ is not the only city in South Africa to experience large numbers of O3 exceedances of the NAAQS. At the Marikana monitoring station located in a mining area northwest of CoJ, O3 exceedances of NAAQS more than 322 times per year were measured between February 2008 and May 2010 (Venter et al., 2012). These exceedances were attributed to regional air masses bringing O3 precursors to the monitoring site. In the Mpumalanga Province monitoring sites in the Highveld Priority Area (see Figure 2), annual O3 exceedances across five sites for 2012-2014 were between 17-761 per year (Lukey, Peter et al., 2011). The Vaal Priority Area also experienced notable exceedances over the period of 2007-2017, but were not numbered (Govender and Sivakumar, 2019). This large number of exceedances in the areas surrounding Johannesburg highlights that O3 pollution is an issue across the region.
NO2 exceedances in Johannesburg
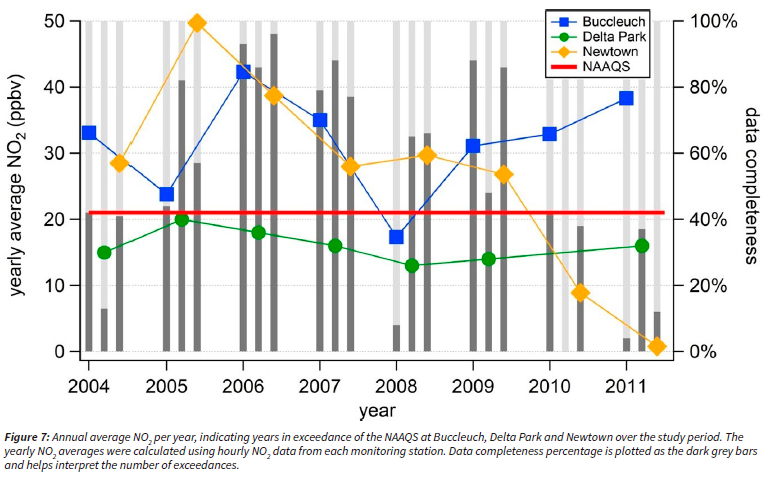
Newtown and Buccleuch have high exceedances of the NO2 annual NAAQS (21 ppbv), with yearly averages of NO2 mixing ratios up to 49.7 ppbv and 42.3 ppbv, respectively, over the 8-year study period (Figure 7 and Table S2). The available data ranged from 0% to 96% completeness, and thus is important to consider when analysing the annual averages and number of exceedances calculated (Figure 7). Nonetheless, Buccleuch and Newtown appeared to consistently exceed the annual NAAQS for NO2, whereas Delta Park showed no exceedances in NO2 regardless of the data fraction available. Since the lifetime of NO2 in the boundary layer is relatively short (approximately 6 hours in summer time), it is often co-located with its sources, which in this case are majorly traffic emissions (see Figure 3) (Pusede et al., 2015).
Diurnal profiles of O3, NOx and CO
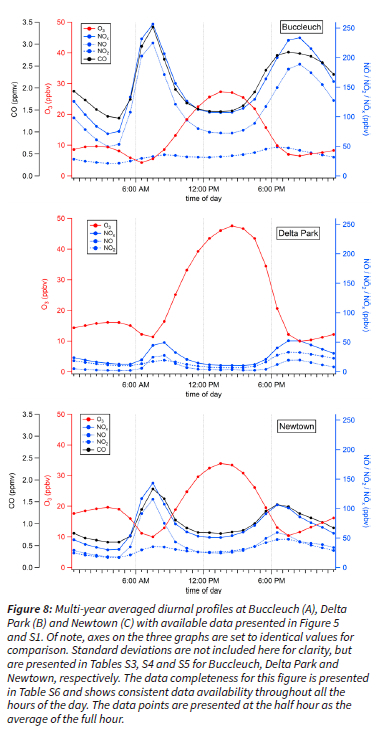
Hourly diurnal profiles of O3, NOx and CO display strong time-of-day dependence at the sites (Figure 8 and refer to Tables S3, S4, S5 and S6). O3 peaked in the afternoon as expected, coinciding with peak solar irradiance necessary for its photochemical production. The lowest O3 mixing ratios were recorded during morning rush hour around 7:00AM, concurrent with high NO traffic emissions titrating O3 from R3 in Figure 1 (Figure 8). Increasing O3 mixing ratios overnight were perhaps due to the entrainment of residual O3 above the shallow nocturnal boundary layer. O3 mixing ratios were consistently anti-correlated with traffic emitted NOx, as expected from the formation mechanism of O3 from the photolysis of NO2 (R1 and R2 in Figure 1). At all sites, the evening peak in NOx coincided with slightly higher NO2, indicative of a shallower boundary layer trapping pollutants and/or of a change in emission sources. Despite these similarities, Buccleuch, Delta Park and Newton had important differences in diurnal profiles of these criteria pollutants.
Buccleuch's diurnal profile showed remarkably high NOx mixing ratios, peaking around 250 ppbv every morning from traffic emitted NO (Figure 8A). Over 400 000 vehicles pass by the Buccleuch interchange on average per day (See Figure S10 for diurnal variation in hourly traffic counts) (The South African National Roads Agency LTD, 2016). NO clearly remains the major component of NOx throughout the day as expected for this traffic site (Figure 8A). Furthermore, the CO/NOx ratio is slightly lower in the evening from 7:00 PM to 11:00 PM, indicating a change in source emissions from traffic to other types of incomplete combustion sources (Figure 8A). In addition, domestic coal combustion in nearby low-income settlements for cooking and heating could be contributing to the nighttime (from 11:00 PM to 5:00 AM) increased ratio of CO/NOx at Buccleuch.
Delta Park O3 mixing ratios are distinctively high with an average of 48 ppbv at 2:00 PM over the 8-year period (Figure 8B). Lower NOx mixing ratios contribute to higher O3 levels at Delta Park, because less O3 titration is occurring (R3). Of note, the morning rush hour peak of NOx at this station saw similar contributions from NO and NO2, suggesting localized NO traffic emissions are low, reaching only 25 ppbv in the morning (Figure 8B). Average O3 mixing ratios peaked an hour later at Delta Park in comparison to the other stations. We hypothesize that in the presence of less NOx compared to Buccleuch and Newtown, O3 production can peak later in the day at Delta Park (Figure 8).
Air pollutants at Newtown have intermediate mixing ratios between Buccleuch, a highly traffic influenced site, and Delta Park, a residential site (Figure 8). Newtown is located in downtown CoJ in an office parking lot, and experiences influences from medium to heavy traffic on the M1, 145 m to the west and light traffic from the immediate street. The morning rush hour signal at Newtown is similar in timing and composition to Buccleuch's, albeit in lower absolute concentrations (Figure 8). Newtown's diurnal profile also supports intermediate exceedances in both O3 and NOx (Figure 5 and S1). Finally, CO mixing ratios follow an anthropogenic emission profile related to traffic emissions similar to Buccleuch.
Ox (NO2 + O3) chemistry to estimate O3 production
The observed anticorrelation between O3 and NO2 in Figure 8 is difficult to interpret due to the dual role of NOx (1) as an O3 precursor (R1 and R2 in Figure 1) and (2) as a temporary O3 reservoir (R3 in Figure 1). In other words, since O3 and NO2 interconvert rapidly between each other and form a null cycle (R1, R2 and R3 in Figure 1), increases in O3 are not necessarily proportional to chemical O3 production (Figure 4). Nonetheless, mitigation of regional O3 pollution depends strongly on controlling and understanding O3 production rates (Geddes et al., 2009). We therefore use Ox as the sum of NO2 and O3 to address this rapid interconversion and, assuming negligible direct sources of NO , we can use changes in O over time as a proxy for chemical O3 production from VOC oxidation (R4 and R5 in Figure 1 and Figure 4) (Clapp and Jenkin, 2001; Mazzeo et al., 2005; Sokhi et al., 2021).
The multi-year average diurnal profile of Ox is different at each location (Figure 9). During daytime, we can assume that the rise in Ox is solely driven by chemical O3 production, since NO2 mixing ratios are relatively constant (Figure 8). We can therefore approximate average O3 production rates from the change in Ox over time (A[Ox]/At). In other words, the steeper the slope of the O between 8:00 AM and 1:00 PM, the faster the rate of Ox3 production (Figure 9). At Buccleuch, Delta Park and Newtown, the estimated multi-year average O3 production rates were 3.3 ppb h-1, 3.5 ppb h-1 and 2.7 ppb h-1, respectively from 2004 to 2011 (Figure 9). We hypothesize that at the traffic site, there must be high VOC reactivity to drive high O3 production rates in the presence of peaks of 250 ppbv of NOx (Figure 8). We can further infer that the oxidative capacity at Buccleuch is highest.
Weekend O3 effect and evidence of a VOC-limited regime
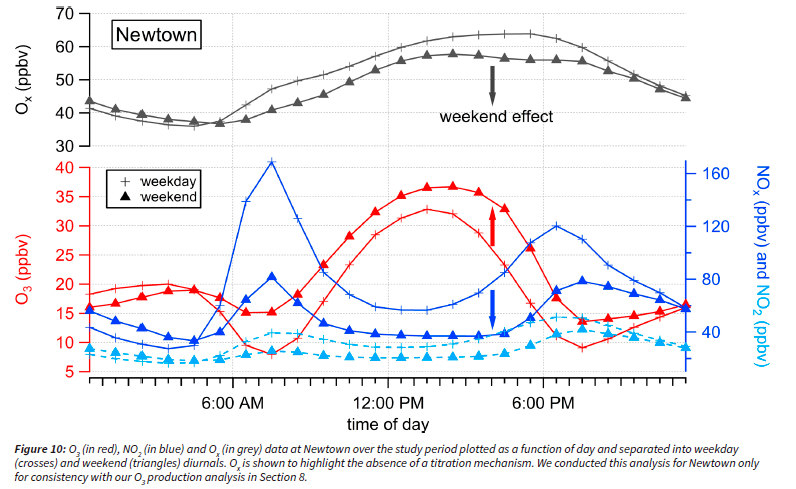
At all three sites, higher O3 mixing ratios were observed during the weekend, a previously documented observation in cities termed the "weekend effect" (Figure 10) (Murphy et al., 2007, 2006). During the weekend, lower NO mixing ratios are reported at Newtown (blue arrow in Figure 10), concurrent with higher O3 mixing ratios (red arrow in Figure 10). Govender and Sivakumar, (2019) also noticed that O3 mixing ratios were higher on Saturdays and Sundays in the Vaal Priority Area. This observation at the same site may be evidence of a VOC-limited regime for O3 production, but requires accounting for a decrease in the temporary titration effect of near-field NO sources.
We looked at Ox (NO2 + O3) diurnal profiles during the weekday and weekend at Newtown as a proxy for O3 production rates. Interestingly, Ox mixing ratios are lower on weekends than on weekdays by 8 ppbv (grey arrow in Figure 10). Assuming that VOC reactivity is not strongly dependent on day of the week (given local emissions are dominated by household activities as seen in Figure 3), this weekend Ox decrease can be explained by two scenarios. First, O3 production rates in the region are NOx-limited, leading to Ox decreasing with decreasing in NOx emission. Or second, there is a significant direct source of NO2 in the NOx emissions which confound the use of Ox as a proxy for O3 production. In the following section, we use a mathematical model to argue that O3 production rates in this region are highly VOC-limited and we therefore reject the first scenario. The most likely culprit for the weekend Ox behaviour is direct emissions of NO2 from diesel fuels (Carslaw, 2005). In situations of NO2 direct emissions, we advise caution in interpreting Ox changes over time as indicative of O3 production rates. It is noteworthy that the weekend effect analysis which looked at changing O3 and NO2 mixing ratios, provided insight into likely NO2 direct emissions at Newtown.
Seasonality of O3
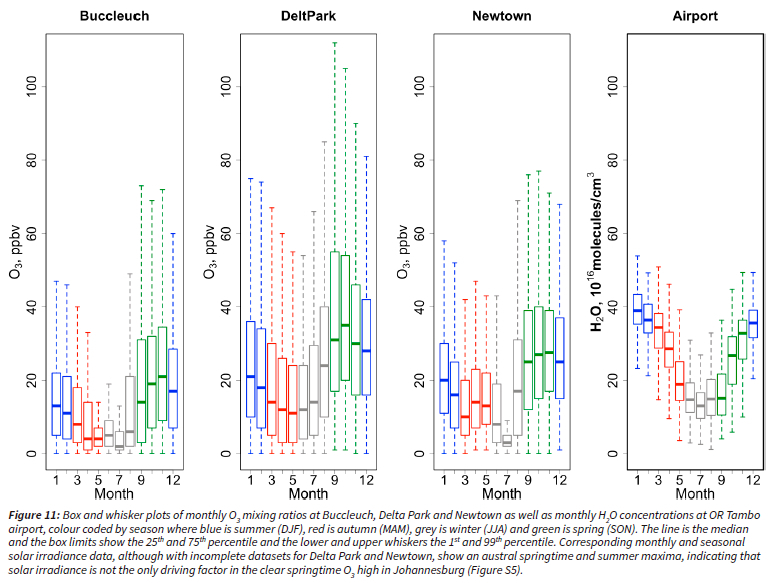
O3 mixing ratios displayed a clear seasonality in CoJ (Figure 11), consistent with findings from the 2000 SAFARI field campaigns (Swap et al., 2002a) as well as from sites in north-eastern South Africa (Govender and Sivakumar, 2019; Laban et al., 2018). Buccleuch, Delta Park and Newtown experienced the highest ground-level O3 mixing ratios in the springtime, and notably the highest values were recorded at Delta Park (Figure 11). The seasonality of NO at all sites peaked in the wintertime, consistent with a shallow winter boundary layer and increased burning of domestic fuel for heating (Figure S6). NO2 mixing ratios did not have as clear of a seasonality, although they peaked slightly during the wintertime (Figure S7). However, the magnitude of the NO2 mixing ratios is different between each site with implications for O3 production (Figure 8, S7, S8 and S9). Indeed, Ox mixing ratios also peaked in the spring at all sites (Figure S9), indicative of higher O3 production rates.
We also isolated average springtime Ox mixing ratios as a function of time-of-day to estimate changes in O3 production in the spring (Figure 9). Clearly, springtime Ox increased at all stations and during each hour of the day compared to annual means (Figure 9, dashed lines). At Buccleuch, Delta Park and Newtown, the average estimated O3 production rates from the calculated instantaneous Ox production rates during the spring are 4.8 ppb h-1, 3.7 ppb h-1 and 3.1 ppb h-1, respectively (Figure 9). These values are all higher than the calculated P(Ox) values using the data from all seasons, indicating that O3 production rates may be faster in the spring. Springtime O3 highs are therefore consistent with (1) increased O3 production and with (2) increased Ox even during the nighttime. The following section explores potential mechanisms leading to increased O3 production rates.
Mechanism for springtime increased O3 production rates and the role of RH
High O3 mixing ratios in the spring over CoJ may be attributed to meteorological effects, such as solar irradiance, relative humidity, temperature, stratospheric intrusions, etc. In addition to enhanced photochemical production, large synoptic effects may also impact springtime O3 in CoJ by bringing in air masses with different precursors, such as biomass burning events (Laban et al., 2018; Swap et al., 2002b). In comparison to South Africa, North American and European cities have documented peak seasonal O3 in summertime correlated to peak solar irradiance (Petetin et al., 2018; Pusede et al., 2015). Peak summertime O3 across the United States has also been shown to correlate with low relative humidity through a mechanism involving dry deposition to leaf stomata (Kavassalis and Murphy, 2017). On the other hand, springtime O3 has recently been shown to correlate with relative humidity in the interior of South Africa (Laban et al., 2020). Finally, there is evidence of springtime O3 highs in the western US due to stratospheric intrusions of high altitude cites (Lin et al., 2012). There is the possibility that springtime O3 caused by stratospheric O3 intrusions could also be relevant for CoJ, which lies on the Gauteng plateau at 1750 m a.s.l. Mkololo et al., (2020) identified these phenomena using sonde data at a site approximately 30 km northeast of Delta Park, indicating the potential of O3 intrusions in CoJ. Here, we further explore the mechanisms behind the seasonality of O3 with data available at the monitoring sites.
CoJ has a dry winter season and a wet summer season, although summertime cloud cover often occurs in the evenings accompanied by thunderstorms. We had access to solar irradiance (Figure S5) and temperature at Buccleuch, Delta Park and Newtown as well as dew point temperature data from a nearby location which we used to calculate H2O concentrations (Figure 12) to investigate a seasonal meteorological effect on O3.
Minor role of solar irradiance and temperature
The seasonality of the solar irradiance shows that springtime irradiance is similar to summertime, and slightly higher than in wintertime (Figure S5, where the Buccleuch data is the most complete and reliable). This observation suggests that increased irradiance is not the primary driver of increased O3 mixing ratios in the spring. Furthermore, O3 exceedances at Buccleuch were not found to correlate with temperature (Figure S4), and thus temperature is unlikely to be responsible for seasonal O3 variability (Wilkinson et al., 2012).
Intermediate role of O3 precursor emissions
Next, we considered O3 precursor emissions. Veld fires are common during the dry winters in CoJ and emit large concentrations of aerosols (Hersey et al., 2015; Segakweng et al., 2022). In fact, biomass burning has been identified as the instigator for high O3 events such as those over Pretoria 12 Sept 1985 (Pillay et al., 1994) and in the Vaal Priority Area on 2 June 2013 (Feig et al., 2014). There is also recent evidence of an aerosol-inhibited regime where O3 mixing ratios are reduced due to heterogeneous chemistry (Ivatt et al., 2022). Particulate matter concentrations in CoJ are highest in the wintertime (Hersey et al., 2015) concurrently with the lowest O3 mixing ratios and thus this aerosol-inhibited mechanism would be worth exploring for South Africa. However, if biomass burning was responsible for increased O3 production, we would have expected the seasonality of O3 to start peaking in mid-winter, which is clearly not observed. So why is the onset of high Ox and high O3 only in August-September?
Major role of H2O concentrations
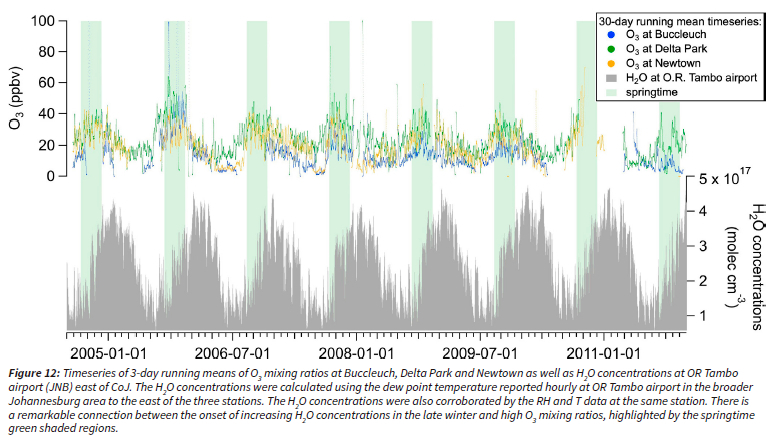
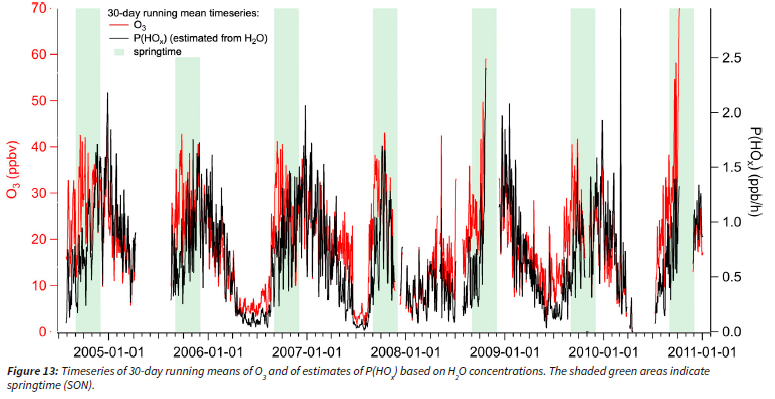
We found the most interesting meteorological phenomena in the H2O data, where the H2O concentrations drop by a factor of 6 in the springtime (Figure 12). We used RH and dew point temperature data from OR Tambo International Airport situated just east of the CoJ, and available by the Global Hourly Integrated Surface Database hosted by NOAA. CoJ experiences dry winters, with seasonal H2O concentrations dropping to ~5 x 10¹⁶ molec/ cm3 in August (Figure 12). Since water vapour is necessary for OH radical production and consequently for the initiation of VOC oxidation leading to O3 formation, it is likely that wintertime O3 production is suppressed by slow initiation chemistry. To verify this hypothesis, we estimated the production of HOx (P(HOx)) radicals using Eq.1 (see SI), and subsequently used this value to estimate OH radical concentrations (Eq. 2 in the SI) (Figure 13). The calculation of OH radicals require CO and NO data and so we did this analysis for the Newtown station only, using the H2O concentrations from OR Tambo. We find a clear correlation between the onset of P(HOx), the increase in OH radicals and the increase O3 in the spring (Figure 13).
Therefore, despite the presence of VOC and NOx precursors, low O3 production rates occur in the wintertime due to the low oxidative capacity, including low OH radical concentrations, of the atmosphere to initiate VOC oxidation and to drive R4 in Figure 1. However, when the first spring rain events occur in September, and average H2O concentrations increase, the rate of R4 increases, kickstarting O3 production rates. All the necessary precursors are then present and abundant; VOC and NOx concentrations are high in the wintertime polluted shallow boundary layer, and facilitate radical chemistry propagation leading to O3. Thus, we suggest that springtime O3 production rates increase in CoJ because of sharp increases in RH in the spring, leading to increases in OH radical products and thus to increases in radical initiation rates (R4 in Figure 1).
Laban et al., 2020 observed an anti-correlation between RH and O3 by Pearson correlations over the year at sites in the interior of South Africa. In our dataset, RH and O3 are also anti-correlated (Figure S12). We further emphasize the importance of measuring H2O concentrations rather than RH in order to estimate P(HOx).
Conclusion and outlook
Exceedances
We conducted a study on ground-level ozone (O3) and its precursors in the City of Johannesburg looking specifically at three different sites, Buccleuch, Delta Park and Newtown, in traffic-, residential- and urban-influenced areas, respectively, from 2004-2011. O3 and NO2 yearly exceedances showed inverse correlations; stations with large O3 exceedances showed low NO2 exceedances and vice versa. Indeed, Delta Park station is located furthest away from NO point emissions in a residential area and experienced a high number of O3 exceedances. A clear weekend effect was also observed at all locations where NOx concentrations, associated with transport, were significantly reduced by up to 80 ppbv on weekends, which led to higher O3 mixing ratios. The hourly continuous data of O3 mixing ratios presented in this study are informative for potential health impacts of O3 pollution in South Africa, an impact only qualitatively captured by previous monthly passive sampling data.
VOC-limited regime
The air quality monitoring data at the three distinctively different sites suggest a VOC-limited regime for O3 production across the entire city. Identifying Johannesburg's O3 production rate and regime allows us to speculate on the most effective mitigation strategies for air quality. Reducing NOx concentrations by mandatory catalytic converters on engine exhausts for example would in fact increase O3 production kinetics (assuming CO and VOC emissions are unaffected) near the highways. Rather, a more effective short-term strategy in reducing O3 in the city may be to reduce anthropogenic CO and VOC emissions. Yet, VOC measurements in Johannesburg do not exist in the literature; a clear gap to be addressed for effective air quality management in Johannesburg. Decreasing VOC emissions alongside NOx emissions would lead to a more effective strategy to reducing O3 production in Johannesburg. As the urban plume moves further away from CoJ, less NO2 will be converted to NO and thus less O3 will be formed (R1 in Figure 1). Additional measurements at rural receptor sites in the City's outflow are needed to improve our understanding on the City's regional impact.
Springtime O3 and the role of H2O
We are proposing that increases in H2O concentrations during the first springtime rains in CoJ initiate spring-time ozone air pollution episodes. Radical chemistry is slow during dry winters despite the presence of O3 precursors such as VOCs from biomass burning and NO from traffic emissions in a low boundary layer. There is a clear correlation between the onset of rainfall in CoJ and the onset of P(HOx) production (Figure 13), despite the presence of an anti-correlation between RH and O3 as observed here (Figure S12) and by Laban et al. 2020. We therefore hypothesize that changes in climate in CoJ in a warming future could lead to significant changes in ozone pollution in CoJ and in South Africa.
In all, this study further highlights the importance of long-term monitoring data in general to better understand and hence address air pollution in the hope of improving air quality, and human exposure to airborne pollutants.
Acknowledgements
This work was supported by a Parliamentary Grant of the CSIR. The authors would like to thank the South African Weather Service for their assistance with SAAQIS, from where the air quality data for the City of Johannesburg was accessed. The authors also acknowledge preliminary work on a 2005 O3 episode by Yerdashin Padayachi and Tirusha Thambiran.
Author contributions
N.B.D and R.G. conceptualized and led the study. N.B.D and R.G. collected the data and N.B.D analysed and interpretated the data with help from R.G., M.N., B.Z and J.G.. N.B.D. wrote the manuscript and all authors contributed to the revisions.
References
Archibald, S., Scholes, R.J., Roy, D.P., Roberts, G., Boschetti, L., Archibald, S., Scholes, R.J., Roy, D.P., Roberts, G., Boschetti, L., 2010. Southern African fire regimes as revealed by remote sensing. Int. J. Wildland Fire 19, 861-878. https://doi.org/10.1071/WF10008 [ Links ]
Balashov, N.V., Thompson, A.M., Piketh, S.J., Langerman, K.E., 2014. Surface ozone variability and trends over the South African Highveld from 1990 to 2007. J. Geophys. Res. Atmospheres 119, 4323-4342. https://doi.org/10.1002/2013JD020555 [ Links ]
Carslaw, D.C., 2005. Evidence of an increasing NO2/NOx emissions ratio from road traffic emissions. Atmos. Environ. 39, 4793-4802. https://doi.org/10.1016/j.atmosenv.2005.06.023 [ Links ]
Clapp, L.J., Jenkin, M.E., 2001. Analysis of the relationship between ambient levels of O3, NO2 and NO as a function of NOx in the UK. Atmos. Environ. 35, 6391-6405. https://doi.org/10.1016/S1352-2310(01)00378-8 [ Links ]
CSIR, Airshed Professionals, 2019. City of Johannesburg Air Quality Management Plan. https://saaqis.environment.gov.za/Pagesfiles/City%20of%20Johannesburg%20%20AQMP%202019.pdf [ Links ]
Diab, R.D., Thompson, A.M., Mari, K., Ramsay, L., Coetzee, G.J.R., 2004. Tropospheric ozone climatology over Irene, South Africa, from 1990 to 1994 and 1998 to 2002. J. Geophys. Res. Atmospheres 109, D20301. https://doi.org/10.1029/2004JD004793 [ Links ]
Feig, G., Ncipha, X., Naidoo, S., Mabaso, D., Ngcukana, N., Tshehla, C., Masuku, N., 2014. Analysis of a period of elevated ozone concentration reported over the Vaal Triangle on 2 June 2013. Clean Air J. 24, 10-16. https://doi.org/10.17159/caj/2014/24/1.7051 [ Links ]
Geddes, J.A., Murphy, J.G., Wang, D.K., 2009. Long term changes in nitrogen oxides and volatile organic compounds in Toronto and the challenges facing local ozone control. Atmos. Environ. 43, 3407-3415. https://doi.org/10.1016/j.atmosenv.2009.03.053 [ Links ]
GeoTerraImage, 2018. South African National Land-Cover 2018 Report and Accuracy Assessment. https://egis.environment.gov.za/sa_national_land_cover_datasets [ Links ]
Giglio, L., Csiszar, I., Justice, C.O., 2006. Global distribution and seasonality of active fires as observed with the Terra and Aqua Moderate Resolution Imaging Spectroradiometer (MODIS) sensors. J. Geophys. Res. Biogeosciences 111. https://doi.org/10.1029/2005JG000142 [ Links ]
Govender, K., Sivakumar, V., 2019. A decadal analysis of particulate matter (PM25) and surface ozone (O3) over Vaal Priority Area, South Africa. Clean Air J. 29. https://doi.org/10.17159/caj/2019/29/2.7578 [ Links ]
Hersey, S.P., Garland, R.M., Crosbie, E., Shingler, T., Sorooshian, A., Piketh, S., Burger, R., 2015. An overview of regional and local characteristics of aerosols in South Africa using satellite, ground, and modeling data. Atmospheric Chem. Phys. 15, 4259-4278. https://doi.org/10.5194/acp-15-4259-2015 [ Links ]
Ivatt, P.D., Evans, M.J., Lewis, A.C., 2022. Suppression of surface ozone by an aerosol-inhibited photochemical ozone regime. Nat. Geosci. 1-5. https://doi.org/10.1038/s41561-022-00972-9 [ Links ]
Jacobs, D.J., 1999. Introduction to Atmospheric Chemistry, Introduction to Atmospheric Chemistry. Princeton University Press, Princeton, New Jersey. [ Links ]
Josipovic, M., Annegarn, H., Kneen, M., Pienaar, J., Piketh, S., 2010. Concentrations, distributions and critical level exceedance assessment of SO2, NO2 and O3 in South Africa. Environ. Monit. Assess. 171, 181-196. https://doi.org/10.1007/s10661-009-1270-5 [ Links ]
Kavassalis, S.C., Murphy, J.G., 2017. Understanding ozone-meteorology correlations: A role for dry deposition. Geophys. Res. Lett. 44, 2922-2931. https://doi.org/10.1002/2016GL071791 [ Links ]
Krohm, H.J., 1993. 10 Years of photo-chemical smog monitoring in Johannesburg. Proc. Natl. Assoc. Clean Air NACA 8, 8-18. http://www.cleanairjournal.org.za/download/hkrohm_1993.pdf [ Links ]
Laban, T.L., Van Zyl, P.G., Beukes, J.P., Mikkonen, S., Santana, L., Josipovic, M., Vakkari, V., Thompson, A.M., Kulmala, M., Laakso, L., 2020. Statistical analysis of factors driving surface ozone variability over continental South Africa. J. Integr. Environ. Sci. 17, 1-28. https://doi.org/10.1080/1943815X.2020.1768550 [ Links ]
Laban, T.L., Zyl, P.G. van, Beukes, J.P., Vakkari, V., Jaars, K., Borduas-Dedekind, N., Josipovic, M., Thompson, A.M., Kulmala, M., Laakso, L., 2018. Seasonal influences on surface ozone variability in continental South Africa and implications for air quality. Atmospheric Chem. Phys. 18, 15491-15514. https://doi.org/10.5194/acp-18-15491-2018 [ Links ]
Legislation, 2005. National Environmental Management: Air Quality Act No. 39 of 2004. https://cer.org.za/virtual-library/legislation/national/air-quality/national-environmental-management-air-quality-act-2004 [ Links ]
Limpert, E., Stahel, W.A., Abbt, M., 2001. Log-normal Distributions across the Sciences: Keys and CluesOn the charms of statistics, and how mechanical models resembling gambling machines offer a link to a handy way to characterize log-normal distributions, which can provide deeper insight into variability and probability-normal or log-normal: That is the question. BioScience 51, 341-352. https://academic.oup.com/bioscience/article/51/5/341/243981 [ Links ]
Lin, M., Fiore, A.M., Cooper, O.R., Horowitz, L.W., Langford, A.O., Levy II, H., Johnson, B.J., Naik, V., Oltmans, S.J., Senff, C.J., 2012. Springtime high surface ozone events over the western United States: Quantifying the role of stratospheric intrusions. J. Geophys. Res. Atmospheres 117. https://doi.org/10.1029/2012JD018151 [ Links ]
Lourens, A.S.M., Beukes, J.P., Van, P.G., Fourie, G.D., Burger, J.W., Pienaar, J.J., Read, C.E., Jordaan, J.H., 2011. Spatial and temporal assessment of gaseous pollutants in the Highveld of South Africa. South Afr. J. Sci. 107, 1-8. https://doi.org/10.4102/sajs.v107i1/2.269 [ Links ]
Lukey, Peter, Mdluli, Thulie, Phoshoko, Mathabo, Songxaba, Bathabile, Mafumo, Humbu, Molokwane, Gift, 2011. Highveld Priority Area Air Quality Management Plan. http://www.saaqis.org.za/documents/HIGHVELD%20PRIORITY%20AREA%20AQMP.pdf [ Links ]
Maseko, B., Feig, G., Burger, R., 2021. Estimating lightning NOx production over South Africa. South Afr. J. Sci. 117. https://doi.org/10.17159/sajs.2021/8035 [ Links ]
Mazzeo, N.A., Venegas, L.E., Choren, H., 2005. Analysis of NO, NO2, O3 and NOx concentrations measured at a green area of Buenos Aires City during wintertime. Atmos. Environ. 39, 30553068. https://doi.org/10.1016/j.atmosenv.2005.01.029 [ Links ]
Mills, G., Pleijel, H., Malley, C.S., Sinha, B., Cooper, O.R., Schultz, M.G., Neufeld, H.S., Simpson, D., Sharps, K., Feng, Z., Gerosa, G., Harmens, H., Kobayashi, K., Saxena, P., Paoletti, E., Sinha, V., Xu, X., 2018. Tropospheric Ozone Assessment Report: Present-day tropospheric ozone distribution and trends relevant to vegetation. Elem. Sci. Anthr. 6, 47. https://doi.org/10.1525/elementa.302 [ Links ]
Mkololo, T., Mbatha, N., Sivakumar, V., Bègue, N., Coetzee, G., Labuschagne, C., 2020. Stratosphere-Troposphere Exchange and O3 Variability in the Lower Stratosphere and Upper Troposphere over the Irene SHADOZ Site, South Africa. Atmosphere 11, 586. https://doi.org/10.3390/atmos11060586 [ Links ]
Molewa, B.E.E., 2012. Declaration of the Waterberg National Priority Area. https://www.dffe.gov.za/sites/default/files/gazetted_notices/nemaqa_waterberg_declaration_g35435gen495_0.pdf [ Links ]
Monks, P.S., Archibald, A.T., Colette, A., Cooper, O., Coyle, M., Derwent, R., Fowler, D., Granier, C., Law, K.S., Mills, G.E., Stevenson, D.S., Tarasova, O., Thouret, V., von Schneidemesser, E., Sommariva, R., Wild, O., Williams, M.L., 2015. Tropospheric ozone and its precursors from the urban to the global scale from air quality to short-lived climate forcer. Atmos Chem Phys 15, 8889-8973. https://doi.org/10.5194/acp-15-8889-2015 [ Links ]
Murphy, J.G., Day, D.A., Cleary, P.A., Wooldridge, P.J., Millet, D.B., Goldstein, A.H., Cohen, R.C., 2007. The weekend effect within and downwind of Sacramento - Part 1: Observations of ozone, nitrogen oxides, and VOC reactivity. Atmos.Chem.Phys. 7, 53275339. https://doi.org/10.5194/acp-7-5327-2007 [ Links ]
Murphy, J.G., Day, D.A., Cleary, P.A., Wooldridge, P.J., Millet, D.B., Goldstein, A.H., Cohen, R.C., 2006. The weekend effect within and downwind of Sacramento: Part 2. Observational evidence for chemical and dynamical contributions. Atmos Chem Phys Discuss 2006, 11971-12019. https://doi.org/10.5194/acpd-6-11971-2006 [ Links ]
Nikolic, G., Chan, M., Pringle, R., 2005. Planning and Implementing a Full Closure of the Highway 401 Express Lanes with the Help of Micro-simulation. Presented at the 2005 Annual Conference of the Transportation Association of CanadaTransportation Association of Canada (TAC). https://trid.trb.org/view/798210 [ Links ]
Parks Tau, M., Fowler, T., 2016. 2012-2016 Integrated Development Plan "Turning Challenges into Opportunities." City of Johannesburg. https://www.joburg.org.za/documents_/Documents/Intergrated%20Development%20Plan/IDP%20REVIEW.pdf [ Links ]
Petetin, H., Sauvage, B., Smit, H.G.J., Gheusi, F., Lohou, F., Blot, R., Clark, H., Athier, G., Boulanger, D., Cousin, J.-M., Nedelec, P., Neis, P., Rohs, S., Thouret, V., 2018. A climatological view of the vertical stratification of RH, O3 and CO within the PBL and at the interface with free troposphere as seen by IAGOS aircraft and ozonesondes at northern mid-latitudes over 19942016. Atmospheric Chem. Phys. 18, 9561-9581. https://doi.org/10.5194/acp-18-9561-2018 [ Links ]
Pillay, Y., Diab, R.D., Sokolic, F., 1994. Ozone maxima off the east coast of South Africa: The role of biomass burning. Clean Air J. 9, 25-28. https://doi.org/10.17159/caj/1994/9/1.7115 [ Links ]
Pusede, S.E., Steiner, A.L., Cohen, R.C., 2015. Temperature and Recent Trends in the Chemistry of Continental Surface Ozone. Chem. Rev. 115, 3898-3918. https://doi.org/10.1021/cr5006815 [ Links ]
Raghunandan, A., Mahumane, G., Diab, R., 2007. Elevated ozone events over Johannesburg based on analysis of tropospheric ozone partial columns: research letters. South Afr. J. Sci. 103, 248-252. http://reference.sabinet.co.za/webx/access/electronic_journals/sajsci/sajsci_v103_n5_a18.pdf [ Links ]
Rorich, R.P., Galpin, J.S., 1998. Air quality in the Mpumalanga Highveld region, South Africa. South Afr. J. Sci. 94, 109-114. https://journals.co.za/content/sajsci/94/3/AJA00382353_133 [ Links ]
Schwela, D., 2012. Review of urban air quality in Sub-Saharan Africa region - air quality profile of SSA countries (No. 67794). The World Bank. http://documents.worldbank.org/curated/en/936031468000276054/Review-of-urban-air-quality-in-Sub-Saharan-Africa-region-air-quality-profile-of-SSA-countries [ Links ]
Segakweng, C.K., van Zyl, P.G., Liousse, C., Beukes, J.P., Swartz, J.-S., Gardrat, E., Dias-Alves, M., Language, B., Burger, R.P., Piketh, S.J., 2022. Measurement report: Size-resolved chemical characterisation of aerosols in low-income urban settlements in South Africa. Atmospheric Chem. Phys. Discuss. 1-58. https://doi.org/10.5194/acp-2021-1026 [ Links ]
Sillman, S., 2003. Tropospheric ozone and photochemical smog, in: Holland, H.D., Turekian, K.K. (Eds.), Treatise on Geochemistry. Elsevier-Pergammon, Oxford, pp. 407-432. [ Links ]
Sokhi, R.S., Singh, V., Querol, X., Finardi, S., Targino, A.C., Andrade, M. de F., Pavlovic, R., Garland, R.M., Massagué, J., Kong, S., Baklanov, A., Ren, L., Tarasova, O., Carmichael, G., Peuch, V.-H., Anand, V., Arbilla, G., Badali, K., Beig, G., Belalcazar, L.C., Bolignano, A., Brimblecombe, P., Camacho, P., Casallas, A., Charland, J.-P., Choi, J., Chourdakis, E., Coll, I., Collins, M., Cyrys, J., da Silva, C.M., Di Giosa, A.D., Di Leo, A., Ferro, C., Gavidia-Calderon, M., Gayen, A., Ginzburg, A., Godefroy, F., Gonzalez, Y.A., Guevara-Luna, M., Haque, Sk.M., Havenga, H., Herod, D., Horrak, U., Hussein, T., Ibarra, S., Jaimes, M., Kaasik, M., Khaiwal, R., Kim, J., Kousa, A., Kukkonen, J., Kulmala, M., Kuula, J., La Violette, N., Lanzani, G., Liu, X., MacDougall, S., Manseau, P.M., Marchegiani, G., McDonald, B., Mishra, S.V., Molina, L.T., Mooibroek, D., Mor, S., Moussiopoulos, N., Murena, F., Niemi, J.V., Noe, S., Nogueira, T., Norman, M., Pérez-Camano, J.L., Petäjä, T., Piketh, S., Rathod, A., Reid, K., Retama, A., Rivera, O., Rojas, N.Y., Rojas-Quincho, J.P., San José, R., Sanchez, O., Seguel, R.J., Sillanpää, S., Su, Y., Tapper, N., Terrazas, A., Timonen, H., Toscano, D., Tsegas, G., Velders, G.J.M., Vlachokostas, C., von Schneidemesser, E., Vpm, R., Yadav, R., Zalakeviciute, R., Zavala, M., 2021. A global observational analysis to understand changes in air quality during exceptionally low anthropogenic emission conditions. Environ. Int. 157, 106818. https://doi.org/10.1016/j.envint.2021.106818 [ Links ]
Sonjica, B.P., 2009. National Environmental Management: Air Quality Act, 2004 (ACT NO. 39 OF 2004) National Ambient Air Quality Standards 4. https://www.iea.org/policies/13185-national-environmental-management-air-quality-act-39-of-2004 [ Links ]
Stevens, C.S., 1987. Ozone formation in the greater Johannesburg region. Atmospheric Environ. 1967 21, 523-530. https://doi.org/10.1016/0004-6981(87)90035-7 [ Links ]
Swap, R.J., Annegarn, H.J., Otter, L., 2002a. Southern African Regional Science Initiative (SAFARI 2000): summary of science plan. South Afr. J. Sci. 98, 119-124. http://journals.co.za/content/sajsci/98/3-4/EJC97440 [ Links ]
Swap, R.J., Annegarn, H.J., Suttles, J.T., Haywood, J., Helmlinger, M.C., Hely, C., Hobbs, P.V., Holben, B.N., Ji, J., King, M.D., Landmann, T., Maenhaut, W., Otter, L., Pak, B., Piketh, S.J., Platnick, S., Privette, J., Roy, D., Thompson, A.M., Ward, D., Yokelson, R., 2002b. The Southern African Regional Science Initiative (SAFARI 2000): overview of the dry season field campaign. South Afr. J. Sci. 98, 125-130. http://journals.co.za/content/sajsci/98/3-4/EJC97439 [ Links ]
The South African National Roads Agency LTD, 2016. https://www.arrivealive.mobi/The-South-African-National-Roads-Agency-LTD. [ Links ]
Thompson, A.M., Witte, J.C., Smit, H.G.J., Oltmans, S.J., Johnson, B.J., Kirchhoff, V.W.J.H., Schmidlin, F.J., 2007. Southern Hemisphere Additional Ozonesondes (SHADOZ) 19982004 tropical ozone climatology: 3. Instrumentation, station-to-station variability, and evaluation with simulated flight profiles. J. Geophys. Res. Atmospheres 112, D03304. https://doi.org/10.1029/2005JD007042 [ Links ]
US EPA, O., 2020. Ozone National Ambient Air Quality Standards (NAAQS) [WWW Document]. URL https://www.epa.gov/ground-level-ozone-pollution/ozone-national-ambient-air-quality-standards-naaqs (accessed 8.9.22). [ Links ]
van Schalkwyk, M., 2007. National Environmental Management: Air Quality Act, 2004 (Act No. 39 of 2004), Declaration of the Highveld Priority Area in terms of Section 18(1) of the National Environmental Management: Air Quality Act, 2004 (Act No. 39 of 2004) (No. No. 1123). https://www.gov.za/sites/default/files/gcis_document/201409/30518.pdf [ Links ]
van Schalkwyk, M., 2006. Declaration of the Vaal Triangle Airshed Priority Area in terms of Section 18(1) of the National Environmental Management: Air Quality Act, 2004 (Act No. 39 of 2004) (No. No. 365). https://www.gov.za/sites/default/files/gcis_document/201409/28732b.pdf [ Links ]
Venter, A.D., Vakkari, V., Beukes, J.P., Zyl, P.G.V., Laakso, H., Mabaso, D., Tiitta, P., Josipovic, M., Kulmala, M., Pienaar, J.J., Laakso, L., 2012. An air quality assessment in the industrialised western Bushveld Igneous Complex, South Africa. South Afr. J. Sci. 108, 10 Pages. https://doi.org/10.4102/sajs.v108i9/10.1059 [ Links ]
Washington Post, 2007. At a Glance 1. http://www.washingtonpost.com/wp-dyn/content/article/2007/07/17/AR2007071701826.html [ Links ]
Wilkinson, S., Mills, G., Illidge, R., Davies, W.J., 2012. How is ozone pollution reducing our food supply? J. Exp. Bot. 63, 527536. https://doi.org/10.1093/jxb/err317 [ Links ]
Witte, J.C., Thompson, A.M., Smit, H.G.J., Fujiwara, M., Posny, F., Coetzee, G.J.R., Northam, E.T., Johnson, B.J., Sterling, C.W., Mohamad, M., Ogino, S.-Y., Jordan, A., da Silva, F.R., 2017. First reprocessing of Southern Hemisphere ADditional OZonesondes (SHADOZ) profile records (1998-2015): 1. Methodology and evaluation. J. Geophys. Res. Atmospheres 122, 2016JD026403. https://doi.org/10.1002/2016JD026403 [ Links ]
Wooldridge, P.J., Perring, A.E., Bertram, T.H., Flocke, F.M., Roberts, J.M., Singh, H.B., Huey, L.G., Thornton, J.A., Wolfe, G.M., Murphy, J.G., Fry, J.L., Rollins, A.W., LaFranchi, B.W., Cohen, R.C., 2010. Total Peroxy Nitrates (Sigma;PNs) in the atmosphere: the Thermal Dissociation-Laser Induced Fluorescence (TD-LIF) technique and comparisons to speciated PAN measurements. Atmospheric Meas. Tech. 3, 593-607. https://doi.org/10.5194/amt-3-593-2010 [ Links ]
World Health Organization, 2021. WHO global air quality guidelines: particulate matter (PM2.5 and PM10), ozone, nitrogen dioxide, sulfur dioxide and carbon monoxide. World Health Organization, Geneva. https://apps.who.int/iris/handle/10665/345329 [ Links ]
Xu, Zheng, Nie, W., Chi, X., Huang, X., Zheng, L., Xu, Zhengning, Wang, J., Xie, Y., Qi, X., Wang, X., Xue, L., Ding, A., 2018. Ozone from fireworks: Chemical processes or measurement interference? Sci. Total Environ. 633, 1007-1011. https://doi.org/10.1016/j.scitotenv.2018.03.203 [ Links ]
Zunckel, M., Venjonoka, K., Pienaar, J.J., Brunke, E.-G., Pretorius, O., Koosialee, A., Raghunandan, A., van Tienhoven, A.M., 2004. Surface ozone over southern Africa: synthesis of monitoring results during the Cross border Air Pollution Impact Assessment project. Atmos. Environ. 38, 6139-6147. https://doi.org/10.1016/j.atmosenv.2004.07.029 [ Links ]
Supplementary material
Supplementary material can be accessed at https://cleanairjournal.org.za/article/view/15367
Received: 22 December 2022
Reviewed: 14 March 2023
Accepted: 4 May 2023
* Corresponding author: borduas@chem.ubc.ca

