


Services on Demand
Article
 English (pdf)
 Article in xml format
 Article references
Indicators

Related links
-
 Cited by Google
 -
 Similars in Google
Share

 Permalink
Clean Air Journal
On-line version ISSN 2410-972X
Print version ISSN 1017-1703
Clean Air J. vol.32 n.2 Pretoria 2022
http://dx.doi.org/10.17159/caj/2022/32/2.13470
RESEARCH ARTICLE
Using student science to identify research priority areas for air pollution in a university environment: an Ethiopian case study
Johannes Dirk DingemanseI; Muse Abayneh AbiyuII; Kirubel Getachew TesfayeIII; Feyera Fekadu RoroII
IFaculty of Water Supply and Environmental Engineering, Water Technology Institute, Arba Minch University, Ethiopia
IIWater Technology Institute, Arba Minch University, Ethiopia
IIIEvenactions, Canada
ABSTRACT
Students in a country like Ethiopia face a double air pollution challenge: they are frequently exposed (both outdoors and indoors) to sources of incomplete combustion and therefore to unhealthy concentrations of particulate matter (PM25) and carbon monoxide (CO), while they also face increased carbon dioxide (CO2) concentrations in crowded dormitories and classrooms. Research on air pollution in the environment of Ethiopian students is scarce. This lack of research can be fixed by involving students in science through a student science project, essentially a subset of citizen science. Students of Arba Minch University, Ethiopia, conducted measurements of PM25, CO, and CO2 under self-selected circumstances. Their measurements are compared to guideline values related to health effects to identify priority areas for future research. For PM25, students' measurements show likely exceedances of guideline values for an inside coffee ceremony, close to open waste burning, at a bus station and close to a diesel generator. For CO, exceedances are revealed in kitchens and the visitor's area of restaurants using biomass fuel, close to outdoor charcoal cooking and close to waste burning. For CO2, exceedances are found within student dormitories. These areas can be considered priority areas for further research. Students can conduct additional measurements to distinguish other relevant scenarios. Insight into exposure can be improved if, besides different concentrations under different circumstances, also time durations of these different circumstances are studied. The findings reveal that students themselves can be a partial solution to research and resource gaps in their context.
Keywords: Air pollution, PM25, CO, CO2, biomass burning, campus exposure, student measurements, citizen science, student science
Introduction
Air pollution poses one of the biggest current threats to health worldwide (Babatola, 2018; Gakidou et al., 2017; Shaddick et al., 2018). Ambient (outdoor) air pollution is estimated to cause 4.2 million premature deaths worldwide each year, especially due to exposure to particles with a diameter smaller than 2.5 μηι (PM25) (World Health Organization, 2018a; data for 2016). Another 3.8 million premature deaths can be attributed to indoor (household) air pollution (World Health Organization, 2018b). The burden of these premature deaths is especially carried by low- and middle-income countries, where air pollutant emissions are more prevalent due to the use of solid fuels like wood, charcoal, and dung as well as open kerosene fires (World Health Organization, 2018b). Besides particulate matter (PM2.5), carbon monoxide (CO) is a common indicator of household air pollution (Leavey et al., 2015). Both PM25 and CO are products from incomplete combustion, so higher exposure can be expected when people are close to combustion sources like traffic, waste burning or cooking practices.
While PM2.5 and CO are useful measures of combustion-related air pollution, universities' indoor air quality measures often focus on carbon dioxide (CO2). CO2 is an indicator of quality of ventilation, and increased CO2 concentrations have adverse health effects and on cognitive performance by causing drowsiness, headache, and loss of attention (Soomro et al., 2019). Such effects are a problem at campuses, where both a great deal of brainwork is needed, and a lot of people might gather in less-ventilated spaces.
Research on air quality and air pollution disproportionally favours some settings and scenarios over others. For instance, while outdoors air pollution is justifiably a focus of much research worldwide, work that considers it in relation to schooling tends to be limited to higher income countries, and little is known about the impact of air pollution for students in lower income countries (Chen, 2018). Likewise, while ventilation research has been conducted in a range of European countries, the USA, UAE, and India (Soomro et al., 2019), and indoor and outdoor measurements of air quality exist for universities in Spain and China (Alves et al., 2020) such studies are again rare for lower income countries. And yet it is precisely in lower income countries, where the topic of air quality in relation to higher education is especially urgent. For instance, students in a country like Ethiopia must deal with a combination of these air quality challenges. They frequently encounter combustion sources such as open waste burning, cooking with biomass fuels, and traffic consisting of older vehicles. Also, they spend a lot of time in crowded dormitories and classrooms.
As the lack of research clearly is not because of a lack of relevance, it must be due to a lack of awareness and/or resources. One of the most promising ways to tackle both awareness and resources problems, is to crowd-source measurements using relatively low-tech methods that can be widely deployed. This falls under the umbrella of Citizen Science: science carried out at least in part by lay people or by a broader community than professional researchers (Kimura & Kinchy, 2016). For the topic of air quality in higher education specifically, a particularly promising approach is Student Science: to let students conduct science, as part of the students' curriculum (Dingemanse & Dingemanse-de Wit, 2022). This combines the benefits of crowdsourcing associated with Citizen Science with the additional educational value offered by participatory research (Zoellick et al., 2012). Especially for work that focuses on students' environments, an obvious advantage is that students have easy access to their own environment, while it at the same time raises their awareness on such issues.
Here we report first results of a participatory research approach to crowdsourcing measurements in an institution of higher education in Arba Minch, Ethiopia. Students of Arba Minch University have conducted measurements of PM25, CO, and CO2 in a variety of self-selected air quality circumstances in their environment. This case of Student Science has been subject to a study in which it is found that Student Science can serve both scientific and educational needs typical for a university in Ethiopia (Dingemanse & Dingemanse-de Wit, 2022). The current study focuses on that scientific side and makes two main contributions. First, in several cases the measurements represent the first of their kind for a range of locations and activities that are frequent in many societies worldwide. This includes open waste burning, charcoal cooking, and restaurant kitchens that use biomass fuels, all of which are indicated as priority areas for further research. Second, this study shows that the Student Science research approach can address structural inequalities in access to measurements of air pollution and can improve our understanding of how air quality contributes to health and cognitive performance in societies around the world.
Literature review
PM25 health effects and guideline values
Particles suspended in the air with an aerodynamic diameter smaller than 2.5 micrometre (PM25) are associated with a variety of adverse health effects upon exposure, such as cardiovascular and respiratory diseases (Lu et al., 2015), as well as diabetes, adverse birth outcomes, and others (Feng et al., 2016). The health effects of PM25 are diverse because PM25 can consist out of many different components, including ammoniated sulphate, crustal material, carbonaceous components, oxides, and trace metals (Snider et al., 2016).
Health effects have been witnessed for relatively low concentrations, both for short-term (24-hour) and long-term exposure. In 2005, the World Health Organization (WHO) established guideline values for PM2.5 with respect to the long-and the short-term: an annual average concentration of 10 μg/m3 and a 24-hour average concentration of 25 μg/m3 (World Health Organization, 2006). The annual guideline value was based on earlier research, such as the American Cancer Society's (ACS) study and the Harvard Six-Cities data. These studies showed that health effects can be expected for annual mean concentrations (long-term) already in the range of 11-15 μg/m3. The 24-hour average was based on an average concentration pattern, in which a concentration of 25 μg/m3 can be expected in 1% of the time (99th-percentile) if the annual average concentration is 10 μg/m3. The rationale for a short-term guideline value was provided by studies that showed an increased mortality of 0.5% for every 10 μg/m3 PM10 short-term increment, combined with the assumption that health effects were especially related to the PM25 portion of PM10 (World Health Organization, 2006).
Indeed, newer studies have only added evidence to these findings. Atkinson et al. (2014) found that a short-term 10 μg/ m3 increment of PM2.5 is associated with a 1.04% increase in mortality. Kloog et al. (2013) found even a higher value, 2.8%, while also reporting health effects for every long-term 10 μg/ m3 increment. A threshold below which no damage to health is observed, is not identified (World Health Organization, 2018a). Guideline values for concentrations of PM2 5, therefore, reflect an aim to achieve the lowest concentration of PM possible, instead of a level at which no health effects are expected. In 2021, the WHO has updated the guideline values for PM25 to an annual average of 5 μg/m3 and a 24-hour average concentration of 15 μg/m3, based on a review of newest studies (World Health Organization, 2021).
CO health effects and guideline values
Compared to PM25, the adverse health effects of CO are relatively straightforward. CO binds with haemoglobin (creating COHb), thereby taking the place of oxygen. This results in a reduced transport of oxygen in the body. Health effects of CO are primarily short-term: during exposure to high CO concentrations, there is imminent threat. Unlike PM25, there is a threshold below which no health effects are expected. Guideline values are based on a maximum level of COHb of 2.5% and known variables of CO uptake (World Health Organization, 2000). Based on this, for 15-minute, 30-minute, 1-hour and 8-hour periods the following guideline values are established: 100, 60, 30, 10 mg/m3. This corresponds to 87, 52, 26 and 9 ppm (Boguski, 2006). CO and PM Both for PM2.5 and CO, the main source for harmful concentration levels is incomplete combustion. For this reason, it has been hypothesized that one can be used as a proxy for the other (Northcross et al., 2010), removing the need of studying both. However, there are mixed results in this regard. Amongst other things, the ratio of CO to PM varies over the burn cycle and varies as a function of combustion source (Northcross et al., 2010). Leavey et al. (2015) found that PM2.5 and CO correlated differently to different fuel-related variables.
Besides a variation in ratios from different sources, another aspect influencing the differences is the atmospheric lifetime and baseline atmospheric concentrations (background concentrations). The atmospheric lifetime of PM2.5 is longer than CO, resulting in more transport opportunities for PM2.5 and relative higher background concentrations. For example, Wang et al. (2020) reports background concentrations for PM2.5 in Taiwan of 4.4 μg/m3, while atmospheric concentrations for CO are normally around 0.1 ppm (UCAR, 2017). The background concentration for PM25 is about 50% of the lowest GV, while that of CO is about 1%. In confined places close to combustion sources, both PM2.5 and CO concentrations can become magnitude of orders higher than ambient concentrations. The CO concentration, however, will quickly reduce to non-problematic levels if the source is removed, and will not influence the wider surrounding as much as PM25. A large PM25 source, instead, can influence concentrations in the wider environment and result in a relative higher background concentration.
Besides the difference in emission ratios and atmospheric concentrations, there is also a crucial difference in health effects. For CO, these are primarily short-term (up to even 15-minutes), while those of PM are also related to long-term exposure. For these three reasons, it is relevant to study not only one of the two, but both PM and CO.
CO2 health effects and guideline values
While CO2 is well known as a significant factor in climate change, in relation to air pollution and health effects it is relevant as a ventilation parameter. As humans are a source of CO2, its concentration is an indicator of the quality of the ventilation in a certain space. Atmospheric CO2 concentrations range from 400-500 ppm. Higher concentrations can result in adverse health effects. Severe health effects of CO2 only occur under extremely high concentrations. In 1986, at Lake Nyos in Cameroon multiple people died due to an exposure to estimated CO2 concentrations of 8-10% (i.e., 80 000 - 100 000 ppm) (Rice, 2014); this concentration was caused by a sudden outgassing of CO2 stored in the lake. Rice (2014) reports other adverse health effects, such as decreased lung functioning, from 8500 ppm. Such high levels, however, generally not occur when the primary source is human respiration. At lower levels of CO2, reported effects include drowsiness, loss of attention and headaches (Soomro et al., 2019). Generally, 1000 ppm is used as a threshold to indicate that ventilation is needed. Satish et al. (2012) found that exposure to a concentration of 1000 ppm influenced decision-making performance. Between 1000-2000 ppm symptoms like drowsiness can occur, while exposures in the 2000-5000 ppm range can additionally cause headaches, sleepiness, loss of attention, and so on (Soomro et al., 2019).
Materials and methods
Student science project
Students of Water Supply and Environmental Engineering (WSEE; 139 students, Year 4) and Meteorology and Hydrology (MHD; 26 students, Year 2), Arba Minch University, Ethiopia, worked in groups of 4-6 (total 33 groups) to investigate a self-selected scenario in which they expected air pollution. The students could pick scenarios related to either CO, PM2.5 and/ or CO2. The groups had to produce a measurement plan (and implement feedback on its draft version), before they could conduct measurements of the respective air pollutants. All measurements were conducted in November and December 2019. The first author of this article was the lecturer for the project. The three co-authors were students within the project.
Measurement instruments
The instruments available were a Lascar EL-USB-CO datalogger (for CO, range 1-1,000 ppm), a UCB-PATS+ (for PM25, range 1030,000 μg/m3) and a IQAir Airvisual Pro (for PM25, range 1-1,800 μg/m3 and/or CO2, range 400-10,000 ppm), which we will refer to as ELCO, PATS, and IQAV respectively. The ELCO measures CO based on electrochemistry: CO oxidizes on an electrochemical cell and is transformed into an electric current that is linearly proportional to the concentration. Measurement of PM2.5 by the PATS and IQAV uses light scattering. The amount of scatter, which is related to the number of particles, is detected by a photodetector. The resulting voltage signal is proportional to the mass concentration. CO2 is measured based on nondispersive infrared (NDIR) technology. The instrument has an infrared lamp and an infrared detector. CO2 absorbs infrared light at a specific wavelength; the amount of absorption can be detected. The amount of infrared light being absorbed by CO2 is directly proportional to the CO2 concentration.
Both ELCO and PATS are commonly used in air quality studies with a focus on biomass burning (Chowdhury et al., 2012; Kumar et al., 2015; Leavey et al., 2015; Ochieng et al., 2016; Pennise et al., 2009; Rosa et al., 2014). The IQAV is used worldwide for indoor and ambient air quality monitoring (IQAir, 2020), though to a lesser extent in scientific studies. The measurement principles (light scatter for PM25 and NDIR of CO2) are, however, widely used in other instruments. For PM25 with the IQAV, Massen et al. (2018) found a correlation coefficient with a reference instrument of 0.97. For CO2 with an NDIR instrument (such as the IQAV), Petersen et al. (2018) found a measurement uncertainty of <50 ppm given instruments that are calibrated for temperature influences (which is the case for a -10 to 40°C range). The instruments were factory-calibrated and had not been used before the measurement project, other than for short test measurements.
Data collection procedures
For the PATS, the lecturer performed a zero-calibration before and after each measurement. The instruments were prepared and started by the lecturer. The students got the necessary instrument while it was already running. Therefore, the students only had to place the instrument at their chosen position(s). The students took the instruments for a minimum of 24 hours, to make it possible to conduct their measurements at any relevant time. The lecturer switched off the instruments after they were returned by the students and retrieved the measurement data from the instruments.
Within a measurement plan, the students described their measurement location (such as 'kitchen' or 'bus station'). For data collection at that location, the students were instructed to place the instrument at a relevant position, meaning a location which is representative of where people could realistically be exposed (for example, in the kitchen an instrument should not be placed directly above a fire, as people do not reside there). Furthermore, students were instructed to hold the measurement instrument stable at their chosen location, for example by fixing it to some construction. The students were asked to make regular notes of relevant circumstances (such as the presence of air pollution sources), and to take photos.
Quantity of measurement data
33 groups of students conducted a total of 65 measurements, with some of the groups collecting multiple measurements (for example, inside and outside a restaurant kitchen). The length of measurements ranged from 5 minutes to 5.75 hours (average and median: 1.7 hours), with measurement frequencies ranging from 10 seconds to 5 minutes. Here we include 51 of the 65 measurements. The 14 exclusions are accounted for as follows. Background and reference measurements are left out (n=11). For one group of students the measurements were disturbed by dust being blown into the sensor, so these are also omitted (n=2). Finally, one measurement was continuously at the lowest value of the instrument and so provided no analysable information (n=1). This leaves a total of 51 measurements for analysis.
Measurement locations
The 51 measurements and their locations are divided into 5 separate groups and 17 subgroups. Table 1 shows the distribution of measurements over separate locations.
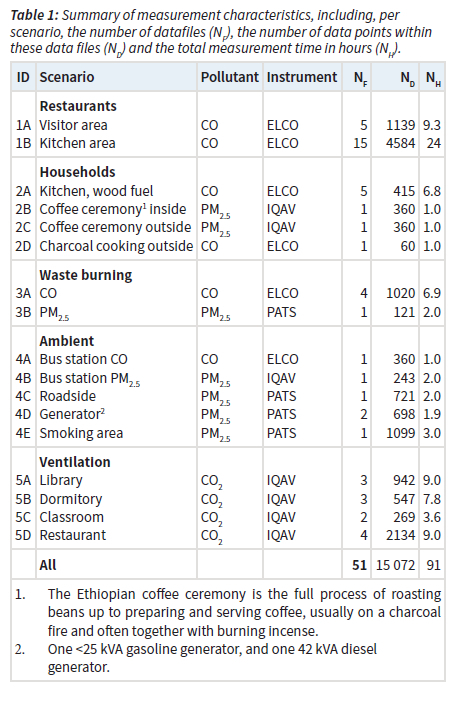
Most measurements were conducted at the Main Campus of Arba Minch University (referred to as 'campus' in the remainder of this article). Measurements in restaurants were held at different campus cafeterias, and at one restaurant in Arba Minch town. Measurements at households were conducted in different homes in Arba Minch. Measurements at waste burning sites were held close (CO between 1 and 40 meters, PM25 between 1 and 20 meters) to burning of domestic or agricultural waste on the campus. Ambient measurements were conducted in Arba Minch bus station, at the roadside close to campus, at two different generators in Arba Minch town, and at a smoking area on campus. CO2 ventilation measurements were all conducted on campus: in libraries, in student dormitories, in classrooms, and in cafeterias.
Distinguishing priority areas
To distinguish priority areas, measurement results of the students are compared to guideline values (GVs). For all scenarios that are identified as priority area, measurement results are compared to results in other studies. In this way, the identification of priority areas is validated.
PM2 5 priority areas
As discussed in section 2.1, the GVs for PM25 are 5 μg/m3 and 15 μg/m3 for an annual and 24-hour average, respectively. All measurements are short-term (less than 24 hours). For that reason, the GV of 15 μg/m3 as 24-hour average will be used. For comparison with the GV, the measured concentration (CMeasured) is translated to a 24-hour average concentration (C24h) based on a likely duration (LD) of the respective circumstance (scenarios 2B, 2C, 3B, 4D and 4E: 1 hour; scenarios 4B and 4C: 8 hours), and an assumed background concentration (CBackground), as shown in equation 1. A background concentration of 0 μg/m3 is used, so that the calculated average concentration can be fully attributed to the measurement.
CO priority areas
As discussed in section 2.2, GVs for CO are 87, 52, 26 and 9 ppm for time averages of respectively 15 minutes, 30 minutes, 1 hour and 8 hours. For distinguishing priority areas related to CO, all available time averages from the measurement data are used for comparison (for example: a measurement period of one hour provides four 15-minute averages, two 30-minute averages and one 1-hour average, each of which can be compared to the respective GV). To compare each of these GVs equally, measurement results for the respective time periods are also shown as percentages relative to their perspective GV. For example, measurement results of 87 ppm as 15-minute average and 52 ppm as 30-minute average are both presented as 100%.
CO2 priority areas
For distinguishing priority areas related to CO2, a guideline value of 1000 ppm will be used, as discussed in section 2.4. For CO2, the averages of the measurements are compared to the GV.
Data analysis
For CO2, a disruption of the measurements could occur if the group members breathed close to the sensor. While the students were warned for this, some groups acknowledged that this happened. Such a moment can be recognized by a sudden and extreme increase of the concentration, resulting in outliers. Outliers are operationalized as values higher than mean+2* standard deviation (Std), whose removal results in a more than 10% change in mean concentration. Outliers were found in and pruned from three datafiles.
All measurement data is processed with Python version 3.7.9 (Python Core Team, 2020), and all graphics are created with the Python library Matplotlib version 3.3.2 (Hunter, 2007). The data generated and/or analysed during the current study (air quality measurement data and python scripts) are available in the OSF repository, https://doi.org/10.17605/OSF.IO/HW57Z.
Results
PM25 measurements
Priority areas
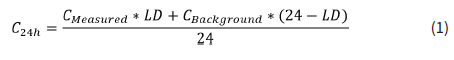
Table 2 shows the measurement results for the scenarios with PM2.5 measurements. Besides the mean, the highest 10-minute average is shown to give insight in the degree of variation. Figure 1 shows each of the PM25 measurements, translated into a likely 24-hour average, in comparison with the guideline value.
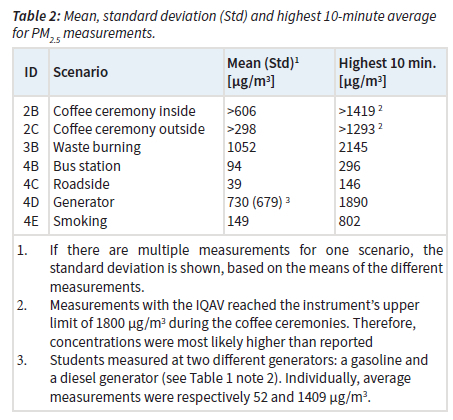
The highest concentration peaks (10-minute averages higher than 1000 μg/m3) are witnessed at the coffee ceremonies, close to waste burning and close to a generator. The highest mean concentration is reported close to waste burning - though concentrations at the coffee ceremonies might also have been higher (see Table 2 note 2). Exceedances of the guideline value are expected at the inside coffee ceremony (2B), close to waste burning (3B), at the bus station (4B) and close to a generator (4D). Based on these measurements, those scenarios can be considered priority areas for research.
Comparison with earlier studies
A pilot study on coffee ceremonies inside in 10 houses in Addis Ababa, Ethiopia, found PM4 concentrations ranging from <720-4,200 μg/m3 (Keil et al., 2010). By definition, PM4 is slightly higher than PM25 (PM4 consists of PM25 and all particles with an aerodynamic diameter of 2.5-4 μιτι), and the lower limit of the instrument used by Keil et al. is 720 μg/m3. However, these higher measurements confirm the assumption that concentrations were higher than reported. More importantly, it provides converging evidence for our designation of indoor coffee ceremonies as a priority area for further research.
Some studies have measured under circumstances of open waste burning. However, these studies concern burning at a larger distance or burning in a large area (for example (Bulto, 2020), with respect to a whole city). No earlier study reports measurements close to (<40 meter) open waste burning. Sivertsen (2006) reports different emission factors for PM2.5 and PM10, as well as 20-meter distance modelled PM10 concentrations. Based on the ratio in emission factors, modelled PM25 concentrations are 622-1110 μg/m3. This corresponds with the measured concentration by the students, and the conclusion that open waste burning is a priority area.
PM25 measurements at different bus stations in two studies ranged from 49-223 μg/m3 (Cheng et al., 2011; Salama et al., 2017); the students' measurements fall within this range. Considering PM2.5 concentrations at the bus station as a priority area is valid.
Two studies conducted close to smaller (<25kVA) gasoline generators measured 83 and 86 μg/m3 respectively on average (Giwa, Nwaokocha, & Samuel, 2019; Oguntoke & Adeyemi, 2017). Variation amongst the generators however ranged from 7.9309 μg/m3. Our finding of 52 μg/m3 close to a smaller gasoline generator corresponds to this range. One study measured concentrations close to diesel generators <500 kVA, of 221-492 μg/m3 (Giwa, Nwaokocha, & Adeyemi, 2019). The students' measurement result of 1409 μg/m3 close to a diesel generator is much higher. This might be because Giwa et al. started measuring only after the generators had run for 30 minutes (ignoring higher start-up concentrations), as well as that the upper limit of their instrument is 500 μg/m3. Setting the upper limit aside, we also witnessed higher start-up concentrations. Without the first 30 minutes, the average measured concentration is 857 μg/m3 instead of 1409 μg/m3. The rationale by Giwa et al. is that the bigger diesel generators generally run for lengthy periods of time, implying that the start-up period is not representative. This is not the case for the generator at which the students measured, which is only used during power cuts - which sometimes take only some minutes. Therefore, viewing pollution from a diesel generator (especially during start-up) as a priority area, based on the students' measurement, is valid.
CO measurements
Priority areas
Table 3 shows the measurement results for the scenarios with CO measurements, with mean values as well as maximum concentrations for time averages corresponding to the guideline values. Figure 2 shows all measured 15-minute, 30-minute and 1-hour averages, relative to the respective guideline value.
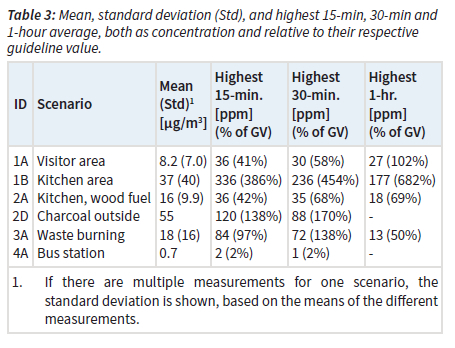
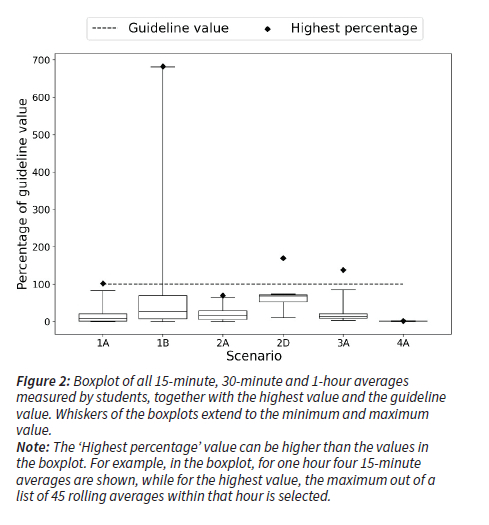
Highest CO concentrations are measured in the kitchen areas of restaurants, and close to charcoal burning outside. From Figure 2 it can be observed that especially in the kitchen areas of restaurants (1B), exceedances of the guideline values are witnessed. However, also in the visitor's area (1A), close to outside charcoal cooking (2D) and close to waste burning (3A) exceedances are measured. These scenarios can be considered priority areas for research.
Comparison with earlier studies
We are not aware of prior studies conducting CO measurements in restaurant kitchens or visitor areas that have a dominant use of biomass fuels. Within barbecue restaurants (charcoal barbecues in both kitchen and visitor area, but also gas appliances are used), concentrations are measured of 12.3 (range 2.6-22.5) and 21.1 (range 3.2-42.6) ppm CO, respectively (Zhang et al., 2017). While our measurements in visitor areas are comparable, measurements in the kitchen area are higher. This is to be expected due to the dominant use of biomass. It is valid to view these areas as priority areas.
No other studies were found with measurements of CO close to charcoal cooking outside, or close to (<40 meter) open waste burning. These areas should be viewed as priority areas, based on our measurement results in combination with no invalidation.
CO2 measurements
Priority area
Table 4 shows the measurement results for the scenarios with CO2 measurements. Besides the mean, the highest 10-minute average is shown to give insight in the degree of variation. Figure 3 shows each of the CO2 measurements in comparison with the guideline value.
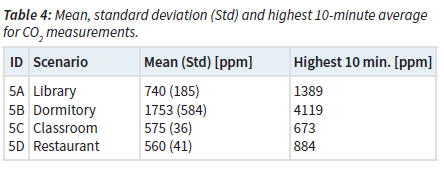
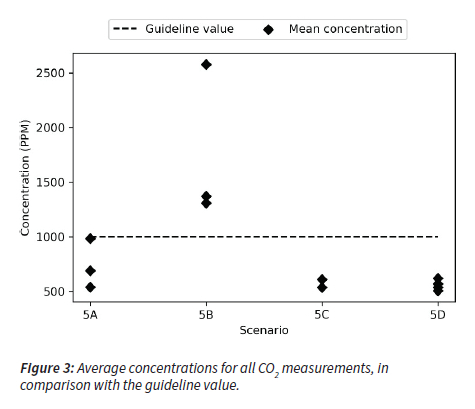
Highest concentrations overall are measured in dormitories. The mean concentration in libraries, classrooms and restaurant did not exceed the guideline value of 1000 ppm, though the highest 10 minutes in libraries slightly exceeded this. Based on the averages of the individual measurements, all three measurements within the dormitories were above the guideline value, making this a priority area.
Comparison with earlier studies
Jenkins (2018) reports measured CO2 concentrations ranging from 650-2900 ppm in student dormitories on an American college campus. The student measurements correspond with this range. It is valid to view dormitories as a priority area.
Discussion
Scenarios measured, but not appointed as priority area
For some of the scenarios, measurements by students did not reveal exceedances of the guideline value. For PM2.5, this was the case for measurements at an outdoor coffee ceremony (2C), the roadside (4C) and a smoking area (4E). As discussed in Table 2 note 2, concentrations were likely higher during the coffee ceremony measurements. There is however not another study with measurements at outdoor coffee ceremonies to validate the result, and it is at least logical that an outdoor coffee ceremony results in lower concentrations than indoor. While traffic close to Main Campus (the environment for the students in this study) is not dense, for other campuses closer to busier roads concentrations at roadside might be different. For smoking, two earlier studies found average concentrations of 124 and 131 μg/m3 (Brauer & Mannetje, 1998; Williams Jr et al., 2014), which is quite similar to the students' measurement of 149 μg/m3. Whether the guideline value is exceeded or not of course depends on the assumed exposure duration of 1 hour - if this is longer, the GV can be exceeded.
For CO, no exceedances were measured in household kitchens using biomass fuel (scenario 2A) and in the bus station (scenario 4A). Earlier studies within household kitchens using biomass fuel report average concentrations of 7.9 (Clark et al., 2010), 7.8 (Khalequzzaman et al., 2011), 22.3 (Leavey et al., 2015) and 7.5 (Mukhopadhyay et al., 2012) ppm, which is in the same order of magnitude to the student measurement average of 16 ppm, suggesting that the student measurements are not uncommonly low. In those studies, however, a large variation was witnessed, with certainly also some exceedances of the guideline values. More importantly, however, most studies also measure PM25 in such circumstances, with much higher exceedances of the guideline value. Household kitchen areas with biomass fuel therefore still might be a priority area, even though it did not follow from this study. As for CO concentrations in a bus station, Salama et al. (2017) report concentrations of 8.5 ppm on average (range 6.5-9.8 ppm). While this is higher than the concentration measured by students, it supports the finding that this is not a priority area.
For CO2, no exceedances were measured in libraries, classrooms, and restaurants. No prior work can be found on CO2 measurements in libraries, but our preliminary measurement presents no special cause for alarm. For classrooms, Soomro et al. (2019) report several measurement results ranging from 4784093 ppm. The student measurements at 575 ppm fall towards the low end of this range, but not outside it. For restaurants, Zhang et al. (2017) reports concentrations of 400-890 ppm, while Akbar-Khanzadeh et al. (2002) found concentrations of 618-1835 ppm. Again, student measurements of (on average) 560 ppm fall towards the lower end of the range found in these studies combined.
Missing scenarios
Although our study presents a range of first-time measures and replicates others, it does not represent an exhaustive sampling. For one thing, for some scenarios either PM2.5 or CO was measured, while both components might be relevant. CO values close to a coffee ceremony have never been subject of a study before. As for generators, an earlier study close to gasoline generators found CO concentrations of 141-4167 ppm (Oguntoke & Adeyemi, 2017), while a study close to diesel generators found concentrations of 19-198 ppm (Giwa, Nwaokocha, & Adeyemi, 2019). CO measurements close to generators might, therefore, certainly be relevant. Similarly, with high CO values in restaurant kitchens, high PM2.5 values can be expected, and PM2.5 concentration measurements in household kitchens with biomass fuel or close to charcoal cooking outside are also relevant.
Furthermore, there might be scenarios entirely lacking. Given the embedding of this project in coursework on campus, students privileged scenarios to which they had easy access, such as the campus and its surroundings. Students not based on campus or still living at their family homes are exposed to other scenarios in which measuring air quality would be relevant. Here we see opportunities for the crowdsourcing methods we have pioneered. Many of the measurement devices are portable and easy to operate, and so could feasibly be carried into a wider range of scenarios. Still, the priority areas identified in this study represent scenarios in which many students commonly find themselves, and they therefore provide ample room for further research.
This leads to a recommendation. Future student science projects might challenge students to select scenarios different from the ones that have been part of this study. Students can conduct preliminary measurements in similar scenarios for the component that was not yet measured (such as CO during a coffee ceremony), or they might come up with entirely new scenarios.
Concentration and exposure
While students have measured concentrations, duration of exposure is another key variable determining health effects. The conditions of our study, in which we privileged short-term measurements in a wide range of localities, did not allow us to systematically investigate duration of exposure. For PM2.5, this study estimated a likely duration. For a better quantification of exposure and a thorough investigation of related health effects, specific attention needs to be paid to the duration of exposure for different people across a range of circumstances. Even without a systematic measure of duration of exposure, however, it is already clear that several of the priority areas are likely to cumulatively present a likelihood of adverse health effects. An individual's exposure is usually not incurred in one individual setting but results from a sequence of settings. Students might encounter open waste burning, a running generator, a coffee ceremony, and biomass cooking, all within the same day. For a more thorough evaluation of exposure, it is recommended to collect additional metadata on duration and frequency of the circumstances under which people are exposed.
Conclusion
If air pollution represents one of the biggest current threats to human health, maximizing opportunities for measurements in a wide range of human environments is of paramount importance. Here we have presented the use of a Student Science (citizen science by students) approach towards this goal, with novel empirical and methodological contributions. Empirically, we report a unique set of first-time measurements of PM25, CO and CO2 in a range of settings that are woefully understudied despite being a common part of people's surroundings worldwide. Our PM25 measurements showed a likely exceedance of the guideline value during inside coffee ceremonies, close to open waste burning, at a bus station, and close to a diesel generator. For CO, extreme values in excess of guideline values were measured in restaurant kitchens as well as in restaurants' visitor areas, close to outdoor charcoal cooking, and close to open waste burning. For CO2, values higher than the guideline value were measured in dormitories. Collectively, these settings, several of which are reported here for the first time, can be considered priority areas for further research.
Methodologically, our study has illustrated the benefits of the Student Science approach by crowdsourcing air quality measurements in a participatory research setting. Such forms of citizen science may provide partial solutions to structural inequalities in resources that dictate research interests and may bring large-scale collection of key measurements within reach. The Student Science approach also has the twin benefits of furthering students' education while producing measurements of high scientific and societal value.
Acknowledgements
The authors thank Buro Blauw B.V. (air quality consultancy company from the Netherlands) for donating the measurement instruments that could be used in the students' measurement projects. Furthermore, this study has been made possible by the students of WSEE Year 4 and MHD Year 2 2019/2020, as due to their motivation and care those instruments have been put to good use. We thank Dr. Mark Dingemanse for proofreading this article.
Author contributions
Johannes Dirk Dingemanse: Conceptualization, Methodology, Software, Validation, Formal analysis, Resources, Data Curation, Writing - Original Draft, Writing - Review & Editing, Visualization, Supervision, Project administration. Muse Abayneh Abiyu, Kirubel Getachew Tesfaye and Feyera Fekadu Roro: Methodology, Investigation, Writing - Review & Editing.
References
Akbar-Khanzadeh, F., Tan, Y., Brown, E. N., & Akbar-Khanzadeh, M. (2002). An evaluation of ventilation system flow rates and levels of carbon dioxide, ambient temperature, and relative humidity in restaurants. Applied Occupational and Environmental Hygiene, 17(9), 640-647. https://doi.org/10.1080/10473220290095989 [ Links ]
Alves, C. A., Vicente, E. D., Evtyugina, M., Vicente, A. M., Nunes, T., Lucarelli, F., Calzolai, G., Nava, S., Calvo, A. I., Alegre, C. del B., Oduber, F., Castro, A., & Fraile, R. (2020). Indoor and outdoor air quality: A university cafeteria as a case study. Atmospheric Pollution Research, 11(3), 531-544. https://doi.org/10.1016/j.apr.2019.12.002 [ Links ]
Atkinson, R. W., Kang, S., Anderson, H. R., Mills, I. C., & Walton, H. A. (2014). Epidemiological time series studies of PM2.5 and daily mortality and hospital admissions: A systematic review and meta-analysis. Thorax, 69(7), 660-665. https://doi.org/10.1136/thoraxjnl-2013-204492 [ Links ]
Babatola, S. S. (2018). Global burden of diseases attributable to air pollution. Journal of Public Health in Africa, 9(3), 813. https://doi.org/10.4081/jphia.2018.813 [ Links ]
Boguski, T. K. (2006, October). Understanding units of measurement. Center for Hazardous Substance Research. https://cfpub.epa.gov/ncer_abstracts/index.cfm/fuseaction/display.files/fileid/14285 [ Links ]
Brauer, M., & Mannetje, A. (1998). Restaurant smoking restrictions and environmental tobacco smoke exposure. American Journal of Public Health, 88(12), 1834-1836. https://doi.org/10.2105/AJPH.88.12.1834 [ Links ]
Bulto, T. W. (2020). Impact of open burning refuse on air quality: In the case of "Hidar Sitaten" at Addis Ababa, Ethiopia. Environmental Health Insights, 14. https://doi.org/10.1177/1178630220943204 [ Links ]
Chen, S. (2018). Air pollution, student health, and school absences: Evidence from China. Journal of Environmental Economics and Management, 92, 465-497. https://doi.org/10.1016/j.jeem.2018.10.002 [ Links ]
Cheng, Y.-H., Chang, H.-P., & Hsieh, C.-J. (2011). Short-term exposure to PM10, PM25, ultrafine particles and CO2 for passengers at an intercity bus terminal. Atmospheric Environment, 45(12), 2034-2042. https://doi.org/10.1016/j.atmosenv.2011.01.061 [ Links ]
Chowdhury, Z., Le, L. T., Masud, A. A., Chang, K. C., Alauddin, M., Hossain, M., Zakaria, A. B. M. M., & Hopke, P. K. (2012). Quantification of indoor air pollution from using cookstoves and estimation of its health effects on adult women in Northwest Bangladesh. Aerosol and Air Quality Research, 12(4), 463-475. https://doi.org/10.4209/aaqr.2011.10.0161 [ Links ]
Clark, M. L., Reynolds, S. J., Burch, J. B., Conway, S., Bachand, A. M., & Peel, J. L. (2010). Indoor air pollution, cookstove quality, and housing characteristics in two Honduran communities. Environmental Research, 110(1), 12-18. https://doi.org/10.1016/j.envres.2009.10.008 [ Links ]
Dingemanse, J. D., & Dingemanse-de Wit, G. (2022). An evaluation of best practices in an air quality student science project in Ethiopia. Aquademia, 6(1), ep22001. https://doi.org/10.21601/aquademia/11828 [ Links ]
Feng, S., Gao, D., Liao, F., Zhou, F., & Wang, X. (2016). The health effects of ambient PM25 and potential mechanisms. Ecotoxicology and Environmental Safety, 128, 67-74. https://doi.org/10.1016/j.ecoenv.2016.01.030 [ Links ]
Gakidou, E., Afshin, A., Abajobir, A. A., Abate, K. H., Abbafati, C., Abbas, K. M., Abd-Allah, F., Abdulle, A. M., Abera, S. F., Aboyans, V., Abu-Raddad, L. J., Abu-Rmeileh, N. M. E., Abyu, G. Y., Adedeji, I. A., Adetokunboh, O., Afarideh, M., Agrawal, A., Agrawal, S., Ahmadieh, H., ... Murray, C. J. L. (2017). Global, regional, and national comparative risk assessment of 84 behavioural, environmental and occupational, and metabolic risks or clusters of risks, 1990-2016: A systematic analysis for the Global Burden of Disease Study 2016. The Lancet, 390(10100), 1345-1422. https://doi.org/10.1016/S0140-6736(17)32366-8 [ Links ]
Giwa, S. O., Nwaokocha, C. N., & Adeyemi, H. O. (2019). Noise and emission characterization of off-grid diesel-powered generators in Nigeria. Management of Environmental Quality, 30(4), 783802. https://doi.org/10.1108/MEQ-07-2018-0120 [ Links ]
Giwa, S. O., Nwaokocha, C. N., & Samuel, D. O. (2019). Off-grid gasoline-powered generators: Pollutants' footprints and health risk assessment in Nigeria. Energy Sources, Part A: Recovery, Utilization, and Environmental Effects, 1-18. https://doi.org/10.1080/15567036.2019.1671555 [ Links ]
Hunter, J. D. (2007). Matplotlib: A 2D graphics environment. Computing in Science & Engineering, 9(3), 90-95. https://doi.org/10.1109/MCSE.2007.55 [ Links ]
IQAir. (2020). IQAir Air quality around the world. https://www.iqair.com/ [ Links ]
Jenkins, S. T. (2018). Ventilation impact on airborne transmission of respiratory illness in student dormitories [University of Maryland]. http://hdl.handle.net/1903/21712 [ Links ]
Keil, C., Kassa, H., Brown, A., Kumie, A., & Tefera, W. (2010). Inhalation exposures to particulate matter and carbon monoxide during Ethiopian coffee ceremonies in Addis Ababa: A pilot study. Journal of Environmental and Public Health, 2010, 1-8. https://doi.org/10.1155/2010/213960 [ Links ]
Khalequzzaman, M., Kamijima, M., Sakai, K., Ebara, T., Bilqis, Hoque, A., & Nakajima, T. (2011). Indoor air pollution and health of children in biomass fuel-using households of Bangladesh: Comparison between urban and rural areas. Environmental Health and Preventive Medicine, 16, 375-383. https://doi.org/10.1007/s12199-011-0208-z [ Links ]
Kimura, A. H., & Kinchy, A. (2016). Citizen science: Probing the virtues and contexts of participatory research. Engaging Science, Technology, and Society, 2, 331. https://doi.org/10.17351/ests2016.99 [ Links ]
Kloog, I., Ridgway, B., Koutrakis, P., Coull, B. A., & Schwartz, J. D. (2013). Long- and short-term exposure to PM25 and mortality. Epidemiology (Cambridge, Mass.), 24(4), 555-561. https://doi.org/10.1097/EDE.0b013e318294beaa [ Links ]
Kumar, R., Singh, K., Nagar, S., Kumar, M., Mehto, U. K., Rai, G., & Gupta, N. (2015). Pollutant levels at cooking place and their association with respiratory symptoms in women in a rural area of Delhi-NCR. The Indian Journal of Chest Diseases & Allied Sciences, 57(4), 225-231. [ Links ]
Leavey, A., Londeree, J., Priyadarshini, P., Puppala, J., Schechtman, K. B., Yadama, G., Biswas, P., & Warren, G. (2015). Real-time particulate and CO concentrations from cookstoves in rural households in Udaipur, India. Environmental Science & Technology, 49, 7423-7431. https://doi.org/10.1021/acs.est.5b02139 [ Links ]
Lu, F., Xu, D., Cheng, Y., Dong, S., Guo, C., Jiang, X., & Zheng, X. (2015). Systematic review and meta-analysis of the adverse health effects of ambient PM25 and PM10 pollution in the Chinese population. Environmental Research, 136, 196-204. https://doi.org/10.1016/j.envres.2014.06.029 [ Links ]
Massen, F., Tholl, R., & Zimmer, M. (2018). A short study in fine particles measurement at meteoLCD by inexpensive LLS sensors. Lycée Classique de Diekirch. https://meteo.lcd.lu/papers/short_study_fine_particles_19NOV2018.pdf [ Links ]
Mukhopadhyay, R., Sambandam, S., Pillarisetti, A., Jack, D., Mukhopadhyay, K., Balakrishnan, K., Vaswani, M., Bates, M. N., Kinney, PatrickL., Arora, N., & Smith, KirkR. (2012). Cooking practices, air quality, and the acceptability of advanced cookstoves in Haryana, India: An exploratory study to inform large-scale interventions. Global Health Action, 5(1), 1901619016. https://doi.org/10.3402/gha.v5i0.19016 [ Links ]
Northcross, A., Chowdhury, Z., McCracken, J., Canuz, E., & Smith, K. R. (2010). Estimating personal PM2.5 exposures using CO measurements in Guatemalan households cooking with wood fuel. Journal of Environmental Monitoring, 12(4), 873-878. https://doi.org/10.1039/b916068j [ Links ]
Ochieng, C., Vardoulakis, S., & Tonne, C. (2016). Household air pollution following replacement of traditional open fire with an improved rocket type cookstove. Science of the Total Environment, 580, 440-447. https://doi.org/10.1016/j.scitotenv.2016.10.233 [ Links ]
Oguntoke, O., & Adeyemi, A. (2017). Degradation of urban environment and human health by emissions from fossil-fuel combusting electricity generators in Abeokuta metropolis, Nigeria. Indoor and Built Environment, 26(4), 538-550. https://doi.org/10.1177/1420326X16629818 [ Links ]
Pennise, D., Brant, S., Mahu Agbeve, S., Quaye, W., Mengesha, F., Tadele, W., & Wofchuck, T. (2009). Indoor air quality impacts of an improved wood stove in Ghana and an ethanol stove in Ethiopia. Energy for Sustainable Development, 13, 71-76. https://doi.org/10.1016/j.esd.2009.04.003 [ Links ]
Petersen, J., Kristensen, J., Elarga, H., Andersen, R. K., & Midtstraum, A. (2018). Accuracy and air temperature dependency of commercial low-cost NDIR CO2 Sensors: An experimental investigation. 4th International Conference On Building Energy & Environment, 203-207. https://backend.orbit.dtu.dk/ws/portalfiles/portal/146097852/Untitled.pdf [ Links ]
Python Core Team. (2020). Python: A dynamic, open source programming language. (3.7.9) [Computer software]. www.python.org [ Links ]
Rice, S. A. (2014). Human health risk assessment of CO2: Survivors of acute high-level exposure and populations sensitive to prolonged low-level exposure. Environments, 3(5), 7-15. [ Links ]
Rosa, G., Majorin, F., Boisson, S., Barstow, C., & Johnson, M. (2014). Assessing the impact of water filters and improved cook stoves on drinking water quality and household air pollution: A randomised controlled trial in Rwanda. PLoS ONE, 9(3), 9101191011. https://doi.org/10.1371/journal.pone.0091011 [ Links ]
Salama, K. F., Alhajri, R. F., & Al-Anazi, A. A. (2017). Assessment of air quality in bus terminal stations in Eastern province, Kingdom of Saudi Arabia. Int. J. Community Med. Public Health, 4, 1413. http://dx.doi.org/10.18203/2394-6040.ijcmph20171748 [ Links ]
Satish Usha, Mendell Mark J., Shekhar Krishnamurthy, Hotchi Toshifumi, Sullivan Douglas, Streufert Siegfried, & Fisk William J. (2012). Is CO2 an indoor pollutant? Direct effects of low-to-moderate CO2 concentrations on human decision-making performance. Environmental Health Perspectives, 120(12), 16711677. https://doi.org/10.1289/ehp.1104789 [ Links ]
Shaddick, G., Thomas, M. L., Amini, H., Broday, D., Cohen, A., Frostad, J., Green, A., Gumy, S., Liu, Y., Martin, R. V., Pruss-Ustun, A., Simpson, D., van Donkelaar, A., & Brauer, M. (2018). Data integration for the assessment of population exposure to ambient air pollution for Global Burden of Disease assessment. Environmental Science & Technology, 52(16), 9069-9078. https://doi.org/10.1021/acs.est.8b02864 [ Links ]
Sivertsen, B. (2006). Air pollution impacts from open air burning. WIT Transactions on Ecology and the Environment, 92. https://doi.org/10.2495/WM060471 [ Links ]
Snider, G., Weagle, C. L., Murdymootoo, K. K., Ring, A., Ritchie, Y., Stone, E., Walsh, A., Akoshile, C., Anh, N. X., Balasubramanian, R., Brook, J., Qonitan, F. D., Dong, J., Griffith, D., He, K., Holben, B. N., Kahn, R., Lagrosas, N., Lestari, P., ... Martin, R. V. (2016). Variation in global chemical composition of PM25: Emerging results from SPARTAN. Atmos. Chem. Phys., 25. https://doi.org/10.5194/acp-16-9629-2016 [ Links ]
Soomro, M. A., Memon, S. A., Shaikh, M. M., & Channa, A. (2019). Indoor air CO2 assessment of classrooms of educational institutes of hyderabad city and its comparison with other countries. 020014. https://doi.org/10.1063/1.5115373 [ Links ]
UCAR (University Corporation for Atmospheric Research). (2017). Carbon Monoxide. UCAR Center for Science Education. https://scied.ucar.edu/carbon-monoxide [ Links ]
Wang, S.-H., Hung, R.-Y., Lin, N.-H., Gómez-Losada, Á., Pires, J. C. M., Shimada, K., Hatakeyama, S., & Takami, A. (2020). Estimation of background PM25 concentrations for an air-polluted environment. Atmospheric Research, 231, 104636. https://doi.org/10.1016/j.atmosres.2019.104636 [ Links ]
Williams Jr, R. D., Barnes, J. T., Hall, M. E., Day, T. F., & Hunt, B. P. (2014). Analysis of restaurant indoor air quality in smoking-allowed vs. Smoke-free college communities. American Journal of Health Studies, 29(1). https://www.researchgate.net/profile/Ronald_Williams5/publication/279193414_Analysis_ of_Restaurant_Indoor_Air_Quality_in_Smoking-Allowed_Vs_Smoke-Free_College_Communities/links/558daef608ae1e1f9bab23a7/ Analysis-of-Restaurant-Indoor-Air-Quality-in-Smoking-Allowed-Vs-Smoke-Free-College-Communities.pdf https://doi.org/10.47779/ajhs.2014.209 [ Links ]
World Health Organization. (2000). Air quality guidelines for Europe (No. 91; WHO Regional Publications, European Series, p. 273). World Health Organization Regional Office for Europe. [ Links ]
World Health Organization. (2006). WHO Air quality guidelines for particulate matter, ozone, nitrogen dioxide and sulfur dioxide: Global update 2005. [ Links ]
World Health Organization. (2018a, May). Ambient (outdoor) air pollution. https://www.who.int/news-room/fact-sheets/detail/ambient-(outdoor)-air-quality-and-health [ Links ]
World Health Organization. (2018b, May). Household air pollution and health. https://www.who.int/news-room/fact-sheets/detail/household-air-pollution-and-health [ Links ]
World Health Organization. (2021). WHO global air quality guidelines. Particulate matter (PM25 and PMJ, ozone, nitrogen dioxide, sulfur dioxide and carbon monoxide. World Health Organization. https://apps.who.int/iris/handle/10665/345329 [ Links ]
Zhang, Z., Zhao, Y., Zhou, M., Tao, P., & Li, R. (2017). Measurement of indoor air quality in Chinese charcoal barbecue restaurants. Procedia Engineering, 205, 887-894. https://doi.org/10.1016/j.proeng.2017.10.088 [ Links ]
Zoellick, B., Nelson, S. J., & Schauffler, M. (2012). Participatory science and education: Bringing both views into focus. Frontiers in Ecology and the Environment, 10(6), 310-313. https://doi.org/10.1890/110277 [ Links ]
 Correspondence:
Email: johannesdirk.dingemanse@amu.edu.et
Received: 17 March 2022
Reviewed: 22 June 2022
Accepted: 11 September 2022

