


Services on Demand
Article
 English (pdf)
 Article in xml format
 Article references
Indicators

Related links
-
 Cited by Google
 -
 Similars in Google
Share

 Permalink
Clean Air Journal
On-line version ISSN 2410-972X
Print version ISSN 1017-1703
Clean Air J. vol.32 n.1 Pretoria 2022
http://dx.doi.org/10.17159/caj/2022/32/1.13242
RESEARCH ARTICLE
Analysis of the first surface nitrogen dioxide concentration observations over the South African Highveld derived from the Pandora-2s instrument
Refilwe F. KaiI; Mary C. ScholesI; Stuart J. PikethII; Robert J. ScholesIII
IUniversity of the Witwatersrand, School of Animal, Plant and Environmental Sciences, Johannesburg, South Africa,
IINorth-West University, Unit for Environmental Sciences and Management, Potchefstroom, South Africa
IIIUniversity of the Witwatersrand, Global Change Institute, Johannesburg, South Africa
ABSTRACT
Anthropogenic emissions from industry, biomass burning and traffic are significant contributors to the atmospheric loading of nitrogen dioxide on the South African Highveld. These sources are dispersed across the region and emit nitrogen oxides (NO and NO2) into the atmosphere at different elevations above the earth's surface. Additionally, atmospheric stability in the form of surface and elevated inversions decreases the dispersion of air pollutants and stratifies pollutants into distinctive layers above the surface. This study explores the Highveld near-surface nitrogen dioxide concentrations obtained using the ground-based Pandora-2s monitoring system. The Pandora-2s instrument retrieves surface NO2 levels from clear sky measurements using a fully parameterised algorithm. We present the first near-surface concentration measurements of atmospheric NO2 at Wakkerstroom, a site between Volksrust and Amersfoort, downstream of major source conglomerates, the Majuba power station and other industries. These data are explored in the presence and context of potential background NO2 concentrations in the area derived from other ground-based sensors. The quasicontinuous data show elevated surface NO2 levels in week 37 (September) of 2020 (7.3 ± 5.7 ppb), while the lowest levels were observed in week 15 (April) of 2020 (0.2 ± 0.04 ppb). The elevated surface NO2 levels are driven by dominant emission sources and transport trajectories, while the accuracy in the measurements is based on the high temporal resolution of the ground-based Pandora-2s instrument.
Keywords: Nitrogen dioxide, Pandora-2s, plumes, Eskom, Highveld
Introduction
The South African Highveld region, characterised by elevations of ~700 - 2000 m above sea level, comprises portions of the inland provinces, including Mpumalanga (Balashov et al., 2014; Freiman and Piketh, 2003). Mpumalanga is home to approximately ninety-six registered stationary facilities that emit pollutants into the atmosphere, including most of South Africa's coalfired power stations (https://saaelip.environment.gov.za/ accessed 23rd June 2021). These emissions and others from anthropogenic activities such as domestic biomass burning, vehicular emissions, and solid fuel combustion result in elevated levels of pollutants, particularly sulphur dioxide (SO2), carbon dioxide (CO2), particle matter (PM) and nitrogen oxides (NOx) (NO + NO2) (Alade, 2011; Belelie et al., 2019; Hickman et al., 2021; Naiker et al., 2012; Shikwambana et al., 2020). As a result, there is a persistent pool of pollutants in the Highveld atmosphere (Lourens et al., 2012).
Coal-fired power stations produce electricity by converting thermal energy produced through coal combustion into electrical energy (Wang et al., 2020). During the coal combustion process, which accounts for ~65% of the global total NO emissions (Bauwens et al., 2020), nitrogen oxides are produced (Scorgie and Thomas, 2006), released into the atmosphere (Breeze, 2015), where they contribute to the atmospheric chemistry. Therefore, the plethora of emissions in the highly industrialised Highveld region contributes to the reported increased atmospheric levels of nitrogen oxides (NOx) (NO + NO2) (Celarier et al., 2008). As a result, the Mpumalanga Highveld is known as the major (> 80% of emissions in South Africa) emission region of nitrogen oxides (NOx) (Collett et al., 2010).
Atmospheric NO emissions are highly reactive and have a distinctive diurnal cycle attributed to photolysis reactions (Celarier et al., 2008; Verhoelst et al., 2021). In the presence of solar radiation, they transform into NO2. In the presence of volatile organic compounds (VOCs) and sunlight, the NO2 forms ozone (O3) (Hakkarainen et al., 2021; Wang and Hao, 2012), a secondary air pollutant. The rate at which O3 is produced is determined by the NOx emission time and location (Wedow et al., 2021). These emissions also play a role in forming secondary organic aerosols (SOAs), nitric acid and nitrates (Qi et al., 2020; Verhoelst et al., 2021). Therefore, these NOx chemical transformations contribute to the formation of smog and acid rain (Qi et al., 2020; Verhoelst et al., 2021).
In addition to chemical processes, these emissions are subjected to various other processes linked with meteorological conditions, determining their dispersion and transport from the source region (Belelie et al., 2019). Ultimately, it has been deduced that principal pollutants such as NOx play a critical role in indicating regional air quality (Behm and Haupt, 2020; Brancher, 2021; Wang and Hao, 2012; Zyrichidou et al., 2015).
Therefore, it is important to accurately quantify the distributions, trends and cycles of nitrogen dioxide levels in the atmosphere, particularly near the surface where most of the emissions originate. These have been measured from space using Low Earth Orbit (LEO) satellites since the 1970s (Verhoelst et al., 2021). However, the lack of continuous trace gas monitoring data is still a concern (de Lange et al., 2021; Omrani et al., 2020; Shabbir et al., 2016) in air quality research. The scarcity of data is also affected by the challenge in acquiring and extracting accurate atmospheric column trace gas measurements in cloudy conditions.
This study reports on the first near-ground (surface) nitrogen dioxide measurements from the Pandora-2s instrument in the Mpumalanga, South African Highveld. In contrast to the LEO satellites, the Pandora-2s is a ground-based instrument that derives measurements of atmospheric trace gases using one of three observation modes: direct sun, direct moon or MAXDOAS (multi-axis differential optical absorption spectroscopy) (Cede et al., 2021). In addition to that, it provides uninterrupted measurements instead of the once-a-day measurements from the current satellite instruments. This instrument was optimised to retrieve nitrogen dioxide column concentrations under cloudy conditions.
These first-time measurements will be used to assess the near-surface concentrations of NO2 downwind the region of major Highveld emissions sources, in Wakkerstroom, Mpumalanga. We have used near-surface air quality data from three Eskom air quality monitoring sites (Kendal, Majuba and Elandsfontein) to compare the remotely derived NO2 concentrations from the Pandora-2s instrument. Meteorological variables and kinematic backward trajectory analyses indicate near-ground nitrogen dioxide pollutant signatures.
Data and methodology
Four data sets have been used in this study: near-surface atmospheric column NO2 concentrations from a Pandora-2s (Pan159) instrument; near-surface NO2 gas concentrations from Eskom's Majuba, Kendal and Elandsfontein monitoring stations; surface meteorological data collected at Wakkerstroom; and backward kinematic trajectories calculated for Wakkerstroom. Details of the data and methods are provided below.
Instrumentation
The Pandora-2s instrument can obtain measurements in three observation modes; direct sun, direct moon or MAXDOAS (multi-axis differential optical absorption spectroscopy) (Cede et al., 2021). The MAXDOAS viewing geometry retrieves surface nitrogen dioxide concentrations (Herman et al., 2009) amongst other product outputs. The measurements are processed using the "L2 Air-Ratio Sky Algorithm (Cede et al., 2021). A fully parameterised algorithm (which does not require elaborative radiative transfer calculations) is then used to extract the realtime quasi-continuous surface concentration data (Cede, 2021; Tiefengraber et al., 2021).
Further details regarding the algorithm can be found in Cede (2021). Quasi-continuous data are discontinuous and are characterised by "events" (much higher than the average data) in the observations. These data are typical of atmospheric trace gas and meteorological variables measurements.
More characteristics of the dual spectrometer Pandora-2s instrument can be found in Herman et al. (2009) and Zhao et al. (2020, 2016). The extracted surface concentrations are from within the first 50 m above the ground. During winter and autumn, they are monitored between 06h00 and 17h00, and 05h00 to 18h00 in the summer and spring due to the instrument relying on sky radiance for measurements.
Surface NO2 data
The Pandora-2s instrument was primarily installed at Wakkerstroom to investigate the biogeochemical exchange of trace gases in ecosystem functions. Nitrogen biogeochemical flows, amongst others, contribute to the functioning of ecosystem services such as climate regulation (Watanabe and Ortega, 2011; Xu et al., 2021). The Wakkerstroom monitoring site is directly downwind of the Majuba Power station (PS) and the greater Highveld region and is ideally located to detect the high NOx emissions and subsequent transport. The Pandora-2s instrument at Wakkerstroom, Mpumalanga, is part of the Pandora Global Network (PGN) ("NASA Pandora Project," last accessed: 18th September 2021) (Figure 1). The surface NO2 data from the Wakkerstroom site are presented from 1st January to 31st December 2020. Although night-time measurements were taken using the moon as a reference, these data have not been included in this initial analysis. Weekly average surface concentrations have been calculated from the Pandora-2s data set. This provided the best data recovery, given missing data for several months.

Additionally, nitrogen dioxide data from three Eskom air quality monitoring sites (MS), namely Kendal, Majuba and Elandsfontein in Mpumalanga, are presented to provide comparative in situ surface measurements. The Elandsfontein MS is centrally located on the Highveld and represents an integrated plume from multiple significant NO sources. Kendal and Majuba monitoring sites are located downwind of the similarly named power stations to detect maximum surface concentrations (Thomas and Scorgie, 2006). The Kendal monitoring site is also ~30 km southwest of Emalahleni, with low-income townships where domestic coal is prevalent (Matimolane, 2019).
Data at the three Eskom monitoring sites above are continuous, with hourly averaging times collected between July 2015 and May 2020. In order to create comparable data sets, weekly average values were calculated from the continuous data sets.
NO2 data description and acquisition
The Pandora-2s instrument data are processed to produce outputs; the total, tropospheric, and surface concentration. Data from the Pandonia global network (https://www.pandonia-globalnetwork.org/pgn-data/) were cleaned and analysed using Rstudio® and Excel® statistical software. Eskom provided the air quality monitoring data from Kendal, Majuba and Elandsfontein monitoring sites.
NO2 data cleaning
The data from the Pandora instrument are filtered and flagged using data quality indicators, high, medium and low quality, which specify the confidence in the data. The quality of the data depend on the measurements' uncertainties during monitoring. Various factors contribute to the uncertainty in measurements; noise, permanent systematic effects, temporary systematic effect, calibration transfer uncertainty, transport uncertainty and drift correction uncertainty (Cede and Tiefengraber, 2013. The low-quality data should not be used for most purposes and are not presented in these observations. The first-time Pandora-2s instrument (Pan159) measurements at Wakkerstroom provided semi-continuous data that had gaps. The surface NO2 concentrations are impacted by cloud cover as they depend on sky radiance for successful retrieval (Tiefengraber et al., 2021; Zhao et al., 2019).
Meteorological data
The dispersion and transport of trace gases such as nitrogen dioxide in the atmosphere depend on meteorological conditions (Goldberg et al., 2020). These conditions determine the atmosphere's stability and, therefore, the chemical and physical processes that affect the atmospheric accumulation of pollutants (Balashov et al., 2014). The ambient air temperature depends on solar irradiance, and they both affect the dissociation of NO2 in the atmosphere (Balashov et al., 2014; Goldberg et al., 2020). The wind speed and direction contribute to the dispersion and transport of the pollutant around and to-and-from the source of emissions (Balashov et al., 2014). The removal rate of pollutants from the atmosphere is also dependent on rain and humidity through wet deposition (Seinfeld and Pandis, 2016).
Meteorological data from the Wakkerstroom monitoring site (Figure 1), measured using the HOBO® weather station and accessed through a CR300 logger, are used in this study. The measurements are near-surface/ground level values of temperature, rainfall, relative humidity, wind speed and wind direction. All variables were recorded as hourly averages. The wind direction data were averaged according to a technical note by Grange (2014) using Rstudio®. All variables data are available for the one year (2020) analysis period.
HYSPLIT backward trajectory analysis
The major atmospheric transport pathways to Wakkerstroom were computed using the HybridSingle-Particle Lagrangian Integrated Trajectory (HYSPLIT) model (https://www.ready.noaa.gov/HYSPLIT.php) at 850 hPa. The trajectory represents the temporal and spatial path of trace gases in masses of air in the atmosphere. Backward trajectories are used to identify the source region of atmospheric constituents (Bera et al., 2021).
Ten-day backward trajectories were used to determine the origin of the air masses to Wakkerstroom. The model uses a hybrid between the Lagrangian approach and the Eulerian methodology. The former uses a "moving frame of reference for the advection and diffusion calculations as the trajectories or air parcels move from their initial location", while the latter "uses a fixed three-dimensional grid as a frame of reference to compute pollutant air concentrations" (Stein et al., 2015).
Ten-day backward trajectories were calculated for every day of 2020, starting at the monitoring site at midday. The trajectories were visually classified into five distinctive transport pathways, and frequencies of each pathway were calculated as a percentage for the total of 366 days. Additionally, trajectory pathways were used to determine the likely atmospheric transport of the highest and lowest concentrations of NO2 at Wakkerstroom.
Results
Meteorology conditions at Wakkerstroom
The temperature data measured at Wakkerstroom are consistent with the seasonal variation in South Africa (Walt and Fitchett, 2020). Temperatures (Figure 2a) decrease in April, reaching an all-time low in July (week 29). The highest temperature was recorded in December 2020 (week 53).

The rainfall data (Figure 2b) shows less rainfall from May to early September 2020 with the wet season starting from October 2020. The highest rainfall was seen in week 50 (December 2020).
The relative humidity percentages (Figure 2c) were highest in weeks 36 (September 2020) and 40 (October 2020), while the lowest was seen in week 33 (August 2020).
The wind rose (Figure 2d) shows that the dominant wind directions for 2020 were from the northerly to easterly sectors (>40%) (Figure 2d). The wind also blew fairly frequently from the southwesterly and westerly sectors (~20%).
Atmospheric transport to Wakkerstroom
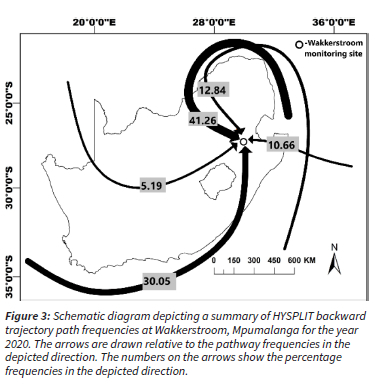
The transport pathways identified to Wakkerstroom are similar to the patterns obtained in previous studies for the Highveld (Freiman and Piketh, 2003) (Figure 3). Air transport is recirculated on the scale of approximately 500 km over the interior of South Africa for ~41% of days in 2020. Air originating from the south also represents an important pathway (30%). Approximately 5.2% (least) of the transport pathways originate from the southwest direction. Two other less dominant transport pathways were identified, namely, direct transport from the east coast of South Africa (~11 ) as well as recirculated air that passes over neighbouring countries to the North before reaching Wakkerstroom from the north-west (~13%). The trajectory analysis is consistent with the prominent wind pattern at Wakkerstroom shown in the wind rose (Figure 2d).
Surface nitrogen dioxide concentrations and meteorology over the Highveld
Surface level NO2 concentrations measured by the Pandora-2s instrument are given in Figure 4. These average surface NO2 concentrations fluctuate between 0.2 and 7.0 ppb (±0.04 and ±5.7) (Figure 4). These concentrations are lower than the South African National Air Quality Standards (NAAQS) of 40 ug/m3 (21.3 ppb) per 1-year average. Maximum surface concentrations at Wakkerstroom only just exceeded 10 ppb. The highest concentrations were detected during weeks 37 (September 2020), 16 (April 2020) and 50 (December 2020), which fall in three different seasons. There is no distinct seasonal cycle visible in the Pandora-2s data at Wakkerstroom.

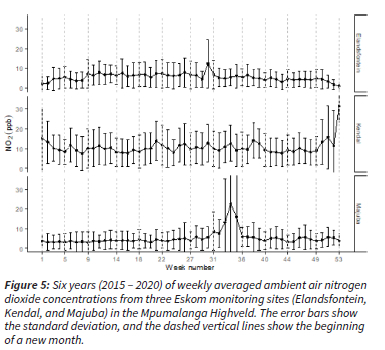
By comparison, the weekly variation of the surface nitrogen dioxide concentrations at the three Eskom monitoring sites did not show a great deal of variation throughout the year. Average weekly concentrations at Kendal, Majuba and Elandsfontein, were 10.4 (±9.1) ppb, 5.3 (±11.8) ppb and 5.8 (±5.6) ppb, respectively (Figure 5). The large standard deviation between the weekly averages is attributed to the high difference in the means ranging from 7.5 ppb to 31.47 ppb, 3.24 ppb to 27.62 ppb and 1.18 ppb to 12.53 ppb at Kendal, Majuba and Elandsfontein, respectively. Kendal MS showed the most weeks with higher NO2 concentrations than the other monitoring stations. The Kendal MS is 2 km south south-east (almost directly below) of the Kendal PS and is aligned to capture the direct high concentration plumes from the Kendal PS. At the Kendal MS there is some indication of small increases during the initial summer months (November and December 2020). Concentrations at Elandsfontein and Majuba were lower overall. Majuba monitoring site showed the most significant evidence of a seasonal peak occurring from the end of July to the middle of September. At the Majuba MS, surface NO2 concentrations exceeded 10 ppb during this season.
The comparison between the Pandora-2s data and the in-situ surface monitoring stations gives confidence that the algorithm for deriving surface concentrations from the column integrated data gives reasonable values at the Wakkerstroom site.
Atmospheric transport of highest and lowest NO2 concentrations to Wakkerstroom
To better understand the drivers of the observations at Wakkerstroom, daily trajectories were calculated for the weeks with the highest (week 37, 51 and 16) and lowest (week 15 and 9) NO2 concentrations.
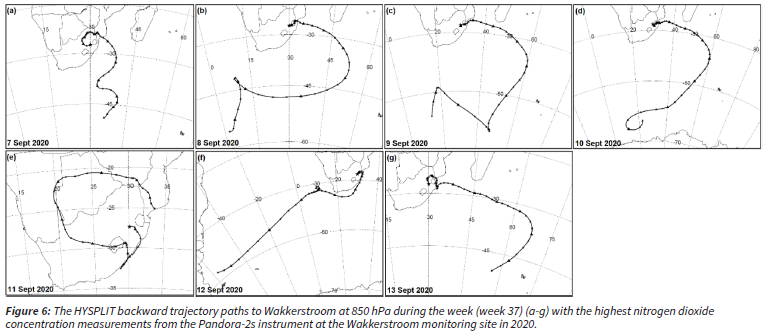
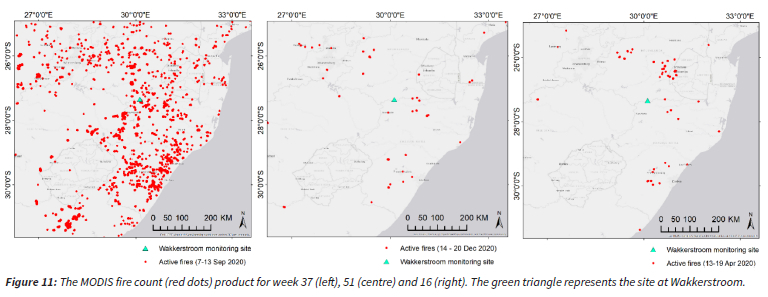
The highest concentrations (7.5 ppb ±5.7) were detected from the 7th to the 13th September 2020 (week 37). Transport of air masses to the Wakkerstroom during this week was predominantly from the east and north-east. Four out of the seven days (Figure 6b-d and f) show trajectories that pass directly over eSwatini before arriving at the Wakkerstroom MS. The remaining three days have regional scale recirculation occurring (7th, 11th and 13th September 2020) (Figures 6a, 6e and 6g). The transport over eSwatini during this week is the most likely source of the elevated surface NO2. Fire count data from the Moderate Resolution Imaging Spectro-radiometer (MODIS) confirms a high number of fire activity over the east coast of South Africa and in eSwatini during September 2020, particularly during week 37 (Figure 11).
The weeks with the second (7.1 ppb ±6.2) and third highest (6.6 ppb ±6.2) surface NO2 weekly averaged concentrations (week 51 and week 16) from the Pandora-2s instrument show atmospheric transport dominated by regional scale recirculation, particularly week 16. The trajectories show transport over the eSwatini region, during week 51 (Figure 7 and 8). The regional scale recirculation transport patterns would certainly accumulate NO2 concentrations over the source region of the Highveld as well as the greater Johannesburg (Gauteng-Tshwane metropolitan) region.
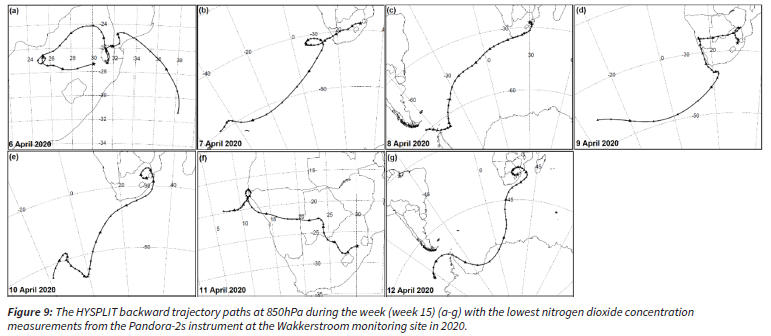
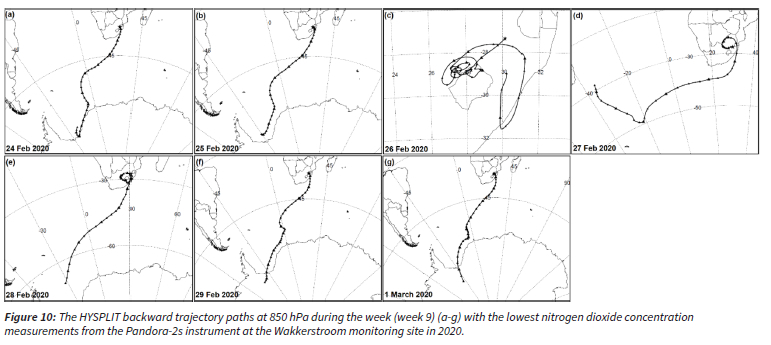
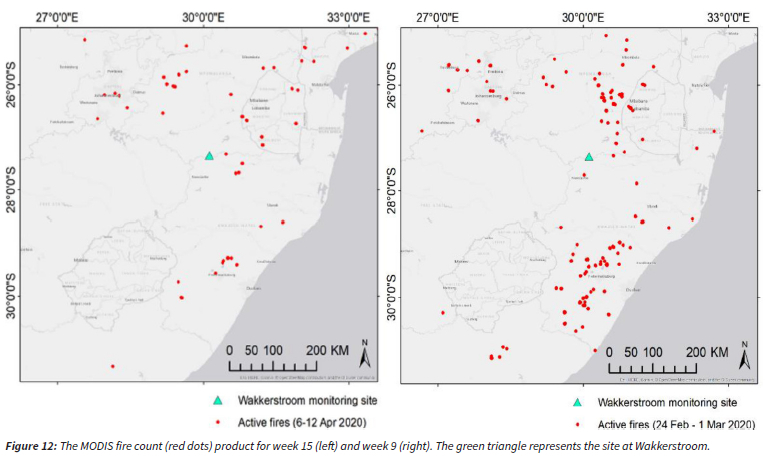
During the weeks with the lowest nitrogen dioxide concentrations (weeks 15 and 9), most of the air masses arriving at the Wakkerstroom MS were directly from the south (Figures 9 and 10). This type of air mass trajectory is typically associated with cleaner air from the Southern Ocean. The trajectories spent very little time over the subcontinent before reaching the Wakkerstroom MS. Fire count data from MODIS shows that there was biomass burning activity during weeks 15 and 9 (Figure 12), however, since the airmass trajectories were dominantly from the Southern Ocean (Figures 9 and 10), these emissions had less effect on the levels of NO2 concentrations to the Wakkerstroom MS during those weeks.
Discussion
Weekly NO2 surface concentrations at the three conventional air quality monitoring stations and the Wakkerstroom MS with the Pandora-2s instrument are comparable, given their relative location to major sources. The sites closer to the power stations (Majuba and Kendal) have higher surface nitrogen dioxide levels than those further away, albeit downwind of the power stations (Figures 1, 4 and 5). Nitrogen dioxide has a short atmospheric lifetime and therefore does not get transported far from its source (Boersma et al., 2007). Interestingly, even though the Kendal and Majuba sites are both ca. 3 km south-southeast and south-east of direct emission sources, respectively, the Kendal site had higher weekly averaged surface nitrogen dioxide levels. This can be an indication of NO2 loading; however, this study did not investigate the loading of NO2 at the monitoring sites. No discernible seasonal cycle was observed at three of the four sites, including the Wakkerstroom site with the Pandora-2s instrument. However, the Majuba MS had slightly elevated concentrations in the spring. Distinctive atmospheric transport patterns associated with the highest and lowest concentrations of NO2 have been identified. Although the regional scale recirculation was not surprising, high concentrations of NO2 associated with biomass burning emissions transported from the east coast of South Africa and eSwatini were not expected and represented an important finding. The lowest concentrations were recorded during months when some biomass burning was observed; however, these concentrations were highly associated with air masses from the south coast of South Africa. It is encouraging that these data will indeed be instrumental in unpacking the biogeochemical cycling of trace gases over the study area. In the next phase of analysing Pandora-2s data from Wakkerstroom, the NO2 concentrations in the middle and the upper troposphere will be extracted. These data will be invaluable at understanding the long-range transport of pollutants from the Highveld as well as providing important surface derived total column retrievals that can be compared to the many existing satellite retrievals. Until the installation of this instrument, there have been few attempts to validate the satellite retrieved concentration of NO2 over the Highveld.
Conclusions
The first-time surface level NO2 measurements retrieved from Wakkerstroom using the Pandora-2s instrument have introduced new confidence that the data products can be used in future to explore biogeochemical interactions in the Highveld area. This comes from the similarity in the Pandora-2s measurements to the already existing sensors in the Highveld and the instrument's capability to indicate elevated levels of surface NO2 concentrations accurately. The Pandora-2s is a valuable instrument that promises to build and close the gap of high temporal resolution long-term data.
Acknowledgements
We would like to thank the principal investigator, network operators (Daniel Santana, Moritz Mueller) and local operator (Paul Grobler) for establishing and maintaining the Pandora instrument at the Wakkerstroom site. We thank Eskom for providing the data from the air quality monitoring sites, the Climatology Research Group (CRG) at the North-West University (NWU) and Hugo De Lemos for their assistance. Our gratitude also goes to the University of the Witwatersrand and the National Research Foundation (NRF) for funding. The PGN is a bilateral project supported with funding from NASA and ESA.
References
Alade OL (2011) Characteristics of Particulate Matter over the South African Industrialized Highveld. MSc thesis, University of Witwatersrand, Johannesburg. [ Links ]
Balashov NV, Thompson AM, Piketh SJ, Langerman KE (2014) Surface Ozone Variability and Trends Over the South African Highveld from 1990 to 2007. Journal of Geophysical Research: Atmospheres, 119: 4323-4342. https://doi.org/10.1002/2013JD020555 [ Links ]
Bauwens M, Compernolle S, Stavrakou T, Müller JF, Gent J van, Eskes H, Levelt PF, A R van der, Veefkind JP, Vlietinck J, Yu H, Zehner C (2020) Impact of Coronavirus Outbreak on NO2 Pollution Assessed Using TROPOMI and OMI Observations. Geophysical Research Letters, 47: 11. https://doi.org/10.1029/2020GL087978 [ Links ]
Behm S, Haupt H (2020) Predictability of Hourly Nitrogen Dioxide Concentration. Ecological Modelling. 42. https://doi.org/10.1016/j.ecolmodel.2020.109076 [ Links ]
Belelie MD, Burger RP, Mkhatshwa G, Piketh SJ (2019) Assessing the Impact of Eskom Power Plant Emissions on Ambient Air Quality over KwaZamokuhle. Clean Air Journal, 29: 29-37. https://doi.org/10.17159/2410-972x/2019/v29n1a2 [ Links ]
Bera B, Bhattacharjee S, Sengupta N, Saha S (2021) Variation and Dispersal of PM10 and PM2.5 During COVID-19 Lockdown over Kolkata Metropolitan City, India Investigated Through HYSPLIT Model. Geoscience Frontiers. https://doi.org/10.1016/j.gsf.2021.101291 [ Links ]
Brancher M (2021) Increased Ozone Pollution Alongside Reduced Nitrogen Dioxide Concentrations During Vienna's First COVID-19 Lockdown: Significance for Air Quality Management. Environmental Pollution, 284. https://doi.org/10.1016/j.envpol.2021.117153 [ Links ]
Breeze P (2015) Coal Combustion and the Environment, in: Breeze, P. (Ed), Coal-Fired Generation, Chapter 6, 53-72. Academic Press, Boston. https://doi.org/10.1016/B978-0-12-804006-5.00012-5 [ Links ]
Cede A (2021) Manual for Blick Software Suite 1.8, Version 1-83. Manual, 183-185 pp https://www.pandonia-global-network.org/wpcontent/uploads/2021/05/BlickSoftwareSuite_Manual_v1-8-3.pdf. Accessed 17 September 2021. [ Links ]
Cede PA, Tiefengraber M (2013) CEOS Intercalibration of Ground-Based Spectrometers and Lidars. Minispectrometer Intercalibration and Satellite Validation. Report. https://www.pandonia-global-network.org/wpcontent/uploads/2019/06/LuftBlick_CEOS_ICalMinispectrometers_IntercalRecommendations_RP_2013002_v5.pdf [ Links ]
Celarier EA, Brinksma EJ, Gleason JF, Veefkind JP, Cede A, Herman JR et al. (2008) Validation of Ozone Monitoring Instrument Nitrogen Dioxide Columns. Journal of Geophysical Research: Atmospheres, 113. https://doi.org/10.1029/2007JD008908 [ Links ]
Collett KS, Piketh SJ, Ross KE (2010) An Assessment of the Atmospheric Nitrogen Budget on the South African Highveld. South African Journal of Science, 106: 35-43. DOI: 10.4102/sajs.v106i5/6.220 [ Links ]
De Lange A., Naidoo M, Garland RM, Dyson LL (2021) The Sensitivity of Simulated Surface-Level Pollution Concentrations to WRF-ARW-Model PBL Parameterisation Schemes Over the Highveld of South Africa. Atmospheric Research, 254. https://doi.org/10.1016/j.atmosres.2021.105517 [ Links ]
Freiman MT, Piketh SJ (2003) Air Transport into and out of the industrial Highveld region of South Africa. Journal of Applied Meteorology, 42: 994-1002. 10.1175/1520-0450(2003)042<0994:ATIAOO>2.0.CO;2 [ Links ]
Goldberg DL, Anenberg SC, Griffin D, McLinden CA, Lu Z, Streets DG (2020) Disentangling the Impact of the COVID-19 lockdowns on urban NO2 from natural vvariability. Geophysical Research Letters, 47. https://doi.org/10.1029/2020GL089269 [ Links ]
Grange S (2014) Technical note: Averaging wind speeds and directions. https://doi.org/10.13140/RG.2.1.3349.2006 [ Links ]
Hakkarainen J, Szelqg ME, Ialongo I, Retscher C, Oda T, Crisp D (2021) Analysing nitrogen oxides to carbon dioxide emission ratios from space: A case study of Matimba Power Station in South Africa. Atmospheric Environment: X, 10. https://doi.org/10.1016/j.aeaoa.2021.100110 [ Links ]
Herman J, Cede A, Spinei E, Mount G, Tzortziou M, Abuhassan N (2009) NO2 column amounts from ground-based Pandora and MFDOAS spectrometers using the direct-sun DOAS technique: Intercomparisons and application to OMI validation. Journal of Geophysical Research: Atmospheres, 114. https://doi.org/10.1029/2009JD011848 [ Links ]
Hickman JE, Andela N, Tsigaridis K, Galy-Lacaux C, Ossohou M, Bauer SE (2021) Reductions in NO2 burden over north equatorial Africa from decline in biomass burning in spite of growing fossil fuel use, 2005 to 2017. Proceedings of the National Academy of Sciences, 118:7. https://doi.org/10.1073/pnas.2002579118 [ Links ]
Judd LM, Al-Saadi JA, Janz SJ, Kowalewski MG, Pierce RB, Szykman JJ et al. (2019) Evaluating the impact of spatial resolution on tropospheric NO2 column comparisons within urban areas using highresolution airborne data. Atmospheric Measurement Techniques, 12: 6091-6111. https://doi.org/10.5194/amt-12-6091-2019 [ Links ]
Lourens ASM, Butler TM, Beukes JP, Van Zyl PG, Beirle S, Wagner TK, et al. (2012) Re-evaluating the NO2 hotspot over the South African Highveld. South African Journal of Science, 108. https://doi.org/10.4102/sajs.v108i11/12.1146 [ Links ]
Matimolane M (2019) Air Quality Offsets Implementation Plan for Gert Sibande District Municipality: Tutuka, Majuba, Camden and Grootvlei Power Stations: March 2019 update (No. ENV19-R059). https://www.eskom.co.za/AirQuality/Documents/AQoffsetImplPlanGertSibandePubMeetingPres.pdf [ Links ]
Naiker Y, Diab RD, Zunckel M, Hayes ET (2012) Introduction of local air quality management in South Africa: overview and challenges. Environmental Science and Policy, 17: 62-71. https://doi.org/10.1016/j.envsci.2011.11.009 [ Links ]
NASA Pandora Project. https://pandora.gsfc.nasa.gov/Research/RNA/ Accessed 16 September. [ Links ]
NASA Pandora Project. https://pandora.gsfc.nasa.gov/PGN/ Accessed 18 September 2021. [ Links ]
Omrani H, Omrani B, Parmentier B, Helbich M (2020) Spatio-temporal data on the air pollutant nitrogen dioxide derived from Sentinel satellite for France. Data in Brief, 28. https://doi.org/10.1016/j.dib.2019.105089 [ Links ]
Qi X, Zhu S, Zhu C, Hu J, Lou S, Xu L et al. (2020) Smog chamber study of the effects of NOx and NH3 on the formation of secondary organic aerosols and optical properties from photo-oxidation of toluene. Science of Total Environment, 727:138632. https://doi.org/10.1016/j.scitotenv.2020.138632 [ Links ]
Scorgie Y, Thomas R (2006) judd Mpumalanga Highveld cumulative scenario planning study: air pollution compliance assessment and health risk analysis of cumulative operations of current, RTS and proposed Eskom Power Station located within the Mpumalanga and Gauteng Provinces (No. APP/06/ESKOM-05 Rev 1.0). https://cer.org.za/wpcontent/uploads/2018/08/Airshed_Infotox_MpumalangaCumulativeReport_Rev1.pdf [ Links ]
Seinfeld JH, Pandis SN (2016) Atmospheric Chemistry and Physics: From Air Pollution to Climate Change. John Wiley & Sons. [ Links ]
Shabbir Y, Khokhar MF, Shaiganfar R, Wagner (2016) Spatial variance and assessment of nitrogen dioxide pollution in major cities of Pakistan along N5-Highway. Journal of Environmental Science, 43: 4-14. https://doi.org/10.1016/jJes.2015.04.038 [ Links ]
Shikwambana L, Mhangara P, Mbatha N (2020) Trend analysis and first time observations of sulphur dioxide and nitrogen dioxide in South Africa using TROPOMI/Sentinel-5 P data. International Journal of Applied Earth Observation and Geoinformation, 91. https://doi.org/10.1016/j.jag.2020.102130 [ Links ]
Stein AF, Draxler RR, Rolph GD, Stunder BJB, Cohen MD, Ngan F (2015) NOAA'S HYSPLIT Atmospheric Transport and dispersion modeling system. Bulletin of the American Meteorological Society, 96: 2059-2078. https://doi.org/10.1175/BAMS-D-14-00110.1 [ Links ]
Thomas R, Scorgie Y (2006) Air quality impact assessment for the proposed new coal-fired power station (Kendal north) in the Witbank area (No. APP/06/NMS-01 Rev 0.2). https://www.eskom.co.za/OurCompany/SustainableDevelopment/EnvironmentalImpactAssessments/Documents/Air_quality_part_1.pdf [ Links ]
Tiefengraber M, Cede A, Gebetsberger M, Muller M (2021) Fiducial Reference Measurements for Air Quality. New Algorithm and Product Development Plan (No. version 5.1). https://www.pandoniaglobal-network.org/wpcontent/uploads/2021/07/LuftBlick_FRM4AQ_NewAlgorithmPlan-ATBD_RP_2019005_v5.1.pdf [ Links ]
Verhoelst T, Compernolle S, Pinardi G, Lambert JC, Eskes HJ, Eichmann KU et al. (2021) Ground-based validation of the Copernicus Sentinel-5P TROPOMI NO2 measurements with the NDACC ZSL-DOAS, MAX-DOAS and Pandonia global networks. Atmospheric Measurement Techniques, 14: 481-510. https://doi.org/10.5194/amt-14-481-2021 [ Links ]
Walt AJ van der, Fitchett JM (2020) Statistical classification of South African seasonal divisions on the basis of daily temperature data. South African Journal of Science, 116. https://doi.org/10.17159/sajs.2020/7614 [ Links ]
Wang G, Deng J, Zhang Y, Zhang Q, Duan L, Hao J et al. (2020) Air pollutant emissions from coal-fired power plants in China over the past two decades. Science of the Total Environment, 741. https://doi.org/10.1016/j.scitotenv.2020.140326 [ Links ]
Wang S, Hao J (2012) Air quality management in China: Issues, challenges, and options. Journal of Environmental Sciences, 24: 2-13. https://doi.org/10.1016/S1001-0742(11)60724-9 [ Links ]
Watanabe MDB, Ortega E (2011) Ecosystem services and biogeochemical cycles on a global scale: valuation of water, carbon and nitrogen processes, Environmental Science & Policy,14 (6). https://doi.org/10.1016/jJ.envsci.2011.05.013 [ Links ]
Wedow JM, Ainsworth EA, Li S (2021) Plant biochemistry influences tropospheric ozone formation, destruction, deposition, and response. Trends in Biochemical Sciences, 1813. https://doi.org/10.1016/j.tibs.2021.06.007 [ Links ]
Xu G, Xiao J, Oliver DM, Yang Z, Xiong K, Zhao Z, Zheng L, Fan H, Zhang F (2021) Spatio-temporal characteristics and determinants of anthropogenic nitrogen and phosphorus inputs in an ecologically fragile karst basin: Environmental responses and management strategies. Ecological Indicators, 133:108453. https://doi.org/10.1016/j.ecolind.2021.108453 [ Links ]
Zhao X, Fioletov V, Cede A, Davies J, Strong K (2016) Accuracy, precision, and temperature dependence of Pandora total ozone measurements estimated from a comparison with the Brewer triad in Toronto. Atmospheric Measurement Techniques, 9: 5747-5761. https://doi.org/10.5194/amt-9-5747-2016 [ Links ]
Zhao X, Griffin D, Fioletov V, McLinden C, Davies J, Ogyu A et al. (2019) Retrieval of total column and surface NO2 from Pandora zenith-sky measurements. Atmospheric Chemistry and Physics, 19: 10619-10642. https://doi.org/10.5194/acp-19-10619-2019 [ Links ]
Zhao X, Griffin D, Fioletov V, McLinden C, Cede A, Tiefengraber M et al. (2020) Assessment of the quality of TROPOMI high-spatial-resolution NO2 data products in the Greater Toronto Area. Atmospheric Measurement Techniques, 13: 2131-2159. https://doi.org/10.5194/amt-13-2131-2020 [ Links ]
Zyrichidou I, Koukouli ME, Balis D, Markakis K, Poupkou A, Katragkou E et al. (2015) Identification of surface NOx emission sources on a regional scale using OMI NO2. Atmospheric Environment, 101: 82-93. https://doi.org/10.1016/j.atmosenv.2014.11.023 [ Links ]
Received: 19 February 2022
Reviewed: 25 March 2022
Accepted: 5 May 2022
An earlier version of this paper was presented at the National Association of Clean Air (NACA) Conference in October 2021 and was published in its Proceedings.

