


Servicios Personalizados
Articulo
 Inglés (pdf)
 Articulo en XML
 Referencias del artículo
Indicadores

Links relacionados
-
 Citado por Google
 -
 Similares en Google
Compartir

 Permalink
Clean Air Journal
versión On-line ISSN 2410-972X
versión impresa ISSN 1017-1703
Clean Air J. vol.32 no.1 Pretoria 2022
http://dx.doi.org/10.17159/caj/2022/32/1.12508
RESEARCH ARTICLE
The use of dirty fuels by low-income households on the South African Highveld
Christiaan J. Pauw; H. Montagu Murray; Marcus A. Howard
Nova Institute, 13 Beuke Place, Gauteng, 6014, South Africa
ABSTRACT
Meaningful proportions of households on the South African Highveld regularly use energy carriers that result in the emission of significant quantities of particulate and gaseous pollutants. Dirty fuels are mostly used by lower-income households, with the exception of recreational wood use that is also prevalent in higher-income households. The dirty fuel use patterns and trends observed on the Highveld are the result of the unique combination of the utility, accessibility, affordability, availability, and desirability of the energy carriers and equipment, climatological factors, markets and infrastructure, as well as the inertia of historic energy use patterns. There are no systematic reviews and prognosis of the use of dirty fuels by low-income households on the South African Highveld that consider critical recent events such as the Covid pandemic and emerging dynamics such as the just transition movement. In this article we will use a literature review as well as our own research to describe dirty fuel use by low-income households on the Highveld, paying specific attention to changes over time. We will attempt to describe what is being used, who the users are, and for which utilities fuels are being used. From these descriptions, specific patterns emerge that shed light on possible avenues and prospects for ending dirty fuel use on the Highveld.
Keywords: Domestic solid fuel use, domestic coal use, domestic wood use, domestic paraffin use, dirty fuels, Highveld Priority Area, energy use patterns, energy use interventions, air quality, low-income settlements
In this article we will review available information on the use of dirty fuels (coal, wood, paraffin and dung) by low-income households on the Highveld. We focus particularly on coal and wood use in the Highveld Priority Area. We will review changes over time and offer a view on the prospects of ending dirty fuel use on the Highveld.
Background
Short chronology of important events
Significant societal changes occurred on the Mpumalanga Highveld in South Africa and in the world at large since Tyson, Kruger and Louw published their report "Atmospheric pollution and its implications on the Eastern Transvaal Highveld" in April 1988 (P. Tyson et al., 1988, see also Tyson et al., 1988).
The Berlin wall fell less than two years later in November 1989 (Langenbacher 2019). The end of the cold war ushered in a series of international and local transformations. South Africa's own political and social transformation gained irrevocable momentum with the release of Nelson Mandela in February 1990 (Mandela 2013). The Rio Earth Summit (formally known as the United Nations Conference on Environment and Development) was held in June 1992, where the UNFCCC was adopted (United Nations 1992). After South Africa's first democratic election in April 1994 local governments were re-organised, first into transitional councils and later into the current local municipalities and district municipalities.
The government of national unity implemented the Reconstruction and Development Programme (RDP) which intended, inter alia, the construction of a million houses for low-income households (Parliament, 1994). The appearance of these subsidy houses (colloquially known as 'RDP houses') and their accompanying services changed the character of townships on the Mpumalanga Highveld and in South Africa, in general.
The Kyoto Protocol was signed on 11 December 1997 and entered into force in February 2005, after ratification by Russia. The first implementation period took effect from 2008 to 2012. This marked the start of a growing awareness of, and actions to mitigate, anthropogenic climate change.
In the latter part of the 1990's, the then Department of Minerals and Energy (DME) implemented the Low-Smoke Fuel programme aimed at reducing air pollution caused by domestic coal use, particularly in townships. The programme sponsored basic research as well as a macro-scale experiment in Qalabotsha in 1997. At the same time, significant research was undertaken into the health effects of air pollution from domestic sources, notably by Petro Terblanche.
Following the macro-scale experiment, the DME formulated the Integrated Household Clean Energy Strategy which envisioned a suite of measures including, behaviour change measures such as improved top-down ignition of coal fires, low-smoke fuels, thermal insulation of houses, as well as cleaner fuels and stoves (Surridge et al. 2005).
On 19 November 1998, President Mandela signed the National Environmental Management (Act 107 of 1998, Government Gazette No. 19519 notice 1540). Within the framework of this act, the National Environment Management: Air Quality Act (NEM:AQA Act 39 of 2004) came into effect in February 2005. This act marked a change from only managing emissions to also managing air quality states. Under the NEM:AQA, National Ambient Air Quality Standards (NAAQS) were instituted and three air quality priority areas have since been declared.
The first priority area to be declared was the Vaal Triangle Airshed Priority Area (VTAPA). It was declared in terms of Section 18(1) of NEM:AQA under Notice No. 365 of 21 April 2006. Clarification that Heidelberg is not included in the VTAPA was later published in Government Gazette No. 30164 of 17 August 2007, Notice 711. The area includes parts of the City of Johannesburg and the Emfuleni, Midvaal and Metsimaholo Local Municipality.
The Highveld Priority Area (HPA) was declared on 23 November 2007 (Government Gazette No. 30518, notice 1123). The area includes the following municipalities: Ekurhuleni Metropolitan Municipality (MM), Lesedi Local Municipality (LM), Govan Mbeki LM, Dipaleseng LM, Lekwa LM, Msukaligwa LM, Pixley ka Seme LM, Delmas LM, Emalahleni LM and Steve Tshwete LM. The HPA will be the area of interest in the analyses that follow.
The Waterberg-Bojanala Priority Area (WBPA) was declared on 15 June 2012 (Government Gazette No. 35435, Notice 495). The WBPA encompasses the Waterberg District Municipality in Limpopo and parts of the Bojanala Platinum District Municipality in the North West Province. The WBPA is unique in that it was declared a priority area based on potential future development, rather than on the air quality prevalent at the time.
On 9 March 2010, minister Buyelwa Sonjica declared a list of activities which result in atmospheric emissions which have or may have a significant detrimental effect accompanied by minimum emission standards (MES) for each. (Government Gazette No. 33064, notice 248). The MES took effect on 1 April 2010. Section 5 stipulates that new plant had to comply with the new plant minimum emission standards on the date of publication. Existing plant had to comply with existing plant standards within 5 years and thereafter had another five years to comply with new plant standards (i.e., within 10 years). Section 6 allowed for an application to be made to the National Air Quality Officer for the postponement of the compliance timeframes in Section 5 for an existing plant under certain conditions. Many businesses opted to apply for postponement of the compliance timeframes for existing plant that were to take effect on 1 April 2015. In 2014, 34 such applications were lodged. A further 20 followed between 2015 and 2017 (Khumalo 2018).
From 2010 onwards, the idea of air quality offsets as a viable air quality management tool started to develop (Fischer and Pauw 2010). Eskom conducted an air quality offsets prefeasibility study in 2012 and 2013 (EScience Associates (Pty) Ltd and Nova Institute 2013). Sasol conducted a baseline study in eMbalenhle, Lebohang, eMzinoni and KwaDela together with a pilot implementation in KwaDela between 2013 and 2015. During the pilot implementation, 505 RDP houses were retrofitted with thermal insulation. Indoor temperature and solid fuel use were monitored in a sample of households (Sasol Limited, 2020:83).
DEA was already working on an overarching framework for environmental offsetting in 2013. (Department of Environmental Affairs, 2013). A draft Air Quality Offsets Policy was issued for public comment in January 2014 (Republic of South Africa, Department of Environmental Affairs 2014). After publishing a draft in 2015 (Government Gazette 38894, notice 597), Minister Edna Molewa published the Air Quality Offsets Guideline on 18 March 2016 (Government Gazette 39833, notice 333). From 2015 onwards, the requirement to implement air quality offsets often accompanied the granting of postponements of the compliance time frames for MES. This was the case for Eskom's coal-fired power stations as well as for Sasol's Secunda and Sasolburg operations as well as Natref.
On 25 September 2015, the General Assembly of the United Nations adopted a resolution entitled Transforming our world: the 2030 Agenda for Sustainable Development. The core of this resolution are 17 sustainable development goals (SDGs). Included in these and relevant for this analysis are: Goal 7. Ensure access to affordable, reliable, sustainable and modern energy for all, and Goal 13. Take urgent action to combat climate change and its impacts. South Africa produced a SDG Baseline Report in 2017, followed by a Country Report in 2019. In 2017, the reported value for the indicator Proportion of population with access to electricity (Indicator 7.1.1) was 95.3 %. It is worth noting that the 2019 General Household Survey specifies that 85 % of South African households were connected to the main electricity grid.
Shortly thereafter, in November and December 2015, the Paris Climate agreement was negotiated by the 196 parties to the United Nations Framework Convention on Climate. The final agreement was signed on 22 April 2016 and became effective on 4 November 2016. Article 2 of the agreement highlights the following objective, "...to strengthen the global response to the threat of climate change, in the context of sustainable development and efforts to eradicate poverty". This includes keeping the increase in the global average temperature to well below 2 °C above pre-industrial levels and to pursuing efforts to limit the temperature increase to 1.5 °C above pre-industrial levels. Enabling adaptation, climate resilience and low greenhouse gas emissions development was well as financing mechanisms for the above are further objectives. The parties will each undertake and communicate ambitious actions to reach these objectives. According to article 4 each party shall prepare, communicate and maintain successive nationally determined contributions (NDC) that it intends to achieve (Republic of South Africa 2015, 2021). In its first NDC (October 2015) South Africa committed to keep national greenhouse gas emissions between 398 and 614 Mt CO2-eq by 2025 and 2030 and follow a peak, plateau and decline greenhouse gas emissions trajectory with greenhouse gas emissions peaking between 2020 and 2025. At the time of writing, the 2021 submission was open for public comment. It contained a more ambitious mitigation target of limiting annual greenhouse gas emissions to between 398-510 Mt CO2-eq for the period 2021-2025 and between 398-440 Mt CO2-eq for the period 2026-2030 (NDC draft p 14). The upper range of the proposed 2030 is 28% below the 2015 NDC targets.
On 15 March 2020, President Ramaphosa declared a national state of disaster in terms of the Disaster Management Act (Act 57 of 2002) following the first confirmed case of coronavirus disease 2019 (COVID-19). A national lockdown took effect on 27 March 2020 which led to a severe economic decline. A series of restrictions has been in effect up to the time of writing. At the time of writing, the official death toll was 87 052.
Demographics
The results of the 2011 census, the most recent national census conducted in South Africa, indicated that the HPA was home to 4.7 million persons or 1.4 million households. Based on historic population growth rates, we estimate the 2021 population at around 5.9 million persons and 2.0 million households.
This population includes vulnerable groups. In 1996, for example, the number of children in the HPA who were younger than five years of age was estimated to be 291 000. This number increased to 326 000 in the 2001 census and then to 470 500 in the 2011 census. At least 100 000 of the latter were less than one year of age at the time of the census. Informed by the General Household Surveys (GHSs) conducted between 2011 and 2019 (no GHS was conducted in 2020 due to the COVID-19 pandemic), the number of children younger than five years of age currently living in the HPA might be as much as 650 000.
In 2019, approximately half of the population (3.1 million people) in the Nkangala and Gert Sibande District Municipalities and the Ekurhuleni Metropolitan Municipality (the three district municipalities that make up the bulk of the HPA) lived below the upper bound poverty line of R 1 227 per person per month in 2019 (Republic of South Africa, Department of Cooperative Governance 2020c, 2020a, 2020b; Statistics South Africa 2021).
The impact of household use of dirty fuels on the Highveld
Environmental effects
There is extensive literature dealing with the effects of domestic solid fuel use on air quality. A bibliography of sources prior to 2008 can be found in Friedl et al. (2008). Notable studies since include Adesina et al. (2020), Chidhindi et al. (2019), Language et al. (2016), Moletsane et al. (2021) Muyemeki et al. (2021). An analysis of long-term trends in the annual average PM10, PM2.5 and SO2 in the HPA using the Theil-Sen trend analysis by Feig et al. (2019) showed a very slight improving trend in annual average concentrations in the long-term over a number of sites in the HPA, including sites where solid fuel use plays a significant role.
Household solid fuel use leads to episodic and localised exceedances of air quality standards, specifically the 24-hour standard for PM10 and PM2.5. A clear seasonal and diurnal pattern is present. The diurnal particulate concentrations follow the overlap of human activity patterns. Because solid fuel use is closely associated with space heating, higher emissions occur in winter. Combined with poor dispersion conditions in winter, this results in the bulk of exceedances of national ambient air quality standards occurring in winter. A peak in monthly average concentrations occur in July. Hourly averaged concentrations show a bimodal daily pattern with a morning peak at approximately 07:00 and an, often larger, evening peak at around 19:00. The pattern in more articulated in winter. The daily and annual pattern is well illustrated by Hersey et al. (2015).
The typical daily and seasonal pattern as well as the localised nature of the impact of domestic fuel use is demonstrated by Langerman et al. (2018) who analysed the difference in mean hourly PM10 concentrations between Hendrina and Kwazamokuhle for January and July 2015. Although the settlements are about three kilometres apart, the difference is stark. The winter diurnal profile for Kwazamokuhle, where solid fuel use is common, shows the characteristic bimodal pattern with a morning peak between 06:00 and 08:00 at about 150 μg.m-3 and an evening peak between 17:00 and 18:00 in excess of 250 μg.m-3. In summer the pattern is less articulated with peaks at approximately 50 μg.m-3 and 75 μg.m-3 respectively. In comparison, the mean hourly PM10 concentrations at Hendrina is much lower. A bimodal pattern is present in winter with peaks at approximately 75 μg.m-3, but is totally absent in summer.
Source apportionment studies, for example those by Muyemeki et al. (2021) and Walton (2021), shows that domestic coal and wood use contribute proportionally more to fine particulate concentrations than to coarse particles.
Human health effects
The adverse human health effects of air pollution resulting from domestic dirty fuels have been extensively studied. A large body of work resulted from the efforts of Petro Terblanche during the 1990's. Once again, Friedl et al (2008) has an extensive bibliography for sources prior to 2008. In 2010, a study on ambient air quality, potential exposure to air pollution and air-related human health was conducted in KwaGuqa, Mpumalanga (Wright et al. 2011). Since then, two large-scale health studies have been conducted, one in the Vaal Triangle and one in the HPA.
Data sources
This section describes the data sources used in the description of dirty fuel use on the Highveld that is presented in section 3.
Official statistics
Data on dirty fuels are collected by Statistics South Africa as part of the National Census, the General Household Survey (GHS) and the Income and Expenditure Survey (IES).
Three national censuses have been conducted in South Africa to date, since the dawn of our democracy in 1994 - the first in 1996, the second in 2001 and the third in 2011. The National Census collects data on a person as well as household level, but the data are always aggregated to higher levels before publication (in the interest of the preservation of households' anonymity). The lowest level of aggregation on which the data sets are currently available from Statistics South Africa's SuperWEB2 platform is that of electoral ward. An anonymised 10 % sample of each data set is available to the public on household and person level, but the lowest spatial level to which these data sets can be aggregated is district municipality.
The question in the National Census questionnaire that is of primary interest to this study is about the energy carriers that household use for cooking, space heating and lighting. The question reads: "What type of energy/fuel does this household MAINLY use for cooking, heating and lighting?" The response options are electricity, gas, paraffin, wood, coal, candles, animal dung, solar, other and none . 'Candles' is not a valid option as a fuel for cooking or heating, while coal, wood and animal dung are not valid options for lighting.
The General Household Survey is conducted annually, albeit only on a sample of households. Like the National Census, it collects data at household- as well as at person level. The questionnaire used for the survey includes a verbatim copy of the census' question on main energy carriers, allowing cross-survey comparisons. The aggregated data sets of the GHS are, however, currently available to the public only on provincial and stratum ('urban' or 'non-urban') level.
The way in which the question is formulated in the census is poorly suited to the reality of multiple energy carrier use by households. This phenomenon is sometimes referred to as fuel stacking (Langerman 2018).
Significantly more households use solid fuels than is reported in the national census or the GHS. Pauw et al (2013) analysed data from surveys conducted by the Nova Institute in 2011 in 42 subplaces and compared results to the 2011 national census results. The subplaces in Mpumalanga and Gauteng fall within the HPA, the subplaces in the Free State are in the question in the surveys by the Nova Institute did not differentiate between primary and secondary use: It just asked: "Do you use coal in your house". The results are shown in Figure 1. The error bars show the 95 % confidence interval for the survey-based estimation of the proportion of households who use coal. For low-income subplaces where the national census reported coal use to be scarce, prevalence of coal-using households is systematically under-reported. The degree of under-reporting decreases as the proportion of primary coal users increases, especially above 50 %.
Industry-sponsored research
Sasol Secunda commissioned an extensive baseline assessment for its air quality offsets programme in 2013 in eMbalenhle, eMzinoni, Lebohang and Kwadela. This research included a general household survey as well as a detailed household energy use survey, direct monitoring of household fire making cycles and weighing of fuel.
In Kwadela, Sasol sponsored an experiment that compared two thermal insulation configurations and a reference group in terms of fuel consumption, stove use and end-user satisfaction.
In 2015, the Sasolburg operations of Sasol commissioned a baseline study for its air quality offset programme in Zamdela in the Free State. The study included a general household survey, a detailed household energy use survey, direct monitoring of household fire making cycles and weighing of fuel.
Eskom conducted a pilot study to test interventions to reduce air pollution from domestic coal burning in Kwazamokuhle in 2016. The study included a general household survey, a detailed household energy survey and direct monitoring of household fire making cycles and weighing of fuel in a sample of households. Coal samples from coal merchants in Kwazamokuhle was analysed for energy value, carbon content and ash content.
The study compared the effects of three potential interventions: thermal insulation, an electricity subsidy or a 'smokeless' coal stove. The study design included a control group, and results included fuel consumption, stove use and end-user satisfaction.
Data collected by the Nova Institute
Between 2007 and 2016, the Nova Institute implemented demonstrations of the improved top-down ignition technique (called Basa Magogo! or Basa njengo Magogo) in selected high coal-use areas in Gauteng, the Free State, Mpumalanga and KwaZulu-Natal. This programme was financed through the selling of verified emission reduction (VERs), mostly Gold Standard VERs. VERs are issued after submission of an annual monitoring report verified by a competent third-party. In total, 87 such reports were submitted and verified, each with a corresponding household and coal merchant survey (accessible on https://register.goldstandard.org). The annual household surveys monitored coal-use stove type and use of the alternative top-down ignition technique in the subplaces where implementation had taken place and where there were indications that there would still be a significant number of users. The coal merchant survey tracked the format in which coal was sold, the price of coal and, in some cases, the mine where the coal was sourced.
Dirty fuel use on the Highveld
Trends in the proportion of dirty fuel users
The proportional of households that use dirty fuels as primary energy carriers for cooking, space heating or lighting has been declining since at least the 1990's, but probably already since the 1980's.
According to the census data all municipalities within the HPA experienced a decrease between 1996 and 2011 in the percentage of households who used dirty fuels as their primary energy carriers for cooking or space heating1. The most remarkable decrease in primary dirty fuel use for cooking was seen in the Lekwa Municipality, Mpumalanga, where the percentage of households who mainly used coal, wood or paraffin for cooking dropped from 53.71% in 1996 to 16.69 % in 2011. The smallest decrease occurred in the Msukaligwa Municipality (also in Mpumalanga), which dropped from 60.57 % in 1996 to 47.77 % in 2011.
With regards to space heating, the Lesedi Municipality in Gauteng experienced the largest decrease between 1996 and 2011, with 48.39 % of households primarily using a dirty fuel for space heating in 1996, and less than half of that (20.93 %) in 2011. Msukaligwa, the most easterly of the HPA municipalities, was once again the municipality that experienced the smallest decrease, with the percentage of households who primarily used dirty fuels for heating still fairly high in 2011 at 49.23 %, after dropping from 60.26 % in 1996.
In 1996 the Pixley ka Seme Municipality, the municipality in the HPA extending furthest to the south, topped all the lists - it had the highest percentages of households using mainly dirty fuels for cooking (69.47%), space heating (67.83%) and paraffin for lighting (8.84%). In the other corner of the HPA, the Ekurhuleni Municipality (in Gauteng) - the municipality furthest to the west of the HPA- had the lowest percentages of households who primarily cooked (33.92%) and heated their homes (34.80%) with dirty fuels. However, it only had the third-lowest percentage of households (2.98 %) who used a dirty fuel for lighting. By 2011, the Pixley ka Seme Municipality still had the highest percentage of households who primarily heated their homes with a dirty fuel (50.17 %), but the Msukaligwa Municipality now had the largest percentage of households who primarily cooked with a dirty fuel (47.77 %), while the Ekurhuleni Municipality had the largest percentage of households who used paraffin for lighting (4.61 %). Interestingly, Ekurhuleni is the only HPA municipality who consistently saw an increase across the three census years in the percentage of households who primarily used paraffin for lighting: 2.98 % in 1996, 3.87 % in 2001 and 4.61 % in 2011.
Trends in the number of dirty fuel users
When looking at the absolute numbers of dirty fuel users in the HPA, a very different picture emerges. Ekurhuleni, one of the smaller municipalities in the HPA by area, and one of the only two HPA municipalities who form part of the Gauteng province, had vastly more households using dirty fuels than any of the other municipalities in the HPA. In 1996, Ekurhuleni had 184 047 households cooking primarily with dirty fuels, 188 805 households heating their homes primarily with dirty fuels, and 16 183 households using mainly dirty fuels for lighting. The Govan Mbeki Municipality in Mpumalanga - which ranked second on the list of HPA municipalities with the most users of dirty fuel in 1996 - had 25 631 households cooking, 25 248 households space heating, 2 940 households lighting with dirty fuels, i.e. only 13.9 %, 13.4 % and 18.2 % of Ekurhuleni's numbers.
While all municipalities in the HPA saw a decrease between 1996 and 2011 in the percentage of households cooking and space heating with dirty fuels (as discussed earlier), two HPA municipalities (Emalahleni and Msukaligwa) saw an increase in the absolute number of households cooking with dirty fuels, six HPA municipalities had an increase in the absolute number of households heating their homes with dirty fuels (Emalahleni, Msukaligwa, Steve Tshwete, Ekurhuleni, Victor Khanye and Pixley Ka Seme), and two HPA municipalities experienced an increase in the absolute number of households primarily using paraffin for lighting (Ekurhuleni and Emalahleni). At the time of the 2011 census results, however, Ekurhuleni still topped all the lists, with 178 088 households cooking, 189 572 households space heating, and 46 834 households mainly using paraffin for lighting. It is notable that, in absolute terms, dirty fuel use for cooking decreased only slightly, dirty fuel use for heating increased slightly and there was a substantial increase in the number of households who use paraffin for lighting. This indicates a growth in households living in unserviced informal houses.
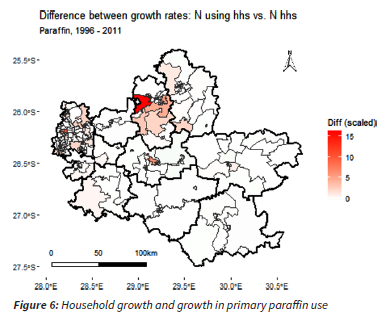
The increases that these municipalities experienced are largely attributable to sheer population growth. A handful of "hotspots" within each municipality, however, can be identified where the growth rate in the number of households who use dirty fuels as their primary energy carriers (growth rate A) exceeds the growth rate in the absolute number of households in the area (growth rate B). The map below (Figure 2) shows where these hotspots are located in each HPA municipality when looking at dirty fuels as primary energy carriers for cooking. Shades of green indicate areas where growth rate A is slower than growth rate B; the darker the green, the slower A is compared to B - signalling a general move away from the use of dirty fuels as primary energy carrier for cooking. Shades of red indicate areas where growth rate A exceeds growth rate B; the darker the red, the greater A is compared to B - signalling a general move towards the use of dirty fuels as primary energy carrier for cooking.
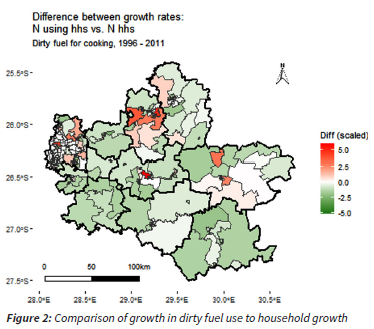
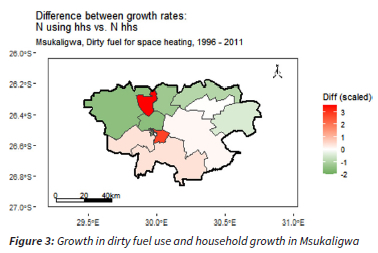
The Msukaligwa Municipality serves as a good example (the easternmost local municipality, demarcated in black, in the HPA in Figure 2, detailed by ward in Figure 3). Seven of the nineteen wards in the municipality had fewer households in 2011 who heated their homes mainly with dirty fuels than in 1996. A further six wards did experience an increase between 1996 and 2011 in the absolute number of dirty fuel space heating households, but the rate of the increase was in each case lower than the household growth rate of the ward in question. In the case of the remaining six wards, however, the number of households primarily heating with dirty fuels grew at a faster rate than the absolute number of households in the ward. This was especially pronounced in two wards: in the ward that encompasses Breyten and surrounds (such as KwaZanele) the number of households heating their homes with coal, wood or paraffin increased from 375 in 1996 to 2379 in 2011 (i.e. growth rate 13.11 % p.a.), while the absolute number of households in the ward increased over this period from 1536 to 4656 (growth rate of 7.66 % p.a.); in the ward that encompasses Ermelo and surrounds (such as Wesselton) the number of dirty fuel space heating households increased from 245 in 1996 to 1479 in 2011 (growth rate of 12.71 % p.a.), but the absolute number of households increased over this period from 857 to only 2379 (i.e. growth rate of 7.04 % p.a.).
Although it is useful to group coal, wood and paraffin together as "dirty fuel" it is important to also be aware of the trends and hotspots related to individual fuels - especially in cases where large-scale switches occurred between them - as the fuels have different impacts on air quality and different health risks associated with them.
On the scale of the HPA as a whole, coal user numbers decreased between 1996 and 2011 at a rate of 1.8 % p.a.; paraffin and wood use, on the other hand, increased at rates of 1.7 % and 2.95 % p.a. respectively. Where the majority of households in the HPA who primarily used dirty fuels in 1996 were coal users (62.8 %), the data from the 2011 census indicated that the majority were now paraffin users (66.1 %); coal using households had dropped to 46.8 % of dirty fuel using households, and wood use stood at 17.3 %. This increase in paraffin use is, however, mostly attributable to the dramatic rise in paraffin use in the municipalities of Ekurhuleni, Emalahleni and Steve Tshwete (see Figure 6). When these municipalities are excluded from considerations, it becomes clear that the rest of the HPA actually experienced a decrease in paraffin use and an increase in coal use between 1996 and 2011: at the time of the latter census, 69.5 % of dirty fuel using households in the rest of the HPA were coal users (up from 62.0 % in 1996), while only 16.5 % were paraffin users (down from 21.4 %); wood use experienced a slight decline by 0.03 % p.a. between 1996 and 2011, ending at 24.3 % of dirty fuel using households in 2011.
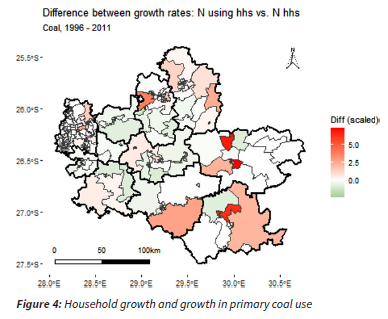
The most significant increases in coal use (still excluding the Ekurhuleni, Emalahleni and Steve Tshwete municipalities) occurred in specific wards spread throughout Lekwa, Msukaligwa and Pixley Ka Seme, although three of the four remaining municipalities also had at least one ward each where the growth rate in the number of households using coal was higher than the growth rate of the absolute number of households in the ward (Figure 4).
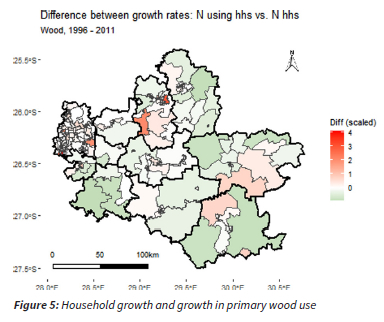
Wood use dynamics appear more complex as the prevalence of wood use decreased significantly in some areas, but also increased significantly in others (Figure 5). In the Lesedi Municipality, for example, one ward saw a negative growth rate among wood using households, while an adjacent ward experienced positive growth.
Although the dramatic uptake of paraffin in Emalahleni, Ekurhuleni and Steve Tshwete overshadow the trends in coal and wood use in these municipalities, it should be noted that some areas within these municipalities indeed also experienced an uptake of coal and wood.
With regard to dirty fuel switches, the census data for at least 13 wards across the HPA show signs of large-scale switches from coal to paraffin and/or wood between 1996 and 2011 (Figure 7). In Ekurhuleni ward 101, for example, the percentage of households using mainly coal for cooking dropped by 29.31 percentage points but that of paraffin increased by 38.58 percentage points; similarly, coal use for space heating decreased in the ward by 32.06 points, but paraffin and wood use increased with a collective total of 25.96 points. Comparable shifts are evident in eight other wards in Ekurhuleni, three wards in Emalahleni and one in Steve Tshwete.
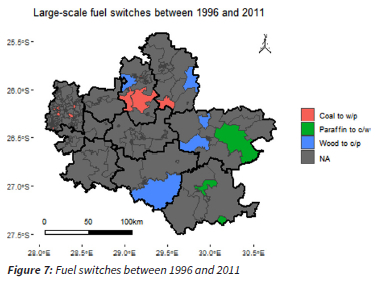
Some wards in the Msukaligwa and Steve Tshwete municipalities seem to have experienced a switch from wood for cooking and space heating to coal and/or paraffin. In ward 3007, for example, the percentage of households who heat their homes primarily with wood decreased by 7.54 points while the percentage of those who use coal for the same task increased by 7.03 points. At least one ward in Lekwa and another in Emalahleni also showed signs of transitions away from wood towards coal or paraffin.
Lastly, at least two wards in the Pixley Ka Seme municipality seem to have had notable proportions of dirty fuel using households switching from paraffin to coal. Ward 4007 is a good example: the percentage of households using coal for space heating rose by 26.97 points between 1996 and 2011, while the percentage for paraffin fell with 24.82 points over the same period.
Fuel types and formats
Bituminous coal is commonly used by households on the highveld. The quality of coal used by households on the highveld varies - even within a single town. As part of the Eskom air quality offset pilot in 2015 in Kwazamokuhle, five bags of coal were obtained from five merchants each. The energy content of the coal was determined according to the ISO 1928 method, ash content according to ISO 1997 and carbon content according to ASTM 5373. The gross calorific value varied between 20.61 MJ/kg and 29.59 MJ/kg, ash content varied between 11.90 % and 34.80 % and the carbon content varied between 43.61 % and 73.30 %.
In all the areas where Nova conducted its coal merchant survey between 2008 and 2016, there were coal merchants who delivered door-to-door (especially large bags), often using tractors, small trucks, bakkies or, in some areas, horse-drawn carts. Coal is typically sold in large bags weighing between 50 kg and 70 kg, smaller bags (35 kg - 50 kg) or measured out in 20 L 'tins' (~17 kg). In Wesselton, Msugaligwa, we found coal being measured in drums of between 68 kg and 73.6 kg.
A small amount of paper, typically newspaper, and about a kilogram of wood is commonly used to ignite coal.
In urban areas, wood is often sold by the same merchants who sell coal or by entrepreneurs who obtain wood on farms or elsewhere and deliver bakkie-loads to households. Industrial waste wood, such as used shipping pallets are frequently sold by coal merchants (either chopped or whole). Although the Highveld is a grassland, there are areas with local wood sources that are harvested by households. Two examples that we have observed is at Tembisa, where Eucalyptus trees to the north of the township are exploited, and Bioketlong in Emfuleni, where a sudden expansion of informal houses led to cutting of green wood in the adjacent hills. It is here where we encountered households who mixed used motor oil with the green wood to make it burn better.
Wood ignites easier than coal and provides heat for cooking relatively fast. Wood can function as a substitute product for coal since wood can be burned in the same devices and provide the same utilities. Coal is the superior fuel for space heating and bulk water heating due to its higher energy value and the fact that a coal fire can burn much longer before it needs to be refuelled compared to wood. We observed a degree of substitution of wood for coal in Zamdela, Sharpeville, Bophelong and Boipatong. There was a steady increase in the price of coal in the Vaal Triangle between 2007 and 2014. This was accompanied by a decrease in the proportion of households who used coal and an increase in the proportion of households who use wood.
We observed an example of the substitution of wood for coal in Namahadi (near Frankfort, Free State). The fuel use pattern changed drastically when a large stock of eucalyptus wood became available, apparently as a result of nearby land-clearing. The wood was sold in Namahadi at competitive prices and large numbers of former coal users switched to using wood while it remained cheaply available.
Fuel burning devices
Three broad classes of fuel burning devices are commonly used to burn coal on the Highveld: cast iron stoves, locally made welded stoves and braziers (izimbaula). These devices are used for wood, but wood can also be used in an open fire on the ground (sometimes referred to in literature as a 'three stone fire') or in a open braai [barbecue] (which is occasionally used with coal as well).
Cast iron stoves are generally large stoves with four to six plates. The stoves currently still in use are generally old because the last large local manufacturer, Falkirk, closed their Newcastle plant at the end of the previous century.
Welded stoves come in a variety of forms and vary by region because they are made by local craftsman, sometimes from waste metal (off-cuts) obtained from local industries. These stoves are typically smaller than cast iron stoves and vary in sophistication of design.
Braziers are typically made from a 20-litre mild steel drum. The fact that paint is increasingly sold in plastic containers, means that such items are considerably harder to come by at zero cost than they were two decades ago. In the studies that Nova conducted between 2007 and 2017, the proportion of coal using households who used braziers was consistently lower than 10 %.
Wood use (without coal), specifically for thermal comfort in winter, are less common on the highveld. The proportion of wood users are highest where wood is cheaply or freely available, typically more in rural than urban or semi-urban settings. The same devices used for coal are also used indoors with wood, but wood may also be used in an open fire on the ground outside, in an outside kitchen or in a fireplace inside the house.
Makonese et al. (2017) determined emission factors of domestic coal-burning braziers under a variety of conditions in the laboratory. Nkosi at al. (2018) determined fine particulate matter emission factors from residential burning of solid fuels using traditional cast-iron coal stoves in field conditions. Both groups of authors found that emission factors vary. Makonese et al. found that the emissions varied according to fuel stacking and ignition technique (top-lit updraft [TLUD] or bottom-lit updraft [BLUD]), as well as ventilation (i.e. the density of holes in the brazier), The lowest PM2.5 emission factor obtained was 0.3 g/MJ for the TLUD fire in a highly ventilated brazier. The highest PM2.5 emission factor was 2.5 g/MJ for the BLUD fire in a brazier categorised as having low ventilation. Masondo et al. (2016) found that in addition to (stacking and) ignition methods and ventilation rates, the size of coal pieces influence emissions from brazier. They concluded that, in general, particulate and CO emission factors increase with an increase in the mean size of the coal pieces.
Nkosi found fine particulate emission factors ranging 6.8 g.kg-1 and 13.5 g.kg-1. The emission profiles varied depending on stove operation. Fire poking and refuelling lead to an increase in emissions. Like in other similar tests, emissions peaked shortly after ignition.
Utilities
Solid fuels are preferred for space heating rather than for cooking. This is visible by comparing the proportion of households who use coal and wood for space heating and cooking in all the Censuses (1996, 2001, 2011), General Household Surveys (between 2008 and 2020), and several surveys done by Nova.
Like space heating, solid fuels are also well suited for water heating. This is especially true of coal that has high energy content and burns for a long time. The fact that coal fires take long to start burning well and generate useful heat, makes coal less suited for cooking alone. In a coal stove, especially the cast iron variety, the thermal inertia of the device also contributes to the delay in the availability of useful heat to the pot. Wood fires ignite easier, providing flames under the plate much earlier than a coal fire, but wood burns out quicker.
For a simple task like boiling water for tea, electricity, LPG and paraffin are all cheaper and faster than both wood or coal (Graham and Dutkiewicz 1999). Cast iron coal stoves typically have four to six plates, meaning that it becomes efficient when cooking a large meal, or dishes that needs to cook for a long time (like samp [roughly cracked corn kernels]).
When energy is required for a combination of space heating for thermal comfort, water heating and cooking, at the same time, using a coal stove is very effective and efficient. This combined utility is the main reason for the strong seasonal use of coal, observed in most of the highveld household surveys.
Solid fuel use also has a social dimension, where families or friends often sit around the stove or the fire. Higher income groups also use solid fuels in this way. When Nova started work on energy in the 1990s, the stove and fire in general played an important part in bringing the family together in the evenings. We have in recent years observed a shift away from the gathering around coal stoves, as the hub of socialisation for the family in the evening has shifted towards the television in a number of highveld communities where Nova has been doing measurements.
Using solid fuels comes with certain trade-offs. Wood needs to be chopped and stacked, coal and wood take up space and need to be stored in a dry place, coal dirties the hands and solid fuels smoke, especially during ignition. In addition, wood and coal can leave a smell on one's clothes and ash needs to be cleaned out and disposed of. Some of these apparent disutilities are not necessarily experienced by end-users as such, for example, in surveys Nova recently conducted in more traditional wood using areas in Limpopo, households have mentioned that smoke is medicine to the eyes and a sign to the ancestors that the family is still alive. In other instances, our contention is that households accept disutilities with the utilities they require within the framework of what is economically, materially and symbolically possible for them.
Spatial distribution
The spatial distribution of solid fuel use on the Mpumalanga highveld is strongly determined by income distribution, climate and availability of fuels.
The role that income plays can be seen by comparing the prevalence of coal use in neighbouring areas differentiated by income. The results of the typical apartheid town planning (town -township) still persists throughout the region. The historically white towns have higher mean incomes and lower proportions of coal using households than that of township(s). It can also be seen inside the large urban townships in Gauteng such as Soweto, Tembisa, Tsakane where higher income areas have lower coal use. High-income households generally use clean modern energy carriers or sophisticated devices (such as highend solid fuel heaters). Households with limited income appear to optimise the balance between utility, cost and trade-offs (such as pollution). The poorest (no income) households tend to make use of free energy sources (collecting wood, burning waste) or are forced to forego the utility.
The spatial distribution of solid fuel use is not only determined by income, but also by the availability of energy carriers. On the Highveld there is also clear urban - rural pattern in the distribution of solid fuel use. Coal tends to be used in low-income towns and urban areas, while wood (and sometimes dung) is used for similar utilities on farms and in more rural settings.
Coal use is highly dependent on proximity to coal mines because of the rapid increase in transport cost with increased distance.
A comparison of coal and paraffin use in the towns of the Free State clearly demonstrates this. The townships adjacent to the towns closest to the coal mines in Mpumalanga (Villiers, Frankfort, Vrede) still had significant coal use for heating in the 2011 census while the same socio-economic profile in the towns immediately adjacent (e.g., Heilbron, Petrus Steyn and Warden) had more paraffin use but virtually no coal use. The line representing cost-utility parity between paraffin and coal for space heating lies somewhere between Frankfort and Petrus Steyn. The same phenomenon, that paraffin is used for the same utilities as coal by the same socio-economic group is also apparent from a comparison of the East- and West Rand.
On the eastern side of the Mpumalanga coal fields, there is a similar line where cost-efficiency of wood use for space heating supersedes that of coal use, presumably due to the increase availability of wood from the plantations in the area.
The third important determinant of solid fuel use is minimum temperature. Spatially and temporally, solid fuel use correlates with low temperatures ( Annegarn and Sithole 1999). Solid fuels are used more in application such as where bulk heat is needed. Coal is particularly suited to providing heat over a long time. The impact of minimum temperature may explain the difference in coal use between Mamelodi (Tshwane) and Tsakane (Ekurhuleni) where coal use is much more common. Mamelodi and Tsakane are both relatively close to the coal mine at Delmas, but Mamelodi is generally warmer than the higher-lying areas to its south where Tsakane is located. Very low winter temperatures explains why there is high coal use in the Maluti a Phofung Municipality despite its distance from the coal mines.
Temporal pattern
Predictably, solid fuel use has a marked seasonal pattern corresponding to its main uses for combined space heating, water heating and cooking with higher usage during winter, compared to summer. There are households who also cook with coal and wood in summer. Ownership of coal stoves and a certain behavioural inertia likely play a role here but often such households either do not have access to cheaper alternatives such as electricity or get their fuel cheap or at no cost (often wood).
Temporal profiles of stove use have been derived from data collected by Nova and North West University in eMbalenhle, Kwadela, Kwazamokuhle and Zamdela (Nkosi et al. 2017, 2018). The temporal stove use profile is typically bimodal or even trimodal with a morning peak at around 08:00, sometimes a slight increase in activity around 12:00 (representing cooking, especially on weekends) and an afternoon peek starting at around 16:00 and peaking at 18:00. The afternoon peak is generally higher since many households use electricity for warm water for bathing (typically from a kettle) and cooking in the morning when there is time pressure for household members who must go to school and work. In the afternoons, a coal stove (and to a lesser extent, a wood stove as well) provides enduring space heating, warm water for washing and heat of cooking. On cold nights it is not uncommon for households to refill the coal stove later in the evening (after 20:00).
Income and dirty fuel use
Coal and wood use differ in sensitivity to income. One needs some form of income to use coal or paraffin, but wood can sometimes be obtained for free.
Very high-income households can use clean energy sources for even energy intensive applications like space heating and water heating. As income declines, households switch to more cost-effective energy carriers which have more trade-offs for the most energy intensive applications (in the first place heating, but later also cooking). When income is extremely low, households have no choice but to either forego the utility (such as not to use any form of space heating) or to use very low-cost or zero-cost energy carriers which may have significant trade-offs.
There are very few cases where coal could be gathered for free. Coal is used by households with some discretionary income. Coal use for heating first increases slightly over the lower income deciles and then decreases thereafter. This means that an increase in income for the lowest income households living in the coal using areas will initially lead to an increase in coal use before it will lead to a decrease.
The proportion of households in South Africa that uses wood for space heating does not differ much by income decile in the first four income deciles but decreases as income rises above the fourth income decile (Friedl et al., 2008:20 with reference to Statistic South Africa 2006).
Electricity and dirty fuel use
Most dirty fuel using households in the HPA also use electricity. Households mix energy carriers based on considerations of availability, utility and cost. Solid fuels are cost-efficient sources of bulk heat. Coal stoves simultaneously function as cookstoves, heaters and geysers and can provide heat for hours on end. This utility is difficult to replace with separate electrical appliances in a cost-effective way, especially in low-income contexts where the bulk of houses often lacks proper thermal insulation to maintain thermal comfort. This utility is an important reason for the strong seasonal pattern in especially coal use seen in the HPA and elsewhere over the Highveld.
Dirty fuels are also used as a backup energy carrier where a preferred energy carrier fails, for example during power interruptions.
Association with structure type
Most solid fuel using households live in formal houses. However, analysis of the data from the national census and the GHS confirms the association between household dirty fuel use and structure type. Dirty fuel use is especially associated with freestanding informal houses and to a lesser extent with backyard shacks (informal structures on a formal stand) although dirty fuel use is by no means associated with informal houses only (see for example the most recent GHS, Statistics South Africa, 2020:141).
Paraffin use for lighting is a good indicator for absence of electricity since electricity is the most convenient, effective and cheapest energy carrier for lighting. Households who use paraffin for lighting can safely be assumed to be unelectrified. For obvious reasons this occurs more frequently in informal settlements.
The limited thermal protection offered by the structures themselves and the absence of alternatives mean that dirty fuel use will persist in unelectrified informal settlements in cold areas until either the structures themselves or the energy options available to residents changes.
Ending dirty fuel use on the Highveld
Historic attempts
An early example of a command-and-control approach to reducing air pollution from coal use in townships was the legislation to outlaw coal stoves not fitted with a secondary combustion chamber to ensure clean burning (Van Niekerk et al. 1999). At the time there were few stoves on the market (such as the Moderna) that were designed as smokeless stoves. The design of most stoves, such as those manufactured by Falkirk, were essentially not changed (see Ndebele Stoves 2022 for examples). These stoves were just fitted with a divider brick to divide the firebox in two and create a secondary combustion chamber where the smoke was burned off. These stoves complied with the law at the point when they left the factory, but due to the divider brick burning through fairly quickly or users actively removing the divider to enable them to load more coal, most stoves in use were not smokeless (Van Niekerk et al. 1999).
The Department of Minerals and Energy (DME) embarked on a Low smoke fuels programme after 1994 (Surridge et al. 2005). The objective of the program was to reduce pollution from township coal use by introducing low smoke fuels to replace coal. The programme generated significant research results, the most prominent being the Qalabotjha Low-Smoke Fuels Macro-Scale Experiment where three low-smoke fuels were tested during the winter of 1997 and it was found that the use of low-smoke fuels led to a significant improvement to the air quality (Engelbrecht et al. 1998). DME formulated an Integrated Household Clean Energy Strategy in which top-down ignition, low-smoke fuels, housing insulation and cleaner fuels and stoves had a place (Surridge et al. 2005).
The improved top-down ignition method was first developed in eMbalenhle by the Nova Institute and members of the community in a project sponsored by Sasol. The first successful implementations was undertaken by Sasol in eMbalenhle, Mpumalanga, in 2001 and 2003 and later in Zamdela, Free State, in 2003 (Wagner et al. 2005). Two large, government (DME) sponsored implementations took place in Gauteng: in Orange Farm in 2003 (Le Roux et al. 2009) and in Tembisa in 2005 (Palmer Development Consulting (Pty) Ltd 2005). All these projects employed a similar methodology of using demonstrations of the technique as the main form of dissemination although the government-sponsored projects tended to favour larger scale demonstrations. The Nova Institute used carbon finance to launch its Highveld Air Quality programme in 2007. In 2008, the (then) DEAT launched the Clean Fires Campaign (VTAPA AQM, 2008), which relied on mass media as a means of dissemination of awareness of the technique, presumably based on the assumption that this will lead to adoption of the technique. The mass media approach was not successful, and the campaign was abandoned after 2011.
One relatively recent development that mobilised new resources toward reducing air pollution from dirty fuel use is air quality offsets(Department of Environmental Affairs 2016; Langerman et al. 2018).
As far as we could determine, only one large air quality offsets programme have been successfully completed for the period 2015 to 2020, namely that of Sasol (with separate projects in Secunda and Sasolburg). Sasol successfully implemented a thermal insulation and stove swop intervention in eMbalenhle and Lebohang as well as a waste removal intervention in Zamdela. These were supplemented by smaller interventions aimed at air quality awareness and reducing veld fires (Sasol Limited 2020).
Eskom successfully completed baseline and preparation phases (Langerman et al. 2018), but failed to timeously implement its air quality offsets programme by 1 April 2020.
A further development is the Strategy to address air pollution in dense low-income settlements published in May 2019 by the then minister of Environmental Affairs, Nomvula Mokonyane (Government Gazette No. 42464). The goal of the strategy is to "map out the path that the country needs to take in reducing the impact of air pollution in dense low-income settlements" (Republic of South Africa 2019:1). The strategy sets three objectives: (1) ensuring that efforts to address air pollution in dense low-income settlements are undertaken in a coordinated and coherent manner, (2) facilitating through the National Coordinating Committee on Residential Air Pollution, the implementation of interventions aimed at reducing emissions from dense low-income settlements, and (3) ensuring continued monitoring, evaluation and reporting on the successes and failures of the proposed interventions and on air quality improvements. The strategy concludes with the statement: "It is important to note that the objectives of this strategy can only be achieved if there is an uncompromised coordination between the relevant national departments (DEA, DHS, DoE and DoH) together with the relevant provincial departments and municipalities" (Republic of South Africa 2019:40).
Determinants
The DANIDA-sponsored report on Air Pollution in dense, low-income settlements in South Africa (Friedl et al., 2008:265) identified factors that will determine the future trends in dirty fuel use namely fuel prices (since transport is an important determinant of coal prices), the rate of formal housing delivery compared to household formation, the electricity supply prospects and the economic growth rate in real terms.
Since the writing of that report in 2008, the price of petrol have increased from R7.18 (Unleaded 93, inland price) to R18.15 per litre in 2021 (https://aa.co.za/fuel-pricing), i.e. at approximately 6.38 % p.a..
In 2019, the General Household Survey showed that 12.7 %, or 2.1 million out of 17.2 million households, in South Africa lived in informal structures only (Statistics South Africa 2020). The proportions were higher than the national average in the cities of Johannesburg (19.1 %) and Ekurhuleni (18.4 %). While construction of subsidised houses by government is ongoing (the percentage of households that received any kind of government housing subsidy increased from 9.4% in 2009 to 18.7 % in 2019), there are no signs that informal settlements and backyard shacks as a feature of the South African landscape is disappearing. A stark reminder of this fact is found in the 2019 General Household Survey report where it is noted that compared to 2002 ".. .the percentage of households with access to mains electricity actually declined in Gauteng" by 10.6 % (Statistics South Africa, 2020:34).
Electricity prices have increased from 24.97 c/kWh in 2008 to 133.64 c/kWh as of 2021. The electricity supply remains under pressure with extensive load shedding still occurring during the first half of 2021 (Wright, 2021).
Economic growth remain low. Data from the World Bank (World Bank 2021) show that GDP per capita expressed in constant local currency units was the same in 2008 and in 2018. It declined in 2019, to the lowest levels in nine years lower (i.e., lowest level since the global financial crisis) and plummeted in 2020 after the outbreak of the SARS-CoV-2 pandemic.
A strategy to address dirty fuel use on the Highveld will have to take into account these economic realities, and cannot be built on the fantasy that the situation is not what it is.
Furthermore, new challenges have emerged that impact on the economic growth rate and as such, could also directly or indirectly impact the number of solid fuel users and quantities of solid fuel use on the Highveld in the years to come. Three macro phenomena worth mentioning are the COVID-19 pandemic, climate change and the drive to green the economy in a manner that also takes cognisance of the socio-economic realities of South Africa, also known as the just transition movement. It also remains to be seen how the Highveld will be impacted by the fourth and fifth industrial revolutions.
Economic development
The National Development Plan (NDP) identifies poverty and inequality, together with unemployment, as the triple challenge that is to be overcome by 2030 (World Bank, :xii). The NDP set the target to eradicate poverty (lower bound poverty line) by 2030. However, although the depth and severity of poverty has decreased overall between 2006 and 2015, it has worsened again from 2015 to 2020 (NDA, :8).
It is not yet clear what the long term impact of COVID-19 and the resulting lockdowns will be, but it can be expected that it will set back economic development markedly (International Food Policy Research Institute 2020).
It is evident that growth in per capita income of lower earning income households will be a crucial determinant for the future of dirty fuel use. For the poorest households, who out of desperation forego energy use (e.g. who live in cold areas but use no energy carrier for heating) or who use a combination of purchased and collected biomass and waste, an increase in income will mean an increase in dirty fuel use (especially coal and paraffin). For households with a somewhat higher income, increased income will give them the ability to move away from daily use of dirty fuels towards electricity or possibly LPG.
On the other hand, households that have to cope with reduced income could be obliged to revert back to dirty fuels as the cheapest viable option for space heating, especially.
Several communities in the Highveld will furthermore be impacted by South Africa's transition to a greener economy that includes the closure of several power stations in the next decade.
It has been clear for a number of years that the relative importance of coal mining is waning.
Ideological and policy developments
Ideology underlies policy and policies, to some extent, determines the actions of collective entities such as states and corporations. Ideological trends are therefore key determinants, not of what households do, but of how governments and corporations act with regards to households. Two interrelated ideological trends that are likely to influence action towards dirty fuel using households are the ideas of a just energy transition and the end of coal.
Velicu and Barca observe that labour and environmental justice organisations have different takes of the definition of justice: "The climate-justice movement has emphasized the values of self-determination through grassroots control over the use of resources, food sovereignty, energy democracy, reduction of overconsumption, recognition of climate debt, and respect for indigenous and peasant rights.Labour organisations, instead, have maintained a commitment to the green growth agenda as an unquestioned path toward a post-carbon society" (Velicu and Barca 2020:263).
The Groundworks report The Destruction of the Highveld, Part 2: Burning Coal, is an example of the former approach. In chapter 4, Hallows and Munnik (2017) propose a number of starting points for a more equal and ecologically sustainable economy. Their list includes: a new energy system based on socially owned renewables; new jobs in renewables; large scale restoration and detoxification of ecosystems injured by the fossil fuel economy on the Highveld; a new and healthier food economy; healthier and climate-wise housing; a new and healthier transport economy; a reorientation and expansion of municipal services; a basic income grant for all.
The shift from coal to renewable energy for electricity generation is a priority for the South African government. This is embedded in a broader movement away from fossil. The move away from coal is a starting point in South Africa (Halsey et al. 2019:1).
The transformative just energy transition sees the energy transition as a core part of the wider transformation of society (Halsey et al. 2019:6).
In July 2021, the Presidential Climate Commission hosted a high-level discussion on South Africa's Just Energy Transition, with a focus on socio-economic impacts, technology choices, and options for financing the transition (https://www.climatecommission.org.za/programs).
Ending solid fuel use on the Highveld
Considering the historic trends and considerations explicated in the preceding sections, the question arises as to what actions can be taken to end dirty fuel use in the Highveld.
It may be easier to start by expressing what is not likely to succeed: waiting for the poorest sectors of society to become richer, or for universal electricity provision at affordable prices, or for the disappearance of informal settlements will not work in the medium term. Economic development, universal electricity access and universal attainment of formal housing are doubtlessly important national priorities, but, judging by current trends, is a task that will take decades to complete.
Interventions to make coal illegal or hard to come by are bound to fail because households have fallen back to biomass where coal availability decreased, or where prices increased. If coal is unavailable, it will be replaced by wood and waste if need be.
What is needed is a series of solutions that are uncorrelated to national macro-economic trends, service delivery and infrastructure provision and do not rely on coercion or measures that limit the options of households.
We are of the opinion that dirty fuel use on the Highveld will end when households can be provided with clean alternatives that provide equivalent or better utility compared to what they currently derive from dirty fuel use at an equivalent or lower price relative to their income. The fact that solid fuels are used for energy-intensive applications such as space heating and water heating makes this a difficult task. This is because measures will likely be expensive. If improved stoves are to be introduced, these cannot be relatively cheap one-plate rocket stoves because the utility that must be replaced is multi-pots cooking as well as space heating and water heating, preferably all at the same time. An improved stove solution will necessarily imply a large, durable and therefore expensive stove.
An electricity subsidy did not prove to be an effective means to induce households to decrease their coal consumption (Eskom pilot mod 3 p21). This may be due to the income effect: a subsidy is a form of income and an increase in income leads to an increase in consumption of all normal goods. A subsidy does not change the economics of domestic energy use: electricity remains more expensive than coal for space heating. Households who receive an electricity subsidy will therefore only replace another energy carrier with electricity when the subsidy covers their current total electricity consumption, which in this case was approximately R400 (Langerman et al., 2015:3), as well as the additional expenditure of the energy carrier to be replaced.
Solutions based on provision of alternative fuels have not had historic success at scale and face the almost insurmountable challenge of a having to provide a perpetual fuel subsidy.
Thermal insulation is effective in reducing the need for space heating but is relatively expensive to retrofit (compared to the initial cost of the structure) and is currently only applicable to formal houses. The improved building standards implemented in recent Breaking New Ground (BNG) houses that also forms part of the Strategy to combat air pollution in dense, low-income settlements means that the problem of very poor thermal performance of houses will not be perpetuated in future (Republic of South Africa, Department of Environmental Affairs 2019).
Another limitation that is likely to become more important in future is the increasing resistance to the promotion of fossil fuel use, particularly to coal use. The increasing action to combat climate change and the movement to end coal use however presents an opportunity that can be exploited since this generates new financing avenues. The carbon tax regulations allow for only 10 % of the carbon tax liability to be offset with certified/verified emission reductions generated under the Clean Development Mechanism (CDM) of the Kyoto Protocol, Verra or Gold Standard. The carbon tax liability is currently relatively low at R127/t CO2 emissions and will increase at 2 % above inflation until 2022 whereafter it will increase with inflation (South Africa Revenue Service 2021).
There are historic successes with using climate finance to address air quality on the Highveld. Nova generated 200 000 Gold Standard VERs between 2010 and 2016 with our programme to promote the alternative top-down ignition technique. The expansion of the programme was discontinued because the price of Gold Standard VERs did not justify further implementation. Top-down ignition is by far the cheapest intervention to reduce emissions from domestic coal use (Airshed Planning Professionals and Bentley West Management Consultants 2004). This remains true when the waning impact over time, due to reversion to polluting bottom-up ignition, is taken into consideration. Improved top-down ignition could scarcely be financed through climate finance. More costly interventions, like improved stoves and thermal insulation, cannot be funded through climate finance at current VER prices.
Air quality offsets have proven to be an effective policy tool in mobilising significant resources to combat air pollution from solid fuel use. Sasol Secunda has successfully implemented a durable intervention (LPG stove swop and thermal insulation) at the level of a large township (eMbalenhle), practically to saturation (i.e. all reachable households who are technically eligible have been given a chance to participate).
By 1 April 2020, nothing has come of Eskom's implementation of air quality offsets apart from a pilot project. This failure represents an important missed opportunity as well as a dangerous precedent.
In conclusion thus far: The permanent end of dirty fuel use is inherently linked to macroeconomic and societal dynamics that evolve on long timescales and where the prospects of large improvements in the short term appears slim. There are successful interventions to address coal use in the short term (top-down ignition) and long term (LPG stove swop and thermal insulation). There are also successful funding channels namely greenhouse gas offsets and air quality offsets. Air quality offsets have the potential to mobilise orders of magnitude more resources per project.
There is currently no implementation-ready intervention for households in informal houses who use solid fuels for space heating and water heating. We have shown that this is the category where solid fuel use is particularly persistent. The increase in paraffin use for lighting in Ekurhuleni between 1996 and 2011, shows that there are important areas where the number of households in informal, unserviced houses are growing, both in absolute terms and proportionally. Since informal structures are often not legal, nor meant to be permanent and vary greatly in size, design and material, passive measures focussing of the structure itself are likely to remain difficult. This implies that an active source of bulk thermal energy is the only viable avenue that can be pursued in the short term while the long-term political and economic solutions (hopefully) materialise.
Air quality offsets remain a viable funding mechanism but will depend on proximity to industries applying for new plant licences or for postponements for compliance to MES.
If climate finance is going to play a part, the (yet to be developed) active energy solution for informal houses must use renewable biomass as a fuel. Even if that is the case, the highest conceivable estimate for income for carbon credits is still less than R1000 per household p.a. (assuming heavy use of coal: a 50 kg bag of coal/week all year; 2.35t CO2 per tonne coal; $10 per tCO2). Households who use a bag of coal per week throughout the year are very rare. This means that for all practical purposes, climate finance will not enable a systematic eradication of dirty solid fuel use in informal households if the technology costs more than approximately R1500 (assuming R500 transaction cost and a three-year payback period).
What can be pursued in the short term are more modest but achievable goals. Where unserviced households use solid fuels for cooking, effective and affordable biomass or LPG cookstoves can be introduced and possibly financed with climate finance. Replacing the cooking utility with a clean-burning device will at least reduce emissions during specific seasons and times of the day when space heating is not required. Increasing the offsetable portion of the carbon tax to 100 % will greatly enhance the demand for carbon credits from South Africa but the number of projects will be limited by the low absolute value of the carbon tax liability.
Horizons
We can identify three directions from which potential new solutions may emerge: institutional innovation, new biomass and smart subsidies.
The end of informal settlements may be brought about by institutional innovation to enable large-scale urban land reform. Huchzermeyer et al. (2019) concluded that much of policies needed for urban land reform already exists but needs to be extended and put into practice. How that difficult task is to be undertaken in beyond the scope of this article, except to note that the strong association between dirty fuel use and informal housing means that a solution to formalise informal settlements will also to a large degree lead to a reduction in domestic solid fuel use.
Micro-scale biomass gasification for household cooking is a relatively new development with the first commercial units released in 2003 (Roth, 2011). The technology offers vast improvements over open fires and even over improved biomass cookstoves but maintaining control over the gasification process becomes more difficult as the device gets smaller. A technological refinement that produces a robust but affordable micro-gasification cookstove and water heater or even space heater may go a long way to replace the utility provided by coal and wood. If the fuel is from a renewable source and the char can be collected and sequestered, carbon finance (both from emission avoidance as well as carbon sequestration) may be available.
The other technological horizon that may yield new avenues for interventions are smart subsidies. Unlike a general electricity subsidy, that fails in theory and failed in practice, during Eskom's evaluation in Kwazamokuhle (Langerman et al. 2015), a smart subsidy targets the specific device, like a heater. There are examples of peer-to-peer electricity trading networks that leverage blockchain technology (like Solar Bankers, https://solar-bankers.medium.com). It is conceivable that a similar technology can be used to subsidise the electricity consumption of a specific device (such as a space heater or a water heater) meant to replace the utility of a solid fuel burning device that is cheaper to operate (but not for anything else).
There are persistent and, in some cases, growing pockets of households that use dirty fuels on the Highveld but there are also interventions and financing mechanisms that are effective to some extent. There are also technologies that may develop in future that may accelerate the movement away from solid fuel use. However, the enduring end of dirty solid fuel use will come from large societal transformations related to income, acceleration of formalisation through land rights and provision of services.
Acknowledgements
The authors thank the two anonymous reviewers who made valuable suggestions towards the improvement of this manuscript.
References
Adesina JA, Piketh SJ, Qhekwana M, Burger R, Language B, & Mkhatshwa G (2020) 'Contrasting indoor and ambient particulate matter concentrations and thermal comfort in coal and non-coal burning households at South Africa Highveld', Science of The Total Environment, 699:134403, doi:10.1016/j.scitotenv.2019.134403. [ Links ]
Airshed Planning Professionals & Bentley West Management Consultants (2004) Study to examine the potential socioeconomic impact of measures to reduce air pollution from combustion. Final report, Trade and Industry Chamber / Fund for Research into Industrial Development, Growth and Equity (FRIDGE), Johannesburg. [ Links ]
Annegarn HJ & Sithole JS (1999) Soweto air monitoring - project SAM: trend analysis of particulate pollution for the period 19921999, Annegarn Environmental Research, Johannesburg. [ Links ]
Chidhindi P, Belelie MD, Burger RP, Mkhatshwa G, & Piketh SJ (2019) 'Assessing the impact of Eskom power plant emissions on ambient air quality over KwaZamokuhle', Clean Air Journal, 29(1), doi:10.17159/2410-972X/2019/v29n1a2. [ Links ]
Department of Environmental Affairs (2016) 'Air quality offsets guideline'. [ Links ]
Engelbrecht JP, Swanepoel L, Zunckel M, & Chow JC (1998) 'Modeling PM10 gravimetric data from the Qalabotjha low-smoke fuels macroscale experiment in South Africa' Air & Waste Management Association. Bridging international boundaries - clean production for environmental stewardship: proceedings of the 91st Annual Meeting & Exhibition: San Diego, CA. June 14-18, 1998 [Conference proceedings on CD-ROM] Air & Waste Management Association, Pittsburgh, PA. [ Links ]
EScience Associates (Pty) Ltd & Nova Institute (2013) Household Emission Offset Pre-Feasibility Study for Eskom, Eskom Holdings, Sunninghill, Sandton. [ Links ]
Feig G, Garland RM, Naidoo S, Maluleke A, & Van der Merwe M (2019) 'Assessment of changes in concentrations of selected criteria pollutants in the Vaal and Highveld Priority Areas', Clean Air Journal, 29(2), doi:10.17159/caj/2019/29/2.7464. [ Links ]
Fischer T & Pauw CJ (2010) 'Household emissions offsetting process: toward the development of a verifiable and defensible process for the determination implementation and licensing of emission offsets' NACA Conference 2010. [ Links ]
Friedl A, Holm D, John J, Kornelius G, Pauw CJ, Oosthuizen R, & Niekerk AS van (2008) Air Pollution in dense, low-income settlements in South Africa, NOVA Institute for the DEAT on behalf of Royal Danish Embassy. [ Links ]
Graham JAN & Dutkiewicz RK (1999) 'Assessing the emissions and cost effectiveness of traditional and transitional household fuel burning appliances in South Africa', Tydskrif virSkoon Lug/ The Clean Air Journal, 10(3):13-21. [ Links ]
Hallowes D & Munnik V (2017) The Destruction of the Highveld - Part 2: Burning Coal, groundWork, Pietermaritzburg, https://groundwork.org.za/reports/gW_Report_2017.pdf. [ Links ]
Halsey R, Overy N, Schubert T, Appies E, McDaid L, & Kruyshaar K (2019) 'Remaking Our Energy Future: Towards a Just Energy Transition (JET) in South Africa', Project 90 by 203066. [ Links ]
Hersey SP, Garland RM, Crosbie E, Shingler T, Sorooshian A, Piketh S, & Burger R (2015) 'An overview of regional and local characteristics of aerosols in South Africa using satellite, ground, and modeling data', Atmospheric Chemistry and Physics, 15(8):4259-4278, doi:10.5194/acp-15-4259-2015. [ Links ]
International Food Policy Research Institute (2020) Impact of Covid-19 on the South African economy: An initial analysis, https://www.ifpri.org/publication/impact-covid-19-south-african-economy-initial-analysis, accessed 20 August 2021. [ Links ]
Khumalo T N (2018) 'Postponement of compliance with minimum emission standards of NEM: AQA (Act No. 39 0f 2004)', https://slideplayer.com/slide/14367756/. [ Links ]
Langenbacher E (2019) 'Introduction: The Thirtieth Anniversary of The Fall of the Berlin Wall and Unification', German Politics and Society, 37(3):1-3, doi:10.3167/gps.2019.370301. [ Links ]
Langerman K (2018) 'Household Energy Use Models and their Application to South African Energy Interventions', South African Geographers, 1:306. [ Links ]
Langerman K, Wernecke B, Mkhatshwa G, Herbst D, Piketh S, Burger R, Pauw C, Snyman H, Murray H, Fisher T, & Weston M (2015) 'Domestic Fuel Burning Mission Reduction: Eskom's Kwazamokuhle Pilot Study' NACA, https://www.eskom.co.za/AirQuality/Documents/LangermanNACApaper2015.pdf. [ Links ]
Langerman KE, Pauw CJ, Smith HJ, & Piketh SJ (2018) 'Moving households to cleaner energy through air quality offsets' 2018 International Conference on the Domestic Use of Energy (DUE) 2018 International Conference on the Domestic Use of Energy (DUE), doi:10.23919/DUE.2018.8384405. [ Links ]
Language B, Piketh SJ, Wernecke B, & Burger R (2016) 'Household air pollution in South African low-income settlements: a case study' Air Pollution 2016 Crete, Greece, doi:10.2495/AIR160211. [ Links ]
Le Roux LJ, Zunckel M, & McCormick S (2009) 'Reduction in air pollution using the "basa njengo magogo" method and the applicability to low-smoke fuels', Journal of Energy in Southern Africa, 20:3-10. [ Links ]
Makonese T, Masekameni DM, Annegarn HJ, & Forbes PBC (2017) 'Emission factors of domestic coal-burning braziers', South African Journal of Science, Volume 113 (Number 3/4), doi:10.17159/sajs.2017/20160187. [ Links ]
Mandela N (2013) Long walk to freedom: the autobiography, Little, Brown and Company, New York, NY, https://zelalemkibret.files.wordpress.com/2012/01/the-autobiography-of-nelson-mandela.pdf. [ Links ]
Masondo L, Masekameni D, Makonese T, Annegarn H, & Mohlapi K (2016) 'Influence of coal-particle size on emissions using the top-lit updraft ignition method', Clean Air Journal, 26(1), doi:10.17159/2410-972X/2016/v26n1a8. [ Links ]
Moletsane S, Lindeque F, Language B, Nkosi C, Adesina J, Burger R, Mkhatshwa G, & Piketh S (2021) 'Intra-urban variability of PM 2.5 in a dense, low-income settlement on the South African Highveld', Clean Air Journal, Volume 31, doi:10.17159/caj/2020/31/1.9413. [ Links ]
Muyemeki L, Burger R, Piketh SJ, Language B, Beukes JP, & van Zyl PG (2021) 'Source apportionment of ambient PM10-2.5 and PM2.5 for the Vaal Triangle, South Africa', South African Journal of Science, 117(5/6), doi:10.17159/sajs.2021/8617. [ Links ]
Ndebele Stoves (2022) 'Union Stoves', https://www.ndebelestoves.co.za/product-category/refurbished-stoves/union-stoves/, accessed 6 May 2022. [ Links ]
Nkosi CN, Piketh JS, Burger PR, & Harrold AJ (2017) 'Variability of domestic burning habits in the South African Highveld: A case study in the KwaDela Township (April 2017)'2017 International Conference on the Domestic Use of Energy (DUE) 2017 International Conference on the Domestic Use of Energy (DUE), doi:10.23919/DUE.2017.7931820. [ Links ]
Nkosi NC, Piketh SJ, & Burger RP (2018) 'Fine PM emission factors from residential burning of solid fuels using traditional cast-iron coal stoves', Clean Air Journal, doi:10.17159/2410-972X/2018/v28n1a10. [ Links ]
Palmer Development Consulting (Pty) Ltd (2005) Implementation of Basa Njengo Magogo technology. Tembisa. Final report. Submitted to: Department of Minerals and Energy. By Menyetla Projects (Pty) Ltd and Palmer Development Consulting (Pty) Ltd, www.dme.gov.za/pdfs/energy/coal/. [ Links ]
Pauw C, Fischer T, Weston M, Preston-Whyte F, & Badenhorst H (2013) 'The elephant in the room: What do we know about urban wood use in South Africa' 16th IUAPPA World Clean Air Congress, Cape Town. [ Links ]
Republic of South Africa (2015) 'South Africa's Intended Nationally Determined Contribution (INDC)', https://www4.unfccc.int/sites/ndcstaging/PublishedDocuments/South%20Africa%20First/South%20Africa.pdf. [ Links ]
Republic of South Africa (2021) 'South Africa's First Nationally Determined Contribution under the Paris Agreement', https://www.environment.gov.za/sites/default/files/reports/draftnationalydeterminedcontributions_2021updated.pdf. [ Links ]
Republic of South Africa, Department of Cooperative Governance (2020a) 'Nkangala District Mpumalanga - profile and analysis district develepment model', https://www.cogta.gov.za/ddm/wp-content/uploads/2020/07/Nkangala-District-Profile.pdf. [ Links ]
Republic of South Africa, Department of Cooperative Governance (2020b) 'Gert Sibande District Mpumalanga - profile and analysis district develepment model', https://www.cogta.gov.za/ddm/wp-content/uploads/2020/07/Final-Edited-Gert-Sibande-DM_26-June-2020-FINAL.pdf. [ Links ]
Republic of South Africa, Department of Cooperative Governance (2020c) 'City of Ekurhuleni metropolitan GAU - profile and analysis district development model', https://www.cogta.gov.za/ddm/wp-content/uploads/2020/08/Take2_DistrictProfile_EKURHULENI-2.pdf. [ Links ]
Republic of South Africa, Department of Environmental Affairs (2014) 'Air Quality Offsets Policy (Draft)'. [ Links ]
Republic of South Africa, Department of Environmental Affairs (2019) 'Strategy to address air pollution in dense low-income settlements', Government Gazette, 666(42464), https://saaqis.environment.gov.za/pagesfiles/Strategy_to_address_air_pollution_in_dense_low-income_settlements.pdf. [ Links ]
Sasol Limited (2020) Sasol in Society Report, https://www.sasol.com/sites/default/files/content/files/Sasol%20Report%20to%20Society%2019%20Nov%20Sopnhia.pdf. [ Links ]
South Africa Revenue Service (2021) Carbon Tax, https://www.sars.gov.za/customs-and-excise/excise/environmental-levy-products/carbon-tax/. [ Links ]
Statistics South Africa (2020) General Household Survey 2019, Pretoria,http://www.statssa.gov.za/publications/P0318/P03182019.pdf, accessed 26 September 2021. [ Links ]
Statistics South Africa (2021) National Poverty Lines, Pretoria, http://www.statssa.gov.za/publications/P03101/P031012021.pdf. [ Links ]
Surridge AD, Kgobane KB, & Chauke GR (2005) 'Strategy to combat the negative impacts of domestic coal combustion: basa njengo magogo', Clean Air Journal = Tydskrif vir Skoon Lug, 14(1):13-16, doi:10.10520/EJC27323. [ Links ]
Tyson PD, Kruger FJ, & Louw CW (1988a) Atmospheric pollution and its implications in the Eastern Transvaal highveld, Foundation for Research Development, CSIR, Pretoria, http://hdl.handle.net/10204/2376. [ Links ]
Tyson PD, Kruger FJ, & Louw CW (1988b) 'Atmospheric pollution and its implications in the Eastern Transvaal Highveld', Clean Air Journal, 7(6):15-17, doi:10.17159/caj/1988/7/6.7209. [ Links ]
United Nations (1992) United Nations Conference on Environment and Development, Rio de Janeiro, Brazil, 3-14 June 1992, United Nations, https://www.un.org/en/conferences/environment/rio1992, accessed 19 August 2021. [ Links ]
Van Niekerk A, Swanepoel P, & Kornelius G (1999) 'New possibilities to improve air quality in low income housing and reduce greenhouse gasses', Clean Air Journal, 10(4). [ Links ]
Velicu I & Barca S (2020) 'The Just Transition and its work of inequality', Sustainability: Science, Practice and Policy, 16(1):263-273, doi:10.1080/15487733.2020.1814585. [ Links ]
Wagner NJ, Schoonraad P, Swanepoel P, Niekerk AV, Scholtz C, Kornelius G, Julies A, Pretorius O, Wasserman J, & Muller A (2005) 'Results of domestic smoke reduction programmes at eMbalenhle (Mpumalanga) and Zamdela (Free State)' NACA Conference (Cape Town, 27-30 September 2005) [Conference proceedings on CD-ROM] NACA, Johannesburg, http://www.airshed.co.za/documents/Recent/. [ Links ]
Walton NM (2021) Aerosol source apportionment in southern Africa, North West University, Potchefstroom. [ Links ]
World Bank (2021) GDP per capita (constant LCU) - South Africa, World development indicators, https://data.worldbank.org/indicator/NY.GDP.PCAP.KN, accessed 13 January 2022. [ Links ]
Wright CY, Oosthuizen R, John J, Garland RM, Albers P, & Pauw C (2011) 'Air quality and human health among a low income community in the Highveld priority area', Clean Air Journal= Tydskrif vir Skoon Lug, 20(1):12-20. [ Links ]
 Correspondence:
Christiaan J. Pauw
christiaan.pauw@nova.org.za
Received: 6 October 2021
Reviewed: 16 November 2021
Accepted: 20 April 2022
1 The response options differed slightly between the three censuses, but not in a manner that affected the use of the data for the present study.

