


Services on Demand
Article
 English (pdf)
 Article in xml format
 Article references
Indicators

Related links
-
 Cited by Google
 -
 Similars in Google
Share

 Permalink
Clean Air Journal
On-line version ISSN 2410-972X
Print version ISSN 1017-1703
Clean Air J. vol.32 n.1 Pretoria 2022
http://dx.doi.org/10.17159/caj/2022/32/1.12505
RESEARCH ARTICLE
A case study in the wintertime Vaal Triangle Air-Shed Priority Area on the utility of the nitrogen stable isotopic composition of aerosol nitrate to identify NOx sources
Katye E. AltieriI; Jessica BurgerI; Brigitte LanguageII; Stuart J. PikethII
IDepartment of Oceanography, University of Cape Town, Rondebosch 7700, South Africa
IIUnit for Environmental Sciences and Management, North-West University, Potchefstroom 2520, South Africa
ABSTRACT
In South Africa, the Highveld region and the Johannesburg-Pretoria megacity are known as global NOx (NOx = NO + NO2) "hotspots" identified by satellite-based instruments. The ultimate sink for atmospheric NOx is conversion to aerosol nitrate. However, measurements of aerosol nitrate concentrations do not provide information on which NOx sources served as nitrate precursors at that location. This complicates efforts to reduce concentrations of particulate matter (PM) in these air quality priority areas. Here, we measured the nitrogen stable isotope composition of nitrate from daily wintertime collections of coarse mode PM2.5-10 (PM < 10 and >2.5 μm in diameter) at three air quality monitoring stations located in the Vaal Triangle Air-Shed Priority Area (VTAPA). The overall aim of this case study was to evaluate the use of the distinct stable isotope signatures of various NOx sources to identify their relative contribution to aerosol nitrate across the Highveld. The nitrogen isotope ratios of aerosol nitrate were similar across the three sites, with greater day-to-day variability than site to site variability. Air mass history was the main driver of the variability in the nitrogen isotope ratios of aerosol nitrate, with significantly higher isotopic ratios observed for air masses originating from the southwest. Using an isotope mixing model we determined that NOx from coal-burning is the dominant contributor to aerosol nitrate (66%), followed by biomass burning (16%), vehicles (12%), and soil emissions (6%).
Keywords: Aerosol Nitrate, Stable Isotopes, NOx Sources, Highveld, Vaal Triangle
Introduction
High concentrations of ambient aerosols are associated with increased mortality risks. There is a wide range of evidence documenting the large health costs associated with high levels of air pollution (Pervin et al. 2008; Zhao et al. 2016; Altieri and Keen 2019). In many regions of South Africa, particulate matter (PM) is considered the pollutant of greatest concern (City of Cape Town 2008; Thabethe et al. 2014). Anthropogenic aerosol sources include fugitive dust, fires, mining, transportation, electricity generation, industrial activities, domestic fuel burning, and traffic. The latter two sources are typically considered the largest contributors to the South African PM burden (Feig et al. 2016; Venter et al. 2012). Natural sources are dominated by dust and sea spray. PM can be emitted to the atmosphere or formed through gas-to-particle conversion and is composed of a complex mixture of inorganic species, organic carbon, and black carbon with small amounts of trace metals (Seinfeld and Pandis 2012).
Globally, the emission of anthropogenic nitrogen oxides (NOx = NO + NO2) to the atmosphere has increased tenfold since preindustrial times (Galloway et al. 2004). NOx itself is a local air pollutant, and it impacts regional air pollution by serving as a precursor to ozone and secondary PM formation. In South Africa, the Highveld region and the Johannesburg-Pretoria megacity are known as global NOx "hotspots" identified by satellite-based instruments (Lourens et al. 2012). This region, along with the neighbouring Vaal Triangle, is responsible for > 90% of South Africa's anthropogenic NOx emissions (Lourens et al. 2012). Similarly, there are large emissions of sulfur dioxide (SO2) from industrial activities, coal mines, and power generation, particularly in winter (Feig et al. 2016; Lourens et al. 2011; Venter et al. 2012). NOx and SO2 emissions are the main precursors to secondary inorganic PM formation and highlight the coupling between gaseous emissions and the formation of secondary aerosols.
Air transported to the central plateau of South Africa originates primarily from the Atlantic and Indian Oceans, with a 25% contribution from the African continent (Freiman and Piketh, 2003). As oceanic NOx sources are very low, the only external NOx source to the Highveld/Vaal area would be seasonal biomass burning from neighbouring African countries. The fate of NOx produced in the Highveld and Vaal regions includes dry and wet deposition and conversion to aerosol nitrate. The local recirculation time scale is 2 to 9 days (Freiman and Piketh 2003; Collett et al. 2010; Igbafe et al. 2015), allowing for complete NOx conversion to nitrate, such that aerosol nitrate concentrations in the Highveld/Vaal area are primarily influenced by local NOx emissions. Similarly, local industrial emissions of SO2 make a considerable contribution to sulfate aerosols, the main component of the summer and winter haze layer in this region (Piketh et al. 1999).
NOx negatively impacts human health and, as NO2, is controlled by both minimum emission standards (MES) and national ambient air quality standards (NAAQS) in South Africa (Government Gazette, 24 December 2009, No. 32816). NOx and volatile organic compounds lead to ozone formation, which is controlled by NAAQS due to its adverse impacts on human health and visibility. The ultimate sink for atmospheric NOx is the conversion to aerosol nitrate. Nitrate can be present in PM aerosols as ammonium nitrate, sodium nitrate, magnesium nitrate, and calcium nitrate. Due to the adverse impacts on human health and visibility, PM is also controlled by NAAQS. The Highveld Priority Area (HPA) and the Vaal Triangle Air-Shed Priority Area (VTAPA) occasionally record NO2 values above the NAAQS. However, PM and ozone are regularly out of compliance at stations across the HPA and VTAPA (saaqis.environment.gov.za). Although NOx emissions rarely exceed the MES, emissions reductions would positively influence air quality in these regions by reducing ozone and PM. However, measuring the nitrate concentration in PM does not provide information on which specific NOx sources lead to aerosol nitrate formation at that location. This complicates efforts to reduce concentrations of PM in these air quality priority areas.
The atmospheric cycle of NOx and the conversion of NOx to aerosol nitrate is complex, with different processes taking place during the day and night (Altieri et al. 2013). In addition to NOx being a precursor to ozone, ozone can be consumed in the conversion of NOx to nitrate aerosols, further complicating the influence of NOx on the chemistry of local and regional air pollution. Previous studies have used nitrogen and oxygen isotopes of nitrate as a tool for distinguishing NOx sources, as well as the chemical pathway through which NOx was converted to nitrate in polluted environments (Freyer 1978; Elliott et al. 2007). As NOx is converted to nitrate, the nitrogen atom is conserved; therefore the δ15N of nitrate will reflect the δ15N of the NO source. Indeed, studies of the isotopic composition of NOx have shown that NOx from vehicle emissions, power generation, industrial activities, lightning, soils, and biomass burning all have distinct isotopic compositions (Felix et al. 2012; Felix and Elliott 2014; Fibiger et al. 2014; Walters et al. 2015; Walters et al. 2015).
The fate of NOx emissions are usually investigated using dispersion models, but these models lack ozone and secondary PM formation and cannot directly address the relationship between NOx emissions and measured PM concentrations. Air mass back trajectory analysis is a useful approach for identifying which air masses are associated with higher/lower concentrations of a pollutant. However, the trajectory analysis does not account for loss processes, mixing, and secondary formation processes and only provides a qualitative connection between emission sources and ambient concentrations. The stable isotope approach is unique in that it enables us to quantitatively identify the NOx sources contributing to aerosol nitrate. Despite the hotspot of NOx emissions and the high levels of PM recorded at air quality monitoring stations in the HPA and VTAPA, to our knowledge, the nitrogen stable isotope approach has not been used in South Africa to attribute PM nitrate to local and regional NOx sources.
Methods
The VTAPA is a well-studied air pollution priority area in South Africa located near the Johannesburg-Pretoria megacity (Figure 1). Aerosol samples analysed for nitrogen stable isotope in this study were collected for a PM source apportionment study (Muyemeki et al. 2021). Briefly, continuous samples were collected at multiple sites using dichotomous low volume samplers with a flow rate of 15 L min-1 for the coarse size fraction (PM2.5-10) on 47 mm quartz fiber filter membranes. Two consecutive continuous 12-hour samples were collected daily (10:00 - 22:00 and 22:00 to 10:00).

For the nitrogen isotope case study presented here, sixteen coarse mode samples (8 days and 8 nights) collected from 21 June 2018 to 5 July 2018 at three sites were analysed (n = 48). Two of the sites are in densely populated low-income settlements (i.e., Sebokeng (26.5879°S, 27.8410°E) and Zamdela (26.8449°S, 27.8551°E)) and the third is in a low-density area (i.e., Kliprivier (26.4203°S, 28.0849°E); Figure 1). The wintertime samples were the focus of this study as the highest median values for PM2.5-10 occurred during winter (Muyemeki et al. 2021). The sampling and methodological approach used here results in a focus on the thermodynamically stable aerosol nitrate. Given the sampling was limited to coarse mode aerosols in the winter, there is little concern that fine mode ammonium nitrate volatilization is impacting the sampling of aerosol nitrate (Schaap et al. 2004). Furthermore, the isotopic approach is specific to inorganic nitrate such that organic nitrate molecules are excluded from analysis (Sigman et al. 2001).
Daytime and nighttime aerosol filters were combined to ensure sufficient sample nitrate for isotope analysis such that each combined sample represents 24-hours (e.g., Filter A = 21 June 2018 10:00 to 22:00 and Filter B = 21 June 2018 22:00 to 22 June 2018 10:00 were combined to generate extract 1 which is representative of 21 June 2018 10:00 to 22 June 2018 10:00).
Aerosol filters were extracted in 10 mL of ultrapure Milli-Q water, sonicated for one hour, stored at 4°C for 12-hours to maximize extraction efficiency, and then frozen for nitrate concentration and isotopic analysis (Gobel et al. 2013). The 15N/14N isotopic ratio of NO3- (δ15Ν) was determined using the denitrifier method following (Sigman et al. 2001) at Brown University. Briefly, natural strains of denitrifying bacteria (Pseudomonas aureofaciens) that lack the nitrous oxide (N2O) reductase enzyme needed to convert N2O to N2 were used to convert 20 nmol of NO3- to N2O. The N2O was then analysed by Gas-Chromatograph Isotope Ratio Mass Spectrometry (Thermo-Scientific Delta V Plus) for isotopic determination of 15N/14N (Sigman et al. 2001). International reference materials IAEA-N-3 and USGS-34 were used to normalize isotopic values to N2 in air. The pooled standard deviations of references IAEA-N3 and USGS-34 for δ15N were 0.09%o (n=7) and 0.12%o (n=7), respectively. The pooled standard deviation of sample replicates and duplicates for δ15N was 0.25%.
Results and discussion
The coarse mode (PM2.5-10) aerosol δ15N-NO3- ranged from 1.1% to 16.6% (n=24) (Table 1). The aerosol δ15N-NO3- values observed here in the Highveld are comparable to winter observations in other regions where coal is the dominant energy source. For example, δ15N-NO3- in PM2.5 in Beijing had a winter average of 11.9% ± 4.4 whereas in summer the average was 2.2% ± 2.5 (Song et al. 2019). A similar study in Beijing focused on winter pollution and found daily PM2.5 δ15N-NO3- to range from 1.0% to 19.6% (Zhang et al. 2020). Similar patterns have been observed in the coal-burning Midwest region of the United States, where winter aerosol δ15N-NO3- was 7.6% higher than in summer (Elliott et al. 2009, 2019). For most locations where seasonal nitrate isotope data are available, winter is the season of highest δ15N-NO3- (Song et al. 2019; Zhang et al. 2020, 2021; Zong et al. 2017, 2020). This is typically attributed to the use of fossil fuel sources for heating and residential combustion. A complete seasonal analysis of aerosol δ15N-NO3- will reveal if similar patterns are evident in the Highveld region.

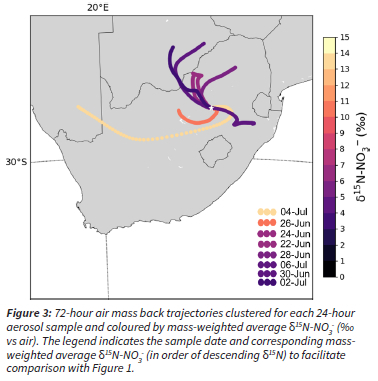
The δ15N was very similar across all three sites (Table 1; p >> 0.05), and the day-to-day variability was generally higher than the between site variability (Figure 2). In particular, the 4 July 2018 sample is higher in δ15N at all sites than any of the other sample days (Figure 2). This suggests that the aerosol nitrate resulted from a different combination of NO sources, or that there was a change in atmospheric or chemical conditions such that isotopic fractionation occurred. The average NO3-concentration varied little across the last three sampling days, from 2.5 μg m-3 on the 2 July, 3.6 μg m-3 on the 4 July, and 3.1 μg m-3 on the 6 July. However, the across site average δ15N-NO3- increased dramatically from the 2 to 4 July, i.e., from 3.5% to 14.6%, and then decreased back to 3.8% on the 6 July (Figure 2). The air mass back trajectories for each of these days shows that there was indeed a change in the source region from the 2 to 4 July (Figure 3). This highlights the sensitivity of the δ15N to changes in NOx sources, as compared to the insensitivity of concentration changes with respect to changes in NOx sources.
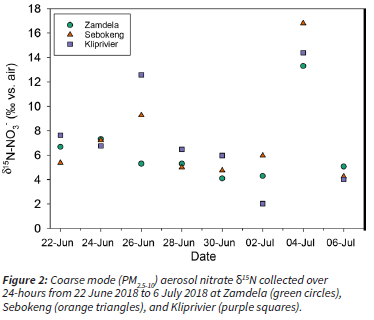
Although day-to-day variability is greater, there is still between site variability, particularly on the 26 June and 2 July. It is possible that the sites have different air mass histories on those days, but the coarse resolution of the meteorology input data (GDAS 1°) and back trajectory modeling limits our ability to run specific back trajectories for each site. Given how close the three sites are, very high-resolution meteorological data are needed to distinguish site-specific air mass back trajectories. Another possibility is that local emissions are influencing the sites on those days. Although they are all located in the Vaal Triangle and influenced by domestic fuel burning, the sites have different proximities to local industry. Zamdela is just south of the Sasol Chemical Industries Complex, Sebokeng is north of both metallurgical industries and mining activities, and Kliprivier is near steel and metalloy industries (Figure 1). Therefore, the between-site variability could be due to differing regional sources that are not evident with low-resolution back trajectory modeling, or site-specific local sources.
Source apportionment using a Bayesian isotope mixing model
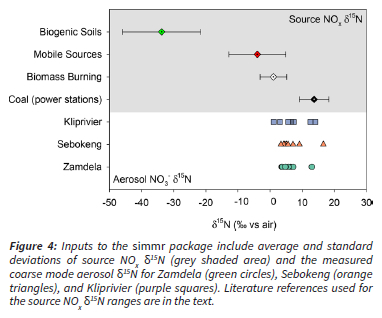
Bayesian isotope mixing models are a commonly used approach for mathematically determining the contribution from multiple sources to a measured isotope value, in this case, the contribution of multiple NOx sources to a measured aerosol nitrate sample. simmr is a stable isotope mixing model designed to solve mixing equations for stable isotope data within a Bayesian framework (Parnell et al. 2010, 2013). In this model, Markov chain Monte Carlo works by considering all possible solutions within the given space of uncertainty (i.e., 95% confidence interval). simmr requires a minimum of 3 input objects; the measured isotopic composition of the samples, the mean δ15Ν of the possible sources, and the associated standard deviations of the source δ15Ν (Figure 4).
simmr model inputs
The expected dominant NOx sources in the Highveld include coal combustion, vehicles, biomass burning, and biogenic soil emissions (Collett et al. 2010). The utility of the nitrogen stable isotope composition is dependent on these NOx sources having differing isotopic signatures. Below we present the most recent and community accepted δ15N-NOx values and discuss their relevance to the South African context.
The NOx emitted from coal-burning power stations is formed from either the reaction of air N2 with O2 during combustion and/or the reaction of nitrogen in the coal with O2. The δ15Ν of NOx emitted from coal-fired power plants is therefore dependent on the δ15Ν of the nitrogen in the coal, and on the technologies used to reduce NOx emissions (or lack thereof) (Felix et al. 2012). The δ15Ν of coal does not vary considerably, with reported values ranging from 1.0%o to 4.0%o for coal from a diversity of sources (Felix et al. 2012). Furthermore, a local study of South African coal-δ15N found values of 1.0% to 1.2% (Heaton 1990). A study in the USA of multiple power stations burning the same coal with different technologies found that the dominant control on the NOx δ15Ν was the presence (or absence) of NOx reduction technologies (Felix et al. 2012). Coal-fired power stations in South Africa are not currently operated with NOx or sulfur-reducing technologies such as over fire air, selective catalytic (or noncatalytic) reduction, low NOx burners, or flue gas desulfurization. As such, the closest analogue from measured power station δ15Ν-ΝΟx includes power stations in the USA measured with the selective catalytic reduction turned off (δ15Ν-ΝΟx = 10.5%o ± 2) (Felix et al. 2012; Walters et al. 2015), and a study of power plants in China with a range of emissions reductions δ15N-NOx = 14.5%o ± 4.4) (Song et al. 2019). Interestingly, the δ15Ν of NOx emitted from four South African power stations was measured in the 1980's and was found to range from 6% to 13% (Heaton 1990). However, these values should be treated with caution given recent studies on methodological challenges associated with capturing NOx in these environments and the rigorous procedures that are now considered standard for capturing NOx for isotopic analyses (Walters et al. 2015; Walters et al. 2015; Felix et al. 2012; Fibiger et al. 2014). In order to capture the variability in measured values, the δ15N-NOχ for coal-fired power stations was set at 13.7% ± 4.6 (Figure 4), in line with other recent studies on air pollution in Chinese cities (e.g., Chang et al. 2018, 2019).
The δ15N of vehicle emitted NOx is well constrained with respect to the emissions from specific vehicles across driving conditions (Walters et al. 2015). The thermal production of NOx in the combustion chamber of vehicles results from N2 in air, which has a δ15N of 0%o. In a study of 26 different petrol and diesel vehicles representing 12 manufacturers and varying in model year from 1995 to 2015, the δ15N-NO ranged from -19.1% to 9.8%. Diesel vehicles had distinctly lower δ15N-NOx values than petrol vehicles (-23.9% to -15.9% vs. -15.1% to 10.5%, respectively) due to the different combustion conditions. The same South African study that measured power station NOx in the 1980's also measured vehicle exhaust, and the δ15N-NO ranged from -2% to -13% (Heaton 1990), which is comparable to the more modern values. The vast majority of NOx emissions result in the first few minutes when a cold engine is started, and as a result, vehicle run time is highly correlated with the δ15N-NOx emitted.
Given these controls on the δ15N-NO from vehicle emissions, vehicle run time is commonly used to predict the δ15N of vehicle emissions for petrol and diesel vehicles (Walters et al. 2015). Walters et al. (2015) apply this numerical approach to estimate δ15N-NO from vehicle emissions for the USA using commute times and assuming all vehicles are petrol (the diesel share is ~ 2% in the USA). Following their approach, we calculate an estimate of the range of δ15N-NO values for the South African vehicle fleet using local commute times and the market share of petrol and diesel vehicles. South African commute times are significantly longer than the OECD country average according to a comprehensive analysis of four surveys across a 20 year period (Kerr 2015). The total calculated commute times reported were 68 to 94 minutes per day, with driving times reported to range from 29 to 42 minutes and minibus times from 38 to 53 minutes. Vehicle fleet data suggest diesel vehicles are ~ 17% of the South African fleet (Posada 2018). Using commute times of 23 to 59 minutes, we calculate that the δ15N-NOx for petrol vehicles ranges from -2.2% to -0.6% and for diesel vehicles ranges from -17.6% to -15.7%. The mass-weighted average and standard deviation for South African vehicle emissions δ15N-NO , assuming diesel vehicles account for 17% of the total fleet, is calculated as -3.96% ± 8.9 (Figure 4). This is remarkably similar to the globally recommended value for mobile emissions of -3.71% ± 10.4 (Chang et al. 2018). Here, we used the South African estimate, although it is important to note that what is presented here is overly simplistic. It is recommended that an in-depth analysis of commute times as a function of transport mode, vehicle type, age, and fuel usage be conducted to constrain this end member input for future isotope studies.
The δ15N of the NOx released during biomass burning is primarily driven by the δ15 N of the biomass being burned. A comprehensive assessment of multiple biomass types burned in controlled conditions resulted in an average δ15N-NO of 1.04% ± 4.1 (Fibiger and Hastings 2016). The biomass species burned in Fibiger and Hastings (2016) were all North American, and there is evidence that climatic drivers influence plant and soil δ15 N with higher values observed in the mid-latitude southern hemisphere than in the mid-latitude northern hemisphere (Amundson et al. 2003). Indeed, a study of plant-δ15N from a variety of species collected over three years from multiple habitats in Kruger National Park had values ranging from 2.3% to 6.7% (trees), 1.7% to 6.4% (grasses), and 2.3% to 8.4% (forb) (Codron et al. 2013). However, lower values were observed during the dry season than the wet season, e.g., dry season grasses had a δ15N of 2.7% ± 2.0. There is significantly less rainfall in winter in the study region, which suggests the lower end of the isotopic range is most appropriate for this study. Until a more comprehensive assessment of the δ15N of local biomass can be determined, the Fibiger and Hastings (2016) estimate for biomass burning δ15N-NOx (i.e., 1.04% ± 4.1; Figure 4) is used in this study as it overlaps the values measured in at least one region of South Africa.
The δ15N of biogenic NO emissions from soils is not dependent on the soil δ15N or the δ15N of fertilizer (i.e., if the soils are fertilized), but rather the biological processes that lead to NO release (Li and Wang 2008). The NO that is released is an intermediate that forms from nitrification of ammonium to nitrate and denitrification from nitrate to nitrogen gas. Both processes result in a strong kinetic preference for 14N such that the products (in this case NO) are heavily depleted in δ15N (Ludwig et al. 2001). As a result, NO from soils is very isotopically deplete (-50% to -30%) and is isotopically distinct from all other NOx emission sources. As the biological processes would be the same in South African soils, we use the commonly accepted δ15N-NOx for biogenic soil emissions of -33.8% ± 12.2 (Li and Wang 2008) (Figure 4).
simmr model results
The simmr mixing model results were identical for the three sites when each dataset was input separately. Therefore, the results from the simmr model presented below are based on using the mass-weighted average for each sample day across the three sites. To summarize the above discussion, the source NO δ15N values used were 13.7% ± 4.6 for coal-fired power stations, -3.96% ± 8.88 for mobile sources (i.e., vehicles), 1.04% ± 4.13 for biomass burning, and -33.77% ± 12.16 for biogenic soil emissions (Figure 4).
According to the simmr model output, coal combustion NOx is the dominant source and accounts for 66% (± 8.1%) of the aerosol nitrate. This is in addition to the large direct contribution coal combustion makes to the fine (>60%) and coarse (up to 20%) PM fraction (Muyemeki et al. 2021). NOx from biomass burning contributes 15.6% (± 10.3%) to aerosol nitrate. This is consistent with the seasonal patterns in biomass burning in South Africa with an expected peak in late winter and early spring (Hersey et al. 2015). The third largest NOx source to aerosol nitrate was vehicles, which contributed 12.0% (± 7.5). Vehicles were also a large contributor to coarse PM concentrations (14%) (Muyemeki et al. 2021). The smallest NOx source was soils, which contributed 6.4% (± 3.1%). Given that it was winter, it is expected that soil biological activity should be at a minimum.
The Monte Carlo analysis incorporates the uncertainty in the NO source signature δ15N. These estimates could be refined by directly measuring the source δ15N-NOχ in South Africa. In particular, the emissions from coal fired power plants need to be measured directly due to the unique technology used in South African power stations as well as the lack of pollution control technologies. In addition, a more nuanced understanding of vehicle fleet composition and commute times would allow for a narrower estimate of vehicle emission δ15N-NOχ, and perhaps even site-specific source estimates. The results of this study suggest that future work on site-specific fleet modeling would be useful for understanding the impact of vehicle emissions on NOx and aerosol nitrate.
Conclusions
Coarse mode (PM2.5-10) aerosol samples were collected at three sites during winter in the VTAPA and the nitrogen isotope composition of the aerosol nitrate was determined. The range and variability in the δ15N-NO3- was similar across all three sites. The sample days with elevated δ15N-NO3- have different air mass back trajectories compared to the rest of the sample set, suggesting that those regions have a different combination of NOx sources. A Bayesian isotope mixing model was used along with source NO δ15N data from the literature to determine the NOx source contributions to the observed aerosol δ15N-NO3-. Over two-thirds of the aerosol nitrate was formed from power station coal-burning NOx emissions, while biomass burning and vehicle NOx emissions contributed the remainder. Soil emissions made a minor contribution. This study highlights the utility of the nitrogen stable isotopes in constraining the relative importance of different NOx sources to secondary PM, and in determining the NOx sources that impact the nitrate component of PM at a given site. Ultimately this information can be used to design NOx reduction strategies in a way that maximizes the impact on the PM burden.
Acknowledgements
The authors thank the Climatology Research Group at the Northwest University for collecting the aerosol samples as part of the Vaal Triangle Air-Shed Priority Area Source Apportionment Study. we also thank Emily Joyce and Meredith Hastings for assistance with isotope analyses. This work was supported by a Sasol Research Grant and the University of Cape Town VC Future Leaders 2030 programme. We further acknowledge the support of the DSI Biogeochemistry Research Infrastructure Platform (BIOGRIP).
References
Altieri KE, Hastings MG, Gobel AR, Peters AJ, & Sigman DM (2013) 'Isotopic composition of rainwater nitrate at Bermuda: The influence of air mass source and chemistry in the marine boundary layer', Journal of Geophysical Research: Atmospheres, 118(19):11-304. [ Links ]
Altieri KE & Keen SL (2019) 'Public health benefits of reducing exposure to ambient fine particulate matter in South Africa', Science of The Total Environment, 684:610-620, doi:10.1016/j.scitotenv.2019.05.355. [ Links ]
Amundson R, Austin AT, Schuur E a. G, Yoo K, Matzek V, Kendall C, Uebersax A, Brenner D, & Baisden WT (2003) 'Global patterns of the isotopic composition of soil and plant nitrogen', Global Biogeochemical Cycles, 17(1), doi:10.1029/2002GB001903. [ Links ]
Chang Y, Zhang Y, Tian C, Zhang S, Ma X, Cao F, Liu X, Zhang W, Kuhn T, & Lehmann MF (2018) 'Nitrogen isotope fractionation during gas-to-particle conversion of NOx to NO3- in the atmosphere - implications for isotope-based NOx source apportionment', Atmospheric Chemistry and Physics, 18(16):11647-11661, doi: https://doi.org/10.5194/acp-18-11647-2018. [ Links ]
Chang Y, Zhang Y-L, Li J, Tian C, Song L, Zhai X, Zhang W, Huang T, Lin Y-C, Zhu C, Fang Y, Lehmann MF, & Chen J (2019) 'Isotopic constraints on the atmospheric sources and formation of nitrogenous species in clouds influenced by biomass burning', Atmospheric Chemistry and Physics, 19(19):12221-12234, doi:10.5194/acp-19-12221-2019. [ Links ]
City of Cape Town (2008) Khayelitsha Air Pollution Strategy Project (KAPS) Report, City of Cape Town. [ Links ]
Codron J, Lee-Thorp JA, Sponheimer M, & Codron D (2013) 'Plant stable isotope composition across habitat gradients in a semi-arid savanna: implications for environmental reconstruction', Journal of Quaternary Science, 28(3):301-310, doi:10.1002/jqs.2614. [ Links ]
Collett KS, Piketh SJ, & Ross KE (2010) 'An assessment of the atmospheric nitrogen budget on the South African Highveld', South African Journal of Science, 106(5/6):1-9. [ Links ]
Elliott EM, Kendall C, Boyer EW, Burns DA, Lear GG, Golden HE, Harlin K, Bytnerowicz A, Butler TJ, & Glatz R (2009) 'Dual nitrate isotopes in dry deposition: Utility for partitioning NOx source contributions to landscape nitrogen deposition', Journal of Geophysical Research: Biogeosciences, 114(G4), doi:10.1029/2008JG000889. [ Links ]
Elliott EM, Kendall C, Wankel SD, Burns DA, Boyer EW, Harlin K, Bain DJ, & Butler TJ (2007) 'Nitrogen isotopes as indicators of NO x source contributions to atmospheric nitrate deposition across the midwestern and northeastern United States', Environmental Science & Technology, 41(22):7661-7667. [ Links ]
Elliott EM, Yu Z, Cole AS, & Coughlin JG (2019) 'Isotopic advances in understanding reactive nitrogen deposition and atmospheric processing', Science of The Total Environment, 662:393-403, doi:10.1016/j.scitotenv.2018.12.177. [ Links ]
Feig GT, Naidoo S, & Ncgukana N (2016) 'Assessment of ambient air pollution in the Waterberg Priority Area 2012-2015', The Clean Air Journal, 26(1):21-28. [ Links ]
Felix JD & Elliott EM (2014) 'Isotopic composition of passively collected nitrogen dioxide emissions: Vehicle, soil and livestock source signatures', Atmospheric Environment, 92:359-366, doi:10.1016/j.atmosenv.2014.04.005. [ Links ]
Felix JD, Elliott EM, & Shaw SL (2012) 'Nitrogen Isotopic Composition of Coal-Fired Power Plant NOx: Influence of Emission Controls and Implications for Global Emission Inventories', Environmental Science & Technology, 46(6):3528-3535, doi:10.1021/es203355v. [ Links ]
Fibiger DL & Hastings MG (2016) 'First Measurements of the Nitrogen Isotopic Composition of NOx from Biomass Burning', Environmental Science & Technology, 50(21):11569-11574, doi:10.1021/acs.est.6b03510. [ Links ]
Fibiger DL, Hastings MG, Lew AF, & Peltier RE (2014) 'Collection of NO and NO2 for Isotopic Analysis of NOx Emissions', Analytical Chemistry, 86(24):12115-12121, doi:10.1021/ac502968e. [ Links ]
Freiman MT & Piketh SJ (2003) 'Air Transport into and out of the Industrial Highveld Region of South Africa', Journal of Applied Meteorology and Climatology, 42(7):994-1002, doi:10.1175/1520-0450(2003)042<0994:ATIAOO>2.0.CO;2. [ Links ]
Freyer HD (1978) 'Seasonal trends of NH+4 and NO-3 nitrogen isotope composition in rain collected at Jülich, Germany', Tellus, 30(1):83-92, doi:10.1111/j.2153-3490.1978.tb00820.x. [ Links ]
Galloway JN, Dentener FJ, Capone DG, Boyer EW, Howarth RW, Seitzinger SP, Asner GP, Cleveland CC, Green PA, Holland EA, Karl DM, Michaels AF, Porter JH, Townsend AR, & Vosmarty CJ (2004) 'Nitrogen Cycles: Past, Present, and Future', Biogeochemistry, 70(2):153-226, doi:10.1007/s10533-004-0370-0. [ Links ]
Gobel AR, Altieri KE, Peters AJ, Hastings MG, & Sigman DM (2013) 'Insights into anthropogenic nitrogen deposition to the North Atlantic investigated using the isotopic composition of aerosol and rainwater nitrate', Geophysical Research Letters, 40(22):5977-5982. [ Links ]
Heaton THE (1990) '15N/14N ratios of NOx from vehicle engines and coal-fired power stations', Tellus B, 42(3):304-307, doi:10.1034/ j.1600-0889.1990.00007.x-i1. [ Links ]
Hersey SP, Garland RM, Crosbie E, Shingler T, Sorooshian A, Piketh S, & Burger R (2015) 'An overview of regional and local characteristics of aerosols in South Africa using satellite, ground, and modeling data', Atmospheric Chemistry and Physics, 15(8):4259-4278, doi:10.5194/acp-15-4259-2015. [ Links ]
Igbafe AI, Jewell LL, Piketh SJ, & Dlamini TS (2015) 'A Wintertime Impact of Dilution on Transformation Rate in the Planetary Boundary Layer', Journal of Environmental Informatics, 8(1):34-48. [ Links ]
Kerr A (2015) Tax(i)ing the poor? Commuting costs in South Africa, University of Cape Town, Cape Town. [ Links ]
LiD& Wang X (2008) 'Nitrogen isotopic signature of soil-released nitric oxide (NO) after fertilizer application', Atmospheric Environment, 42(19):4747-4754, doi:10.1016/j.atmosenv.2008.01.042. [ Links ]
Lourens AS, Beukes JP, Van Zyl PG, Fourie GD, Burger JW, Pienaar JJ, Read CE, & Jordaan JH (2011) 'Spatial and temporal assessment of gaseous pollutants in the Highveld of South Africa', South African Journal of Science, 107(1/2):1-8, doi:10.4102/sajs.v107i1/2.269. [ Links ]
Lourens ASM, Butler TM, Beukes JP, van Zyl PG, Beirle S, Wagner TK, Heue K-P, Pienaar JJ, Fourie GD, & Lawrence MG (2012) 'Re-evaluating the NO2 hotspot over the South African Highveld', South African Journal of Science, 108(11-12):83-91. [ Links ]
Ludwig J, Meixner FX, Vogel B, & Förstner J (2001) 'Soil-air exchange of nitric oxide: An overview of processes, environmental factors, and modeling studies', Biogeochemistry, 52(3):225-257, doi:10.1023/A:1006424330555. [ Links ]
Muyemeki L, Burger R, Piketh SJ, Language B, Beukes JP, & Zyl PG van (2021) 'Source apportionment of ambient PM10-25 and PM25 for the Vaal Triangle, South Africa', South African Journal of Science, 117(5/6), doi:10.17159/sajs.2021/8617. [ Links ]
Naude A, Badenhorst W, Zietsman L, Van Huyssteen E, & Maritz J (2007) Geospatial Analysis Platform - Version 2: Technical overview of the mesoframe methodology and South African Geospatial Analysis Platform., CSIR. [ Links ]
Parnell AC, Inger R, Bearhop S, & Jackson AL (2010) 'Source Partitioning Using Stable Isotopes: Coping with Too Much Variation', PLOS ONE, 5(3):e9672, doi:10.1371/journal.pone.0009672. [ Links ]
Parnell AC, Phillips DL, Bearhop S, Semmens BX, Ward EJ, Moore JW, Jackson AL, Grey J, Kelly DJ, & Inger R (2013) 'Bayesian stable isotope mixing models', Environmetrics, 24(6):387-399, doi:10.1002/env.2221. [ Links ]
Pervin T, Gerdtham U-G, & Lyttkens CH (2008) 'Societal costs of air pollution-related health hazards: A review of methods and results.', Cost effectiveness and resource allocation: C/E, 6:19, doi:10.1186/1478-7547-6-19. [ Links ]
Piketh SJ, Annegarn HJ, & Tyson PD (1999) 'Lower tropospheric aerosol loadings over South Africa: The relative contribution of aeolian dust, industrial emissions, and biomass burning', Journal of Geophysical Research: Atmospheres, 104(D1):1597-1607, doi:10.1029/1998JD100014. [ Links ]
Posada F (2018) South Africa's New Passenger Vehicle CO2 Emission Standards: Baseline determination and benefits assessment, The International Council on Clean Transportation, https://www.fiafoundation.org/media/461198/south-africa-pv-emission-stds_icct-white-paper_17012018_vf-1.pdf. [ Links ]
Schaap M, Spindler G, Schulz M, Acker K, Maenhaut W, Berner A, Wieprecht W, Streit N, Müller K, Brüggemann E, Chi X, Putaud J-P, Hitzenberger R, Puxbaum H, Baltensperger U, & ten Brink H (2004) 'Artefacts in the sampling of nitrate studied in the "INTERCOMP" campaigns of EUROTRAC-AEROSOL', Atmospheric Environment, 38(38):6487-6496, doi:10.1016/j.atmosenv.2004.08.026. [ Links ]
Seinfeld JH & Pandis SN (2012) Atmospheric Chemistry and Physics: From Air Pollution to Climate Change, Wiley. [ Links ]
Sigman DM, Casciotti KL, Andreani M, Barford C, Galanter M, & Böhlke JK (2001) 'A Bacterial Method for the Nitrogen Isotopic Analysis of Nitrate in Seawater and Freshwater', Analytical Chemistry, 73(17):4145-4153, doi:10.1021/ac010088e. [ Links ]
Song W, Wang Y-L, Yang W, Sun X-C, Tong Y-D, Wang X-M, Liu C-Q, Bai Z-P, & Liu X-Y (2019) 'Isotopic evaluation on relative contributions of major NOx sources to nitrate of PM2.5 in Beijing', Environmental Pollution, 248:183-190, doi:10.1016/j.envpol.2019.01.081. [ Links ]
Thabethe NDL, Engelbrecht JC, Wright CY, & Oosthuizen MA (2014) 'Human health risks posed by exposure to PM10 for four life stages in a low socio-economic community in South Africa', Pan African Medical Journal, 18:1-12, doi:10.11604/pamj.2014.18.206.3393. [ Links ]
Venter AD, Vakkari V, Beukes JPJP, van Zyl PG, Laakso H, Mabaso D, Tiitta P, Josipovic M, Kulmala M, Pienaar JJ, & Laakso L (2012) 'An air quality assessment in the industrialised western Bushveld Igneous Complex, South Africa', South African Journal of Science, 108(9-10):1-10. [ Links ]
Walters Wendell W., Goodwin SR, & Michalski G (2015) 'Nitrogen Stable Isotope Composition (δ15N) of Vehicle-Emitted NOx', Environmental Science & Technology, 49(4):2278-2285, doi:10.1021/es505580v. [ Links ]
Walters W.W., Tharp BD, Fang H, Kozak BJ, & Michalski G (2015) 'Nitrogen Isotope Composition of Thermally Produced NOx from Various Fossil-Fuel Combustion Sources', Environmental Science and Technology, 49(19):11363-11371, doi:10.1021/acs. est.5b02769. [ Links ]
Zhang Z, Guan H, Luo L, Zheng N, Xiao Hongwei, Liang Y, & Xiao Huayun (2020) 'Sources and transformation of nitrate aerosol in winter 2017-2018 of megacity Beijing: Insights from an alternative approach', Atmospheric Environment, 241:117842, doi:10.1016/j.atmosenv.2020.117842. [ Links ]
Zhang Z, Guan H, Xiao Hongwei, Liang Y, Zheng N, Luo L, Liu C, Fang X, & Xiao Huayun (2021) 'Oxidation and sources of atmospheric NOx during winter in Beijing based on δ180-δ15N space of particulate nitrate', Environmental Pollution, 276:116708, doi:10.1016/j.envpol.2021.116708. [ Links ]
Zhao X, Yu X, Wang Y, & Fan C (2016) 'Economic evaluation of health losses from air pollution in Beijing, China', Environmental Science and Pollution Research, 23(12):11716-11728, doi:10.1007/s11356-016-6270-8. [ Links ]
Zong Z, Tan Y, Wang X, Tian C, Li J, Fang Y, Chen Y, Cui S, & Zhang G (2020) 'Dual-modelling-based source apportionment of NOx in five Chinese megacities: Providing the isotopic footprint from 2013 to 2014', Environment International, 137:105592, doi:10.1016/j.envint.2020.105592. [ Links ]
Zong Z, Wang X, Tian C, Chen Y, Fang Y, Zhang F, Li C, Sun J, Li J, & Zhang G (2017) 'First Assessment of NOx Sources at a Regional Background Site in North China Using Isotopic Analysis Linked with Modeling', Environmental Science & Technology, 51(11):5923-5931, doi:10.1021/acs.est.6b06316. [ Links ]
Received: 5 October 2021
Reviewed: 26 November 2021
Accepted: 20 April 2022

