


Services on Demand
Article
 English (pdf)
 Article in xml format
 Article references
Indicators

Related links
-
 Cited by Google
 -
 Similars in Google
Share

 Permalink
Clean Air Journal
On-line version ISSN 2410-972X
Print version ISSN 1017-1703
Clean Air J. vol.32 n.1 Pretoria 2022
http://dx.doi.org/10.17159/caj/2022/32/1.12866
RESEARCH ARTICLE
Wet season chemical composition of atmospheric wet deposition at Cape Point
Jan-Stefan SwartzI; Pieter G. Van ZylI; Johan P. BeukesI; Corrinne Galy-LacauxII; Casper LabuschagneIII; Ernst-Günther BrunkeI; Thumeka MkololoIII; Jacobus J. PienaarI
IChemical Resource Beneficiation, Atmospheric Chemistry Research Group, North-West University, Potchefstroom, 2520, South Africa
IILaboratoire d'Aérologie (Laero), Université de Toulouse, CNRS, UPS, France
IIISouth African Weather Service, c/o CSIR, P.O. Box 320, Stellenbosch 7599, South Africa
ABSTRACT
The measurement of precipitation chemistry enables the assessment of the temporal and spatial evolution of the chemical composition of the atmosphere associated with atmospheric physical and chemical mechanisms. The aims of this study were to report the chemical composition of rainwater collected at a marine environment, i.e. the Cape Point Global Atmosphere Watch (CPT GAW) station from 2004 to 2012. As expected, the volu me weighted mean (VWM) concentrations of Na+ (298.64 μEq.L-1) and Cl- (354.18 μEq.L-1) were significantly higher compared to the VWM concentrations of other ionic species, as well as compared to the VWM concentrations thereof at the sites in the South African interior. The average pH of rainwater was slightly lower than the pH of unpolluted rainwater, mainly due to NO3- associated with the occasional influence of the Cape Town metropole. In contrast to the sites situated in the north-eastern South African interior, where anthropogenic SO42- was the major constituent in rainwater, SO42- at CPT GAW was entirely associated with marine air with no anthropogenic contribution. It was also indicated that 94% of the chemical content at CPT GAW can be attributed to the marine source.
Keywords: precipitation chemistry, atmospheric fluxes, inorganic ions, Global Atmosphere Watch (GAW), South Africa
Introduction
Atmospheric pollutants are emitted into the atmosphere from various natural (e.g. marine, biogenic and crustal sources) and anthropogenic sources (e.g. fossil fuel combustion, traffic emissions and household combustion) (Mphepya et al., 2004). One of the mechanisms by which pollutants are removed from the atmosphere is through wet deposition (Josipovic et al., 2011). Many atmospheric pollutants are water soluble and are dissolved in cloud water and rain droplets (Waldman et al., 1992). The chemical analysis of rainwater enables the assessment of the temporal and spatial evolution of the chemical composition of the atmosphere, which reflects the numerous atmospheric physical and chemical mechanisms (Mphepya et al., 2006). Rainwater chemistry also reveals changes in atmospheric composition attributed to variances in natural and anthropogenic source contribution and/or meteorology (Vet et al., 2014). In addition, wet deposition can be considered a source of nutrients (e.g. nitrogen, N and sulphur, S) to ecosystems or transport toxic species to the environment depending on its chemical composition (Duce et al., 2009).
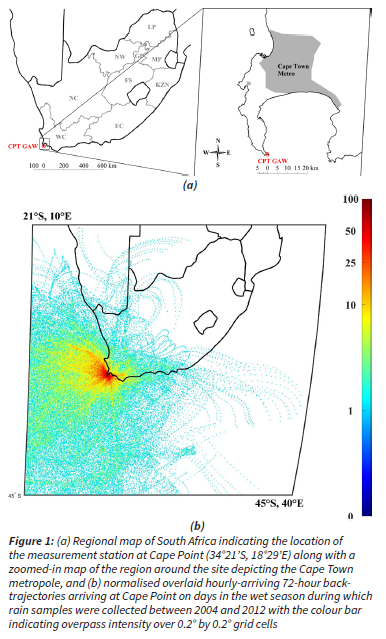
Conradie et al. (2016) presented the chemical composition and fluxes of atmospheric wet deposition at four sites located in the interior of South Africa, which are considered to be regionally representative of semi-arid and savannah ecosystems. These sites form part of the South African component of the Deposition of Biogeochemically Important Trace Species (DEBITS) project, which was initiated in 1990 by the Global Atmosphere Watch (GAW) network of the World Meteorological Organisation (WMO) and currently endorsed by the International Global Atmospheric Chemistry (IGAC) programme. The main objectives of DEBITS entail long-term assessments of atmospheric biogeochemical species (mainly carbon (C), N and S species) in the tropics, as well as wet and dry deposition of these species (Lacaux et al., 2003). Also included in the South African DEBITS network is the globally significant Cape Point (CPT) Global Atmosphere Watch (GAW) station, which is a coastal site mainly being impacted by southern hemisphere marine air masses (Fig. 1). CPT GAW is, however, occasionally influenced by air masses passing over the urban-continental region (Fig.1). The aims of this study were to (i) assess the chemical composition of wet season rainwater collected at CPT GAW from 2004 to 2012, (ii) determine S and N wet deposition fluxes, (iii) establish the major sources of ionic species, and (iv) relate ionic composition and wet deposition fluxes at CPT GAW to the South African interior in order to complement the precipitation chemistry presented for the other South African sites (Conradie et al., 2016, Mphepya et al., 2004, Mphepya et al., 2006, Kok et al., 2021).
Methods
Site description
Detailed descriptions of the CPT GAW station are presented in a number of studies (Brunke et al., 2010, Labuschagne et al., 2018). As indicated in Fig. 1, the CPT GAW site (34°21'S, 18°29'E) is located at the southernmost tip of the peninsula on a cliff approximately 230 m above sea-level and approximately 60 km south of the Cape Town metropole (Brunke et al., 2004). The site is situated within a nature reserve within the Cape Floral Region Protected Areas (CFRPA), which has been afforded United Nations Educational, Scientific and Cultural Organization (UNESCO) world heritage status since 2004 (UNESCO, 2015).
Back trajectory analysis
72-hour back trajectories of air mass movement prior to its arrival at the CPT GAW site on days in the wet season during which rain samples were collected at an arrival height of 100 m above ground level are overlaid in Fig. 1b. These trajectories were calculated using the Hybrid Single-Particle Langrangian Integrated Trajectory (HYSPLIT) model (version 4.8) that was developed by the National Oceanic and Atmospheric Administration (NOAA) Air Resources Laboratory (ARL) (Draxler and Hess, 2004). Meteorological data was obtained from the Global Data Assimilation System (GDAS) archive of the National Centre for Environmental Prediction (NCEP) of the United States National Weather Service. Back trajectories were overlaid with fit-for-purpose mathematical programming software on a map of southern Africa that was divided into 0.2° x 0.2° grid cells. The frequency with which trajectories pass over each grid cell is represented by a colour scale where dark blue indicates the lowest proportion, and dark red the highest. This overlay back trajectory map supports the general statement made earlier (in Section 1) that the site is predominantly impacted by marine air masses, and occasionally impacted by continental air masses passing over the Cape Town metropole.
Sampling procedures
Rainwater samples were collected during the wet season from January 2004 to December 2012 on an event basis with an automated wet-only sampler similar to those used at the western and central African DEBITS sites (Galy-Lacaux et al., 2009). The sampler was equipped with a precipitation sensor that controls the cover of the sampler, opening when rain was detected, and hermetically sealing a single-use polyethylene bag in which the rainwater was collected. The precipitation collection area was 225 cm2. After a rain event, or as soon as practically possible, the collected rainwater was distributed between two 50 ml Greiner-type essay-tubes and frozen (-18°C) immediately. (Galy-Lacaux et al., 2009). Rain depth at CPT GAW was measured with a standard funnel rain gauge.
Although the field protocols of the WMO for precipitation chemistry measurements (WMO, 2004) were followed in general, rainwater sampling at CPT GAW did not entirely comply with WMO protocols. A limitation of the wet-only sampler used at the CPT GAW station was that the lid did not close automatically after a rain event. Furthermore, rainwater samples were only collected during scheduled visits to the CPT GAW site due to logistical restraints. Therefore, some of the advantages associated with using a wet-only sampler, which include minimising contamination of rain samples and delays related to manual operations, were not realised. In addition, some rain samples also comprised composite samples of more than one rain event, such as different rain events occurring on consecutive days. However, in the absence of any other precipitation chemistry measurements for a marine environment in South Africa, as well as within the logistical limitations, the rainwater samples collected at CPT GAW can be considered as the best available of rainwater chemistry for a southern-hemispherical marine background site.
Analysis
The same analytical procedures were followed, as presented by Conradie et al. (2016) and Kok et al. (2021) for the four South African DEBITS sites and Welgegund in the interior of South Africa. In short, samples were unfrozen and analysed immediately. Initial analysis entailed pH and conductivity measurements with an HI 255 combined meter (Hanna Instruments) utilising a low ionic strength electrode. A Dionex ICS 3000 ion chromatograph (IC) was used to determine cation and anion species, i.e. sodium (Na+), ammonium (NH4+), potassium (K+), calcium (Ca2+), magnesium (Mg2+), nitrate (NO3-), chloride (Cl-), sulphate (SO42-), as well as water-soluble organic acids (OA), including formic-(COO-), acetic- (CH3COO-), propionic- (C2H5COO-) and oxalic acid (C2O42-) in rainwater samples. Details of the IC analytical setup, as well as detection limits of these species were presented by Conradie et al. (2016).
Quality assurance / quality control
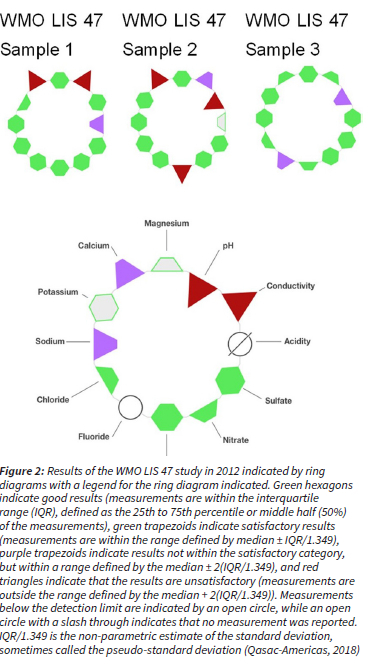
Data quality was ensured in accordance with the WMO Data Quality Objectives (DQO) stated in the WMO precipitation chemistry manual (WMO, 2004). All rainwater samples were visually inspected in order to identify visible contaminants, e.g. dust, insects and plant matter, which were removed by filtering the sample through a 0.2 μm filter (supplied by Sigma Aldrich) prior to chemical analysis. Any visible contamination was also recorded. The accuracy of all analytical methods utilised in rainwater analysis (IC, pH and conductivity measurements) were also verified bi-annually through participation in 11 inter-laboratory comparison study (LIS) of the WMO from 2007 to 2012. Example results of the laboratory performance are presented in Fig. 2. Although the analytical laboratory demonstrated a few unsatisfactory results for some measurements (either biased high or low), no continuous or systematic biases were shown throughout the period. The ionic balance of each rain sample was also considered by calculating the ion difference (ID) with the following equation (WMO, 2004):
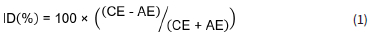
where AE is the total of the anions in μeqL-1 and CE is the total of the cations in μeqL-1. Acceptance ranges for the ID, as indicated in the WMO (2004) report, were applied to all the rain samples collected in this study. Only samples that passed WMO ID% criteria are reported in this paper.
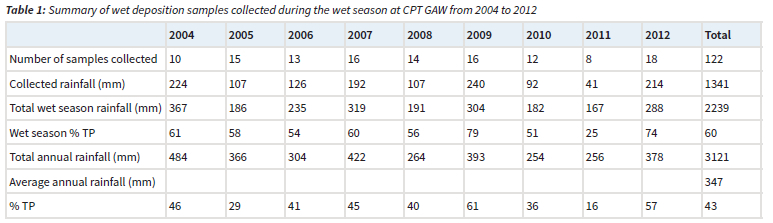
In Table 1, the total numbers of rainwater samples collected for chemical analysis are presented. All these samples passed the WMO ID% criteria, were of sufficient volume (> 0.2 mm) and were not associated with any analytical errors. As mentioned previously, due to limitations associated with the wet-only samplers utilised at CPT GAW, as well as logistical restraints related to sample collection, rainwater samples did not completely adhere to WMO protocols (e.g. some rainwater samples could contain an accumulation of several rain events). In addition, samples were only collected from May to October at CPT GAW, which correspond with the wet season in this part of South Africa. The percentage rainfall collected with valid precipitation chemistry data for all nine of the wet seasons at CPT GAW relative to the nine-year annual precipitation total, i.e. the percentage total precipitation (%TP), was 43%, with none of the nine sampling years reaching the WMO annual %TP acceptance range of 70%. In addition, seven of the nine years had a %TP < 50%. Although the dataset does not satisfy the WMO annual data completeness criterion of %TP > 70%, it does meet the WMO seasonal data completeness criterion of TP > 60%, having a multi-year wet season %TP = 60%. We therefore consider the dataset to be representative of wet season precipitation composition during the nine-year sampling period at the predominantly marine-influenced CPT site (Fig. 1b).
Calculations
The annual volume weighted mean (VWM) concentration of each ionic species was determined as follows (Conradie et al., 2016):

where Ci and Pi representing the concentration μeq.L-1) of a given ion and the standard gauge rain depth (mm) of each precipitation event, respectively, while N is the total number of rain samples (Table 1). The H+ concentrations were calculated from the measured pH values.
A general method utilised to estimate the contribution of sea salt to the ionic composition is to calculate the excess concentrations of K+, Mg2+, Ca2+, Cl- and SO42- with respect to sea salt using Na+ as a reference, i.e. assuming Na+ was completely of marine origin. Reference ratios of these species in relation to Na+ in seawater, as presented by (Keene et al., 1986), were used. The sea salt fractions (ssf) of any of these species, X, with respect to Na+ are:
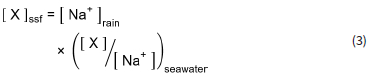
where [ X ]ssf, is the sea salt contribution of X, [ Na+ ]rain . is the Na+ concentration in rain, and [ X / Na+ ] seawater , is the seawater concentration ratio (Keene et al., 1986). The non-sea salt fraction (nssf) of X is then calculated by:

where [ X ]rain is the concentration of species X in rainwater. The seawater enrichment factors (EF) of species X with regard to the reference ratio were also calculated as follows (Quiterio et al., 2004, Chao and Wong, 2002):
Water-soluble OA in wet deposition was considered as reference species for biomass burning (Helas and Pienaar, 1996, Conradie et al., 2016). Neutralisation of sulphuric and nitric acids by base cations can be evaluated by calculating the neutralisation factors (NF) with the following equation (Laouali et al., 2012, Possanzini et al., 1988):
where X is the base cation of interest, i.e. Mg2+, Ca2+ and NH4+.
Results and discussion
Ionic composition
In Table 2, the wet season VWM concentrations of each ionic species, together with the averaged pH and electrical conductivity (EC) values determined at CPT GAW from 2004 to 2012, are listed. The water-soluble OAs are presented as the sum of VWM concentrations of COO-, CH3COO-, C2H5COO- and C2O42-. All-year round VWM concentrations reported by Conradie et al. (2016) for the four South African DEBITS sites in the interior, i.e. Amersfoort (AF), Louis Trichardt (LT), Skukuza (SK) and Vaal Triangle (VT), from 2009 to 2014 are also presented.
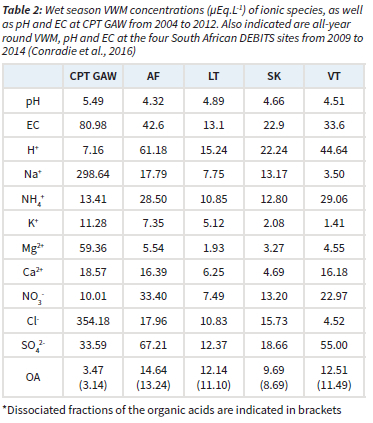
It is evident from Table 2 that Na+ and Cl- were the most abundant ionic species at CPT GAW, with significantly higher wet season VWM concentrations compared to other ionic species. In addition, Na+ and Cl- concentrations were also substantially higher than levels thereof at the four sites in the interior of South Africa, as well as concentrations reported for other DEBITS sites in Africa (Galy-Lacaux et al., 2009). These higher recorded values for Na+ and Cl- can be expected for a site predominantly influenced by marine air masses. This is also observed for other marine measurement sites such as Cape Grimm, Tasmania (Ayers and Ivey, 1988) and remote islands and coastal East Asian sites (Vet et al., 2014). The significantly higher Na+ and Cl- concentrations also contributed to noticeably higher EC of rainwater samples collected at CPT GAW compared to the other South African DEBITS sites. The second and third most abundant species were Mg+ and SO42-, respectively, which are also most likely mainly associated with marine air, as indicated in subsequent paragraphs. SO42- was the most abundant species at the four DEBITS sites in the South African interior, which was attributed, by Conradie et al. (2016), to sulphur emissions from anthropogenic activities in this region.
Although CPT GAW is on occasion influenced by air masses passing over the Cape Town metropole (Fig.1), especially during winter, a significantly lower impact of anthropogenic emissions on rainwater chemistry is expected, which is also signified by the lower VWM concentration of NO3- compared to the two industrially impacted AF and VT sites.
Substantially lower values are also reported for OA at CPT GAW compared to the other South African DEBITS sites, which reflects a less significant influence of biomass burning on rain chemistry at CPT GAW. Swartz et al. (2020) also indicated that seasonal open biomass burning in the Overberg region did not contribute substantially to the NO2 and O3 concentrations at CPT GAW.
Acidity
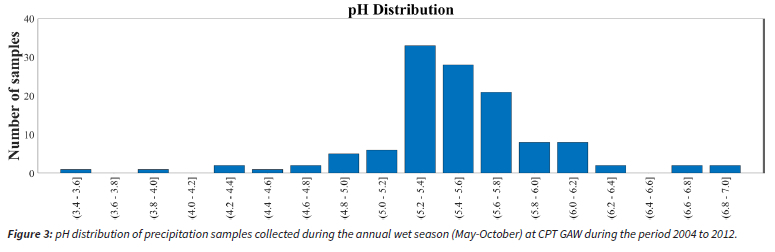
The average pH of wet season rainwater at CPT GAW was 5.49, which is slightly lower than the pH of unpolluted rainwater, i.e. 5.60 (Eby, 2004). Average rainwater pH at GPT GAW was higher than the average pH at all the sites located in the South African interior, including the rural background sites LT and SK. Evidently, the resultant H+ concentration was also lower at CPT GAW, especially being significantly lower than H+ levels at AF and VT in proximity of anthropogenic emissions. In Fig. 3, the pH frequency distribution of rain events occurring during the wet season at CPT GAW is presented. It is evident that most of rain events had pH values ranging between 5.2 and 5.8. It was found that 85% of rain events had pH > 5.2, while 35% had pH > 5.6. The average pH value of rainwater at CPT GAW reflects the low frequency impacts of anthropogenic activities and biomass burning on rainwater chemistry at CPT GAW. However, the occasional influence of anthropogenic emissions is reflected by the largest number of rain events having pH values between 5.2 and 5.4 (Fig. 3), while 9.8% of rain events had pH values lower than 5.0.
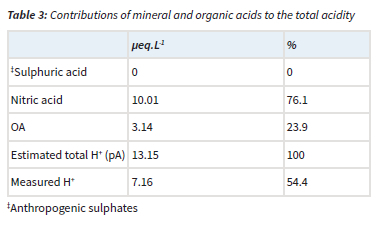
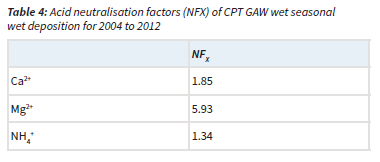
The acidity potential (pA), presented in Table 3, is the sum of the potential acidic compounds, which include sulphuric acid (anthropogenic SO42-), nitric acid (NO3-) and OA (Mphepya et al., 2004, Laouali et al., 2012). Empirical estimations indicated that SO42- in rainwater at CPT GAW was entirely from marine origin, i.e. completely in the sea-salt fraction (Equation 4). Therefore, terrigenous and anthropogenic sources did not contribute to any SO42- measured in rainwater. The measured acidity (H+, measured) at CPT GAW is lower than the estimated acidity (total H+, estimated from the pA), which can be ascribed to neutralisation by basic cation species such as Ca2+, NH4+ and Mg2+. Neutralisation factors were calculated (Equation 6) to evaluate the neutralisation of nitric acid by these bases, which indicated that Mg2+ is the major ionic species in rainwater that neutralises nitric acid (Table 4). The calculated potential contribution of the mineral acids (nitric acid) at CPT GAW is 76.1%, which forms the greatest part of free acidity. Therefore, the marginal acidity of rainwater at CPT GAW, as well as rain events with pH < 5, can be attributed to the influence of anthropogenic activities associated with the Cape Town metropole. In addition, Swartz et al. (2020) indicated that, especially during the wet season, CPT GAW is also impacted by the intermittent long-range transport of air masses passing over industrialised northern interior.
Sources
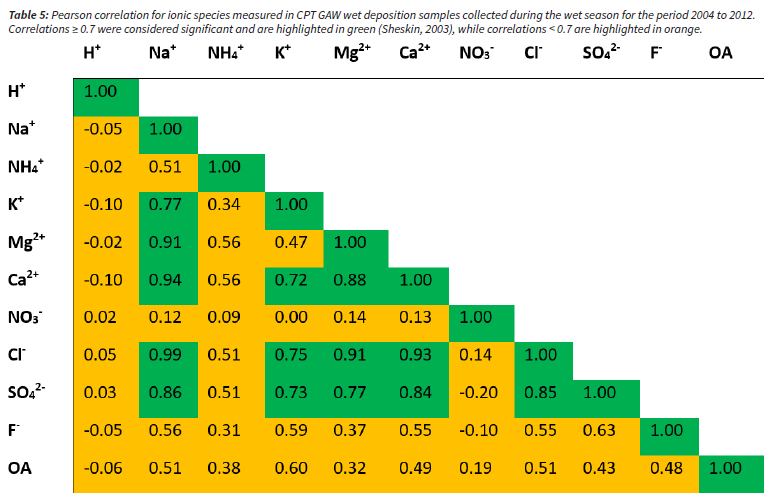
Explorative statistical analysis, i.e. Pearson correlation calculations, was conducted in order to establish relationships between the different ionic species, which could be indicative of similar sources of species. It is evident from Table 5 that good correlations are observed between all species considered to be associated with marine air masses, i.e. Na+, Cl-, Mg2+, K+, Ca2+ and SO42-. However, correlations between some of these species could also be attributed to terrigenous sources (e.g. Ca2+ and Mg2+), which will be explored in subsequent paragraphs. In contrast to Conradie et al. (2016), no correlation is observed between SO42-and NO3-, which is consistent with different sources, i.e. marine and anthropogenic, respectively, of these species at CPT GAW. In addition, NH4+ is moderately correlated with SO42- and other ionic species associated with marine air masses and weakly correlated to NO3-, which also reflects different sources of SO42-and NO3-. Furthermore, it implies that marine emissions of NH4+ could also be a potential source of NH4+ measured in rain at CPT GAW. It is also of interest to note that moderate correlations are observed between OA and species associated with marine air masses (e.g. Na+ and Cl-), which are indicative of some of these species also being of marine origin. In addition, no correlations are observed between H+ and acidic ions, which correspond to the low acidity of wet season rainwater.
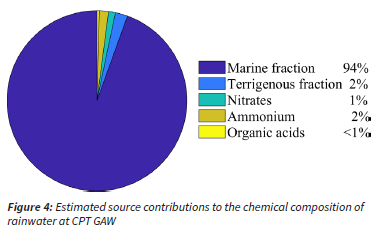
The ssf and nssf were calculated for the wet season VWM concentrations of Cl-, Mg2+, K+, Ca2+ and SO42- with Equations 3 and 4, as discussed in the quality assurance / quality control section, in order to estimate the marine and non-marine contributions, while it was assumed that Na+ was entirely from a marine source. The nssf of Cl-, Mg2+, K+, Ca2+ and SO42- was considered to be terrigenous. The sum of the VWM concentrations of the ssf and nssf of the species comprised the marine and terrigenous contributions, respectively. As indicated in the previous section, SO42- was completely of marine origin and an anthropogenic fraction was not calculated. It can be assumed that NO3- at CPT GAW is predominantly associated with anthropogenic activities in the Cape Town metropole, e.g. vehicular emissions and household combustion. Swartz et al. (2020) attributed increased NO2 concentrations at CP GAW to air masses passing over the Cape Town conurbation. NH4+ in precipitation is usually attributed to agricultural activities. However, guano from the sea birds and marine NH4+ emissions could potentially be a more significant source at CPT GAW. OA concentrations can be considered a proxy for the biomass burning contribution. In Fig. 4, a summary of the estimations of the source group contributions to the chemical composition of rainwater at CPT GAW is presented. It is evident from Fig. 4 that the chemical content of rainwater collected at CPT GAW was dominated by the marine contribution, i.e. 94%, while the other sources contributed < 2% each. This source group distribution for CPT GAW is completely unique in comparison to the source group distribution reported for the four other South African DEBITS sites located in the north-eastern interior where SO42- and NO3- dominated rainwater composition (Mphepya et al., 2004, Mphepya et al., 2006, Conradie et al., 2016). The main sources of ionic species in rainwater in the north-eastern interior of South African were the combustion of fossil fuels.
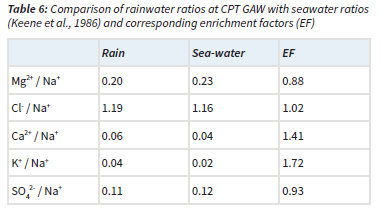
The ratios of Cl-, Mg2+, K+, Ca2+ and SO42- with regard to Na+ are presented together with the EFs (Equation 5) in relation to the reference seawater ratios (Keene et al., 1986) in Table 6. It is evident that the Cl-/Na+, Mg-+/Na+ and SO42-/Na+ ratios were similar to seawater ratios, with EFs very close to one. Calculation of nssf with Equation 4 indicated that Mg2+ and SO42- were completely in the ssf, while Cl- was almost entirely (98%) in the ssf. Comparison of rain- and seawater ratios of K+/Na+ and Ca2+/Na+ ratios, as well as EFs indicated that these were not only of marine origin. K+ and Ca2+ were also estimated to be from terrigenous sources, which mainly comprised the terrigenous contribution to the chemical content of rainwater. Therefore, correlations between these species (Table 5) could also be attributed to terrigenous/crustal sources.
Conclusions
A total of 122 rainwater samples were collected during the wet season (May to October) at CPT GAW from 2004 to 2012. Although the WMO criteria for precipitation collection were generally followed, logistical and instrumental limitations did not allow for sample collection to adhere completely to the WMO guidelines. Therefore, only 43% of the total rain depth from 2004 to 2012 was collected. However, 100% of the samples passed the WMO ID% criteria and none of the samples were discarded due to analytical errors, while samples represented 60% of the wet season rainfall. Therefore, the samples were considered to satisfactorily represent the chemical composition of wet season rainfall over the nine-year sampling period.
Na+ and Cl- were the most abundant ionic species at CPT GAW, with wet season VWM concentrations significantly higher compared to other ionic species, as well as higher than all-year round VWM concentrations of Na+ and Cl- measured at other South African DEBITS sites in the interior. The average pH of rainwater at this marine site was slightly lower than the pH of unpolluted rainwater, while it is indicated that mainly NO3- contributed to the marginal acidity due to the occasional influence of air masses passing over the Cape Town metropole. It was also indicated that SO42- in rainwater at CPT GAW was entirely associated with marine air mass with no anthropogenic contribution, which is in contrast to the DEBITS sites situated in the South African interior, where anthropogenic SO42- was the major constituent in rainwater. Estimations of source contribution indicated that 94% of the chemical content at CPT GAW can be attributed to the marine source, which signifies that CPT GAW is representative of southern-hemispherical marine air masses.
Valuable conclusions could be drawn from rain samples collected for a region and ecosystem in Southern Africa, for which no precipitation chemistry has been reported. The significance of the influence of anthropogenic activities on precipitation chemistry in the South African interior is also highlighted by the rainwater chemistry for a clean marine background site. It is recommended that future precipitation chemistry studies should include more sites representative of different regions and ecosystems in Southern Africa, while precipitation collection should continue at the current South African DEBITS sites in order to reflect changes in source contributions and meteorology.
Acknowledgements
The authors wish to thank the International Global Atmospheric Chemistry programme for endorsing the DEBITS programme. The authors also thank the Atmospheric Research in Southern Africa and Indian Ocean (ARSAIO) programme established by the National Centre for Scientific Research (CNRS) in France, and the National Research Foundation (NRF) in South Africa for their support.
References
Ayers, G. P. & Ivey, J. P. 1988. Precipitation composition at Cape Grim, 1977-1985. Tellus. Series B: Chemical and Physical Meteorology, 40B, 297-307. [ Links ]
Brunke, E. G., Labuschagne, C., Ebinghaus, R., Kock, H. H. & Slemr, F. 2010. Gaseous elemental mercury depletion events observed at Cape Point during 2007-2008. Atmospheric Chemistry and Physics, 10, 1121-1131. [ Links ]
Brunke, E. G., Labuschagne, C., Parker, B., Scheel, H. E. & Whittlestone, S. 2004. Baseline air mass selection at Cape Point, South Africa: application of 222Rn and other filter criteria to CO2. Atmospheric Environment, 38, 5693-5702. [ Links ]
Chao, C. Y. & Wong, K. K. 2002. Residential indoor PM10 and PM2.5 in Hong Kong and the elemental composition. Atmospheric Environment, 36, 13. [ Links ]
Conradie, E. H., Van Zyl, P. G., Pienaar, J. J., Beukes, J. P., Galy-Lacaux, C., Venter, A. D. & Mkhatshwa, G. V. 2016. The chemical composition and fluxes of atmospheric wet deposition at four sites in South Africa. Atmospheric Environment, 146, 113-131. [ Links ]
Draxler, R. R. & Hess, G. D. 2004. Description of the HYSPLIT_4 modelling system. In: NOAA (ed.) Technical Memorandum. 7th ed. Silver Spring, Maryland: ERL ARL. [ Links ]
Duce, R. A., Galloway, J. N. & Liss, P. S. 2009. The impacts of atmospheric deposition to the ocean on marine ecosystems and climate'. WMO Bulletin 58. [ Links ]
Eby, G. N. 2004. Principles of environmental geochemistry, Australia; Pacific Grove, CA: Thomson-Brooks/Cole, c2004. [ Links ]
Galy-Lacaux, C., Laouali, D., Descroix, L., Gobron, N. & Liousse, C. 2009. Long term precipitation chemistry and wet deposition in a remote dry savanna site in Africa (Niger). Atmospheric Chemistry & Physics, 9, 1579 - 1595. [ Links ]
Helas, G. & Pienaar, J. J. 1996. Chapter 3: "Biomass Burning Emissions. In: Held, G., Gore, B. J., Surridge, A. D., Tosen, G. R., Turner, C. R. & Walmsley, R. D. (eds.) Air Pollution and its Impacts on the South African Highveld. Cleveland: Environmental Scientific Association. [ Links ]
Josipovic, M., Annegarn, H. J., Kneen, M. A., Pienaar, J. J. & Piketh, S. J. 2011. Atmospheric dry and wet deposition of sulphur and nitrogen species and assessment of critical loads of acidic deposition exceedance in South Africa. South African Journal Science, 107, 10. [ Links ]
Keene, W. C., Pszenny, A. A., Galloway, J. N. & Hawley, M. E. 1986. Sea-salt corrections and interpretation of constituent ratios in marine precipitation. Journal of Geophysical Research, 91, 12. [ Links ]
Kok, L., Van Zyl, P. G., Beukes, J. P., Swartz, J.-S., Burger, R. P., Ellis, S., Josipov, M., Vakkari, V., Laakso, L. & Kulmala, M. 2021. Chemical composition of rain at a regional site on the South African Highveld. Water SA, 47, 12. [ Links ]
Labuschagne, C., Kuyper, B., Brunke, E.-G., Mokolo, T., Van Der Spuy, D., Martin, L., Mbambalala, E., Parker, B., Khan, M. A. H., Davies-Coleman, M. T., Shallcross, D. E. & Joubert, W. 2018. A review of four decades of atmospheric trace gas measurements at Cape Point, South Africa. Transactions of the Royal Society of South Africa, 73, 113-132. [ Links ]
Lacaux, J. P., Tathy, J. P. & Sigha, L. 2003. Acid wet deposition in the tropics: Two case studies using DEBITS measurements. [ Links ]
IGACtivities Newsletter of the International Global Atmospheric Chemistry Project. [ Links ]
Laouali, D., Galy-Lacaux, C., Diop, B., Delon, C., Orange, D., Lacaux, J. P., Akpo, A., Lavenu, F., Gardrat, E. & Castera, P. 2012. Long term monitoring of the chemical composition of precipitation and wet deposition fluxes over three Sahelian savannas. Atmospheric Environment, 50, 314-327. [ Links ]
Mphepya, J. N., Galy-Lacaux, C., Lacaux, J. P., Held, G. & Pienaar, J. J. 2006. Precipitation Chemistry and Wet Deposition in Kruger National Park, South Africa. Journal of Atmospheric Chemistry, 53, 169-183. [ Links ]
Mphepya, J. N., Pienaar, J. J., Galy-Lacaux, C., Held, G. & Turner, C. R. 2004. Precipitation Chemistry in Semi-Arid Areas of Southern Africa: A Case Study of a Rural and an Industrial Site. Journal of Atmospheric Chemistry, 47, 24. [ Links ]
Possanzini, M., Buttini, P. & Di Palo, V. 1988. Characterization of a rural area in terms of dry and wet deposition. Science of the Total Environment, 74, 10. [ Links ]
QA/SAC - Americas. 2018. Lab Intercomparison Study Data [Online]. Available: http://www.qasac-americas.org/ringdiagram [Accessed 18 January 2019]. [ Links ]
Quiterio, S. L., Da Silva, C. R. S., Arbilla, G. & Escaleira, V. 2004. Metals in airborne particulate matter in the industrial district of Santa Cruz, Rio de Janeiro, in an annual period. Atmospheric Environment, 32, 11. [ Links ]
Sheskin, D.J. 2003. Handbook of parametric and nonparametric statistical procedures. 3rd ed. Chapman and Hall/CRC Press, Boca Raton, 1193. [ Links ]
Swartz, J.-S., Van Zyl Pieter, G., Beukes Johan, P., Labuschagne, C., Brunke, E.-G., Portafaix, T., Galy-Lacaux, C. & Pienaar Jacobus, J. 2020. Twenty-one years of passive sampling monitoring of SO2, NO2 and O3 at the Cape Point GAW station, South Africa. Atmospheric Environment, 222, 117128. [ Links ]
UNESCO. 2015. Cape Floral Region Protected Areas [Online]. Available: http://whc.unesco.org/en/list/1007/ [Accessed 20 June 2017]. [ Links ]
Vet, R., Artz, R. S., Carou, S., Shaw, M., Ro, C.-U., Aas, W., Baker, A., Bowersox, V. C., Dentener, F., Galy-Lacaux, C., Hou, A., Pienaar, J. J., Gillett, R., Forti, M. C., Gromov, S., Hara, H., Khodzher, T., Mahowald, N. M., Nickovic, S., Rao, P. S. P. & Reid, N. W. 2014. A global assessment of precipitation chemistry and deposition of sulfur, nitrogen, sea salt, base cations, organic acids, acidity and pH, and phosphorus. Atmospheric Environment, 93, 3-100. [ Links ]
Waldman, K. E., Munger, W. J. & Jacob, D. J. 1992. Measurement methods for atmospheric acidity and acid deposition. In: Radojevic, M. & Harrison, R. M. (eds.) Atmospheric acidity: Sources, consequences and abatement. New York: Elsevier. [ Links ]
WMO 2004. WMO/GAW report no. 160, Manual for the GAW precipitation chemistry programme, WMO TD No. 1251. [ Links ]
 Correspondence:
PG van Zyl
Pieter.VanZyl@nwu.ac.za
Received: 2 December 2021
Reviewed: 24 January 2022
Accepted: 19 May 2022

