


Services on Demand
Article
 English (pdf)
 Article in xml format
 Article references
Indicators

Related links
-
 Cited by Google
 -
 Similars in Google
Share

 Permalink
Clean Air Journal
On-line version ISSN 2410-972X
Print version ISSN 1017-1703
Clean Air J. vol.32 n.1 Pretoria 2022
http://dx.doi.org/10.17159/caj/2022/32/1.10906
RESEARCH ARTICLE
Exploring PM2.5 variations from calibrated low-cost sensor network in Greater Kampala, during COVID-19 imposed lockdown restrictions: Lessons for Policy
Paul Green; Deo Okure; Priscilla Adong; Richard Sserunjogi; Engineer Bainomugisha
AirQo, Department of Computer Science, College of Computing and Information Sciences, Makerere University, Kampala, Uganda
ABSTRACT
Air pollution is considered a major public health risk globally, and the global South including sub-Saharan Africa face particular health risks, but there is limited data to quantify the level of pollution for different air quality contexts. The COVID-19 lockdown measures led to reduced human activities, and provided a unique opportunity to explore the impacts of reduced activities on urban air quality. This paper utilises calibrated data from a low-cost sensor network to explore insights from the diverse ambient air quality profile for four urban locations in Greater Kampala, Uganda before and during lockdown from March 31 to May 5 2020, highlighting the uniqueness of air pollution profiles in a sub-Saran Africa context. All locations saw year to year improvements in 24-hour mean PM2.5 between 9 and 25μg/m3 (i.e. 17-50% reduction from the previous year) and correlated well with reduction in traffic (up to approx. 80%) and commercial activities. The greatest improvement was observed in locations close to major transport routes in densely populated residential areas between 8 pm and 5 am. This suggests that the reduction in localised pollution sources such as nocturnal polluting activities including traffic and outdoor combustion including street cooking characteristic of fast-growing cities in developing countries, coupled with meteorological effects led to amplified reductions that continued well into the night, although meteorological effects are more generalised. Blanket policy initiatives targeting peak pollution hours could be adopted across all locations, while transport sector regulation could be very effective for pollution management. Likewise, because of the clustered and diffuse nature of pollution, community driven initiatives could be feasible for long-term mitigation.
Keywords: Ambient air quality, COVID-19, Low-cost sensors, Urban air quality, sub-Saharan Africa
Introduction
Air pollution is now considered one of the major public health risk factors for global morbidity and mortality, primarily associated with increased risk of respiratory illnesses, heart diseases, and there are growing links to mental health and cognitive impairment (Seaton et al. 1995; Brunekreef and Holgate 2002; Cohen et al. 2017; Pope III and Dockery 2006; Chen and Schwartz 2009; Xue et al. 2019). According to the World Health Organisation (WHO), more than 90% of the population in monitored urban centres worldwide are exposed to air pollution above WHO Air Quality Guideline (AQG) levels (World Health Organisation 2018; 2021). Populations in low- and middle-income countries such as those in sub-Saharan Africa with some of the highest urban population growth rates are among the most at risk of pollution exposure (United Nations 2018). In Africa, the socio-economic costs of air pollution are estimated to be much higher than malnutrition and unsafe sanitation (Roy 2016). Sub-Saharan Africa is home to over 475 million people (Lall, Henderson, and Vernon 2017), and the urban-settings face unique air quality challenges including; diffuse and clustered sources from increasing combustion emissions, increased informal settlements, lack of streamlined and efficient public transport systems, limited environmental regulations and urban planning deficiencies; in part arising from rapid urbanisation. (Petkova et al. 2013; Liousse et al. 2014). In the contemporary policy environment, diffuse pollution sources that often result into localised and clustered impacts present complexities for mitigation as the resulting pollution is from a conflation of activities within an air-shed as opposed to major point source situations. Ultimately, management of diffuse pollution cannot neatly fit within the conventional regulatory framework that allows for source-monitoring and permitting, and so spatio-temporal insights on pollution sources are essential to inform mitigation actions. This is the case for most of today's urban centres especially sub-Saharan Africa where diffuse activities continue to dominate the pollution profile (Liousse et al. 2014; Karagulian et al. 2015), but continuous monitoring datasets exploring different contexts remain extremely inadequate.
In this paper, we explore the impact of major disruptions to the scale of COVID-19 lockdown restrictions on ambient air quality for diverse physical environments within the same analytical unit/airshed considered. We hypothesize that the diversity and variations in the pollution profile in Greater Kampala, a typical sub-Saharan African context can provide unique insights not usually experienced in other geographic contexts during a major disruption, thus having important policy implications. The wide measure of variations in the restrictions adopted and implemented by different countries would equally be instructive in presenting each geographic context as a potential case study.
COVID-19 lockdown and air quality
There is growing body of literature on the relationship between air pollution and the COVID-19 pandemic. Evidence from recent preliminary studies suggests that exposure to high levels of particulate matter and fossil-related air pollution increases the risk of contracting COVID-19 and eventually mortality. Firstly, by raising the susceptibility of individuals by weakening lung function and secondly by particles providing a transmission mechanism for the spread of the coronavirus (Wu et al. 2020; Setti, Passarini, De Gennaro, Baribieri, et al. 2020; Setti, Passarini, De Gennaro, Barbieri, et al. 2020; Luigi Sanita di Toppi, Lorenzo Sanita di Toppi, and Bellini 2020; Travaglio et al. 2020), etc. Although still emerging, these linkages re-emphasise air pollution as an important public health risk. Since the WHO declared the pandemic on 12 March 2020, many countries introduced restrictions on mobility, social interactions and economic activities to contain the spread of the coronavirus and reduce the burden on health systems. The containment measures will undoubtedly have significant immediate and long-term impacts on the national and global economy, some of which are already being felt (Kabir et al. 2020; Nicola et al. 2020; Atkeson 2020; Baldwin and Tomiura 2020).
In almost equal measure, the restrictive measures have also had unintended consequences on the atmospheric environment including ambient air quality. Several specific case studies utilising data from satellite observations and ground station monitors have already been presented (Dantas et al. 2020; Mahato, Pal, and Ghosh 2020; Tobías et al. 2020). These studies indicate distinctive variations but largely significant reductions in air pollution in a range of environments. Susanta et al. (2020) conducted an analysis on the impact of air pollution during the lockdown period for New Delhi, India. The study shows an improvement in air quality by about 50% Nitrogen dioxide (NO2), 30% Carbon monoxide (CO), and 50% particulate matter (PM2.5 and PM10) compared to the days immediately before (Mahato, Pal, and Ghosh 2020). A study in Barcelona, Spain showed a reduction of 45-51% for NO2 and Black Carbon, 2831% for PM10, and an increase of 33-57% for Ozone (O3) during the lockdown period (Tobías et al. 2020). Venter et al. (2020) found reduction of 60% and 31% for NO2 and PM25 respectively for population weighted concentrations with a 95% Confidence Interval. There are also several other studies that explored changes in air pollution for different locations worldwide (He, Pan, and Tanaka 2020; Venter et al. 2020; Ju, Oh, and Choi 2021; Mostafa, Gamal, and Wafiq 2021). However, to the best of our knowledge, a few studies (McFarlane et al. 2021) have published research investigating the impact of the COVID-19 lockdown on air pollution in urban sub-Saharan Africa while exploring the implications for air pollution mitigation. This is partly because ground monitoring remains extremely limited in Africa (Petkova et al. 2013; Liousse et al. 2014; World Health Organisation 2016) due to the prohibitive costs of establishing and maintaining traditional air monitoring networks that lead to sparse distribution of monitoring networks in resource-strained environments.
Improvements in low-cost air quality sensing technologies provide opportunities to characterise and measure air quality at micro-level and at a higher resolution, difficult to achieve with expensive grade reference monitors alone (Castell et al. 2017; Morawska et al. 2018; EPA 2020b; EPA 2020a). This approach is particularly important for low- and middle-income countries where the cost of monitoring remains a major inhibitor for air quality control and management programs. This paper leverages advances in low-cost measurement technologies to explore and quantify the variations in particulate matter (PM2.5), a common measure of ambient air quality (Pope III and Dockery 2006; R. T. Burnett et al. 2014; World Health Organisation 2016), for selected diverse urban locations in Greater Kampala, Uganda, with regard to the lockdown restrictions, while discussing implications for air quality management.
Materials and methods
COVID-19 lockdown timelines in Uganda
The first case of COVID-19 in Uganda was recorded on March 22 2020, by May 15, Uganda had registered 203 cases. On March 18, the President announced the first measures to curb the spread of COVID-19. This began with the closure of schools and universities and suspension of public gatherings.
On March 21, borders were closed and all incoming and outgoing passenger aircraft and vehicles were prohibited. This was followed by suspension of all forms of public transport on March 25. On March 30 movement for all public and private vehicles with exception of cargo delivery and authorised essential activities was prohibited. Businesses were closed and outdoor movement was restricted to 06:30 to 19:001. For the purposes of this paper, we define the period beginning March 31 2020 through to the end of the second extension on May 5 2020 as the 'lockdown period'.
Measurement of air quality
PM2.5 measurements were obtained from a network of low-cost sensors deployed across Greater Kampala (Figure 1), operated and managed by AirQo (www.airqo.africa) (AirQo 2020; Coker et al. 2021). Each AirQo device uses twin Plantower (PMS 5003) light scattering sensors and transmit averaged measurements every 90 seconds (for static installations) via local Global System for Mobile Communications (GSM) network to a cloud-based platform. The devices have a measurement range of 0-500μg/m3 for both PM2.5 and PM10 and are optimised to run on solar energy or mains to cater for limited power availability, typical of urban settings in Sub-Saharan Africa.
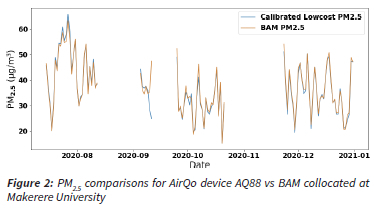
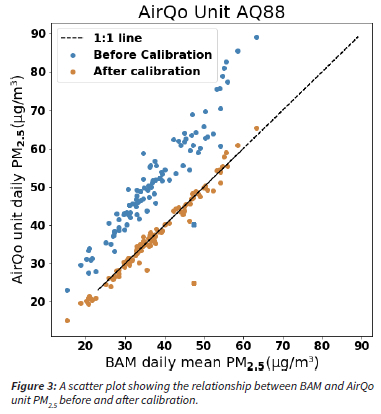
As part of data quality assurance, AirQo devices are collocated with a Met One Beta Attenuation Monitor (BAM 1022) Federal Reference Monitor approved to international standards and generally correlate well against the BAM with correlation coefficient (R) of more than 0.9. The collocation data is used to develop a calibration model that translates PM concentrations from AirQo devices to BAM equivalent. In this paper, we applied random model trained with data from an AirQo to BAM collocation site at Makerere University (coordinates: 0.333534, 32.568644) from 15th July 2020 to 23rd March 2021. Employing the calibration model increased BAM to low-cost correlation (R) and (R2) values from 0.9 to 0.95 and 0.49 to 0.9 respectively; and decreased RMSE and MAE from 19.11μg/m3 to 8.2 μg/m3 and 14.99 μg/m3 to 5.1 μg/m3 respectively.
Figure 2 and 3 illustrate the comparison between calibrated PM2.5 values from AirQo devices collocated with the BAM at Makerere University between July and December 2020. It can be seen that calibrated output from the low-cost sensors follow a similar trend with the BAM with slight upward and downward shifts, with R = 0.97 for AQ882. AQ88. This is relatively comparable to other Plantower sensor evaluation studies (Kelly et al. 2017; Levy Zamora et al. 2018; Mukherjee et al. 2019; Liu et al. 2020) and gives a degree of confidence in the ability of the low-cost network to provide reliable insights on the spatio-temporal variations within a given study area.
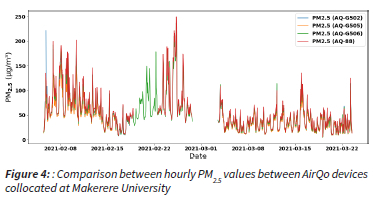
We emphasise that data from AirQo to AirQo correlate strongly with both mean correlation coefficient of R2 = 0.98 for four AirQo units collocated at Makerere university tween 15th July 2020 to 23rd March 2021 (see Figure 4).
Implicitly, we consider calibration model trained using field collocation datasets from one AirQo monitor to be largely applicable other AirQo monitors deployed within similar physical environmental setting and context. We therefore use the calibration model developed from collocation with the reference monitor at Makerere University to correct PM2.5 concentrations from all devises used in this study. This data correction approach is not unique to this study and has previously been adapted for low-cost datasets from different settings e.g. Barkjohn et al. (2021), and McFarlane et al. ( 2021).
Study location (context)
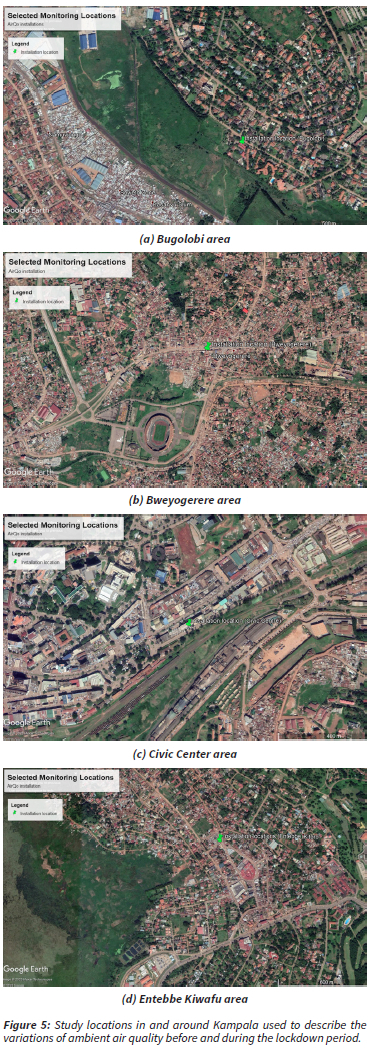
The study area includes four sites, within the Greater Kampala Metropolitan Area (GKMA), Uganda (Figures 5 and 6), furthest point about 45 km apart.
Kampala City is the economic capital and administrative centre of Uganda with a resident population of over 1.5 million and an additional daytime transient population of over 2.5 million (Uganda Bureau of Statistics 2016; World Bank 2018).
GKMA has the highest population density in the country and hosts over 32% of manufacturing businesses, contributes more than one-third of the annual GDP, and ultimately hosts the greatest concentration of pollution generating activities in Uganda (Uganda Bureau of Statistics (UBOS) 2011; Uganda Bureau of Statistics 2016; World Bank 2018). Like many sub-Saharan African cities, Kampala is urbanising fast with one of the highest urban population growth rates in the world at about 5.6% (United Nations 2018; Vermeiren et al. 2012), leading to increased demand for resources and social services, and subsequently increased alterations of the natural environment.
Consequently, a large proportion of the population within GKMA live and work near pollution sources. The prevailing urban planning shortfalls have precipitated the growth of saturated informal settlement clusters (Richmond, Myers, and Namuli 2018) often intertwined with formal settlements and local pollution generating activities. In essence, local pollution levels tend to be largely influenced by the usually diverse and diffuse surrounding pollution generating activities coupled with the nature of settlements resulting into largely localised impacts (Okure et al. 2022). However, the unique variations in the air pollution profile is typical for many fast-growing urban areas in sub-Saharan Africa where pollution is dominated by multiple diffused sources (Marais and Wiedinmyer 2016; Pfotenhauer et al. 2019).
Table 1 shows the Greater Kampala pollution variations (clustered airsheds) using the sensor correlation matrix for 13 monitoring locations over a 6-month period, with an average correlation of 0.581, a function of the distance between the sensors and actual pollution levels in the monitoring locations/ intensity of immediate local sources. This socio-economic context suggests that the consequences of the disrupted socioeconomic interactions with the ambient environment due to the lockdown restrictions will be more significant in this region, also consistent with novel findings on pollution progression and urbanisation (Mage et al. 1996). While in-depth investigation of the sensor variations highlighted in Table 1 is beyond the scope of this paper, we find that it reinforces the need for exploring air quality dynamics in a metropolitan city. Air quality insights from Greater Kampala during such an unprecedented circumstance would provide a rare opportunity for exploring mitigation policy insights for a sub-Saharan African setting.
In order to capture a cross section of the GKMA urban environment, we used parish level population distribution, observed satellite imagery from Google earth, knowledge of local context and availability of data for the 211 period of interest to identify four monitoring locations based on land use clusters i.e., residential/urban background and urban/traffic typically characteristic of land uses within the greater Kampala. This is also informed by the known pollution dynamics for various land uses (Harrison and Deacon 1998; Spangl et al. 2007; Alsahli and Al-Harbi 2018).
Inherently, diverse pollution profile would make it difficult to identify homogeneous land use clusters, which in theory, could introduce an analytical uncertainty. However, we attempted to obtain a fair spatial representation of the idealised location clustering which should provide spatially representative reference insights for the respective land uses taking into consideration that particulate matter is not always entirely constrained to immediate local sources like gaseous pollutants e.g. NO2, and CO (Khuzestani et al. 2017), this does not present any significant limitations.
The locations represent a balance between densely and less populated areas with a wide measure of variations in pollution levels. The respective physical and demographic profiles for attributes with direct impact on local air pollution are presented in Table 2.
Results and discussion
Daily PM2.5 levels
Figure 7 shows that for all locations there is substantial variation in daily mean PM2.5 across the year. The blue section of the chart captures the lockdown period which records some of the lowest readings of the year for all locations. The cycles observed above vary in line with seasons with the two wet seasons (March-May/ September-November) experiencing the lowest PM2.5 levels. This corresponds to the influence of precipitation and unstable weather conditions on particulate suppression and decay (Chow et al. 1999; Yan et al. 2016).
Overall, Bweyogerere area which has greater population density, proximity to industries, with a major road network, and multiple diffuse sources, observes typically higher PM2.5. Unsurprisingly, Kiwafu Ward in the smaller town of Entebbe with no major through-roads, less households using charcoal/ firewood coupled with limited industrial and commercial activities experiences much lower levels. This suggests that both location-specific and meteorological factors impact on observed air quality during lockdown, with meteorological being more generalised (Cole and Neumayer 2004).
To establish the extent to which improvements in air quality coincide with lockdown measures, levels during lockdown are compared with wet season means for 2019, and the mean for the lockdown equivalent period in the previous year.
The results are as shown in Figure 8 with the bars representing the estimated differences in PM2.5 between the two periods. Bweyogerere shows the greatest observed reduction in PM2.5 at approximately 25μg/m3 or 50% lower than seasonal and the previous year means. Other locations saw reductions of around 9-15μg/m3. This is an indication that meteorology is not sufficient to explain the lower PM2.5 levels during the lockdown period, but at the same time highlights the clustered nature of the pollution reduction. Modelling the meteorological impact on daily levels could provide precise estimates on the meteorological influence.
To further explore the extent of the impact of lockdown restrictions on the different physical environments, we used a working assumption that the impact of socio-economic factors i.e. population density, household energy use, will remain relatively constant during the lockdown period and possibly increase as people spend more time, cook and eat more at home than would normally be the case. We utilised data from the most recent census (Uganda Bureau of Statistics 2016) to obtain context for each of the land use areas. Bweyogerere, the most densely populated and probably the largest domestic emitter again experienced the greatest reduction in PM2.5. Other parishes, from the densely populated Kiwafu Ward to the largely resident free Civic Centre experience comparable reductions. These insights provide little indication to suggest that the probable changes have led to a decrease in PM2.5 that outweighs any benefits from other lockdown measures.
Localised influence of traffic activity
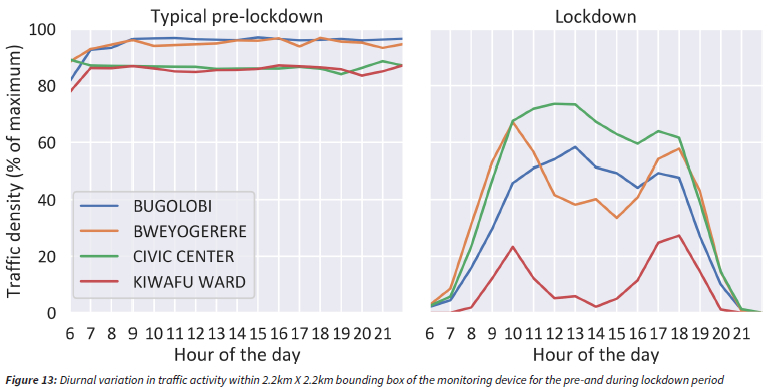
Because of the prohibitive logistical implications of conducting traffic counts; we employed Google Maps Traffic App that utilises smartphone data with activated location features, and recorded in motion to capture proxy data. 'Typical' traffic data was captured for day of the week between 6 am and 10 pm (the times available from Google Maps) for each location prior to lockdown. Hourly data from coloured pixels was collected throughout the lockdown period. Figure 9 demonstrates an example of the difference in activity after curfew, before and during lockdown. Figure 10 shows the level of traffic activity for each location at lock down levels compared to typical. Kiwafu Ward shows the greatest reduction in traffic activity with levels below 20% (about 80% reduction) of typical.
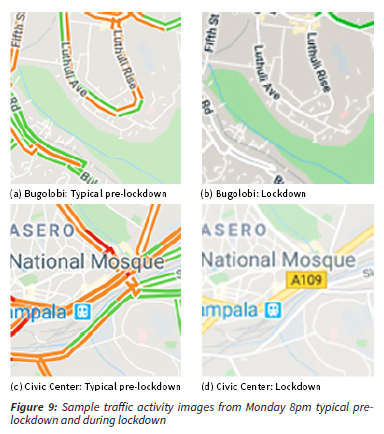
Access to the international airport and recreation are the main reasons for visiting the town and these options were no longer possible. Other locations show much higher activity, in the range of 20 to 40% of normal in the first two weeks of lockdown but rising to between 40 and 60% of normal in the second two weeks with Civic Centre as the most active.
These locations, while varying in population density, remain on or close to major commercial through-routes across the city and so see higher sustained traffic volumes.
While Bugolobi has low population density and is beside wetland, it lies downwind from an informal settlement, an industrial area and a congested road which may explain higher activity rates.
Explanations for the increase over time may include; businesses adapting to the changing environment by investing in permissible transport such as motorcycles, home delivery services or increased mobility for essential workers and emergencies. This upward trend is not observed in daily PM25 changes which are influenced more by daily weather variations. In summary, while the season of the year explains some of the improvement in daily air quality during the lockdown period, influence of lockdown restrictions appear to have been very significant. More detailed modelling of weather and pollution transport be required to identify the relationship between these features more precisely, while considering other emission parameters such as NO2 (Mage et al. 1996; Watson and Chow 2002).
Diurnal variation
In Figure 11 we explore the difference between diurnal PM2.5 levels during the lockdown period and the equivalent period in 2019. We observe that all locations carry the characteristic sinusoidal profile. A characteristic feature for pollution dispersion is the Boundary Layer Effect (BLE) (Ding et al. 2005) which creates the U-shape curve observed during daylight hours. As the sun rises around 7am, the ground warms due to radiation. This warms the air which rises lifting particulate matter with it creating turbulent ambient conditions. Pollution is now dispersed over a much greater vertical height and exposure levels reduce, being at their lowest mid-afternoon. During the evening conditions, cooler air is compressed into a smaller vertical space leading to higher concentrations during the night. These diurnal patterns are not unique to this study and have been replicated in other geographic settings (Chow et al. 1999; DeGaetano and Doherty 2004; Chen, Tang, and Zhao 2015), with levels dependent on location-specific activity patterns.
During the 2020 lockdown, mean PM2.5 levels are consistently below the 2019 equivalent period. The morning and evening peaks are levelled out by reduced activity. We can see that while pre-lockdown levels (averagely) are always at or above new WHO daily AQG levels of 15μg/m3 (World Health Organisation 2021), lockdown levels only exceed the threshold if only peak times are considered.
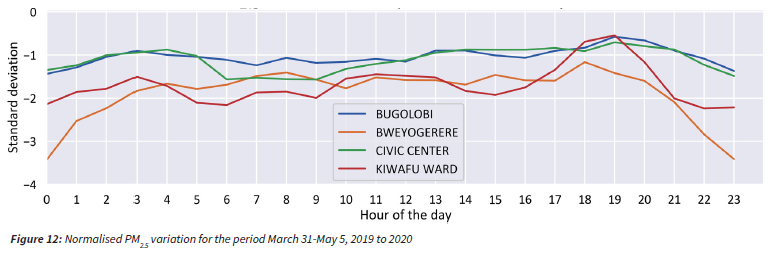
Investigating the difference further, Figure 12 shows the variation in mean hourly PM25 values during the lockdown period compared with the normalised values for the equivalent dates in 2019. All locations show a variation of greater than or equal to one standard deviation below equivalent period in the prior year. Similarly, all locations show a modest peak around 7 pm when levels are closest to prior year mean. Greater reductions are seen after 7 pm and continuing through until 3-5 am. This is in line with a substantial decrease in activity during the hours of curfew (7 pm-6:30 am). There is also variation between Civic Centre and Bugolobi, and Bweyogerere and Kiwafu with the latter pair seeing much greater reductions during the day and especially during night time. This difference can be explained by reduction in evening activity to be explored below, but also reinforced by the BLE which usually traps evening particulate matter close to the ground level, where it remains, reducing only slowly throughout the night. This is especially harmful for those living in open homes and in cities such as Kampala where polluting activity continues into the night.
As mentioned above we are assuming that cooking and waste burning activities remain the same or increase during the lockdown. Air quality improved at every stage of the day during lockdown and follows a similar pattern for all locations especially in the evening after curfew. It appears changes in domestic emissions are not a significant factor in explaining these observed patterns.
On traffic activity, the contrast between the typical and lockdown periods in figure 13 is striking. Typical levels show traffic activity at well above 80 percent of full activity at all times between 6 am and 10 pm. Under lockdown however there is very clear evidence that the curfew is being observed for all locations. All locations only begin to increase activity from 7 am. Civic Centre and Bugolobi locations continue to increase before falling steadily until 7 pm and then dropping sharply. For Bweyogerere and Kiwafu however, traffic activity drops away sharply at 10 am, remaining low through the day, before rising to a second peak at 6 pm and dropping away more sharply than others before curfew. This pattern of lower activity in Bweyogerere and Kiwafu is consistent with the lower PM2.5 levels seen in Figure 12.
One possible explanation for why Kiwafu and Bweyogerere experience a greater drop after curfew is that being densely populated, lower income residential areas close to major roads they experience high levels of night-time combustion activities, typically charcoal and waste. Under lockdown scenario, traffic is reduced, but also polluting activities moves away from the main roads (and away from our sensors) possibly into homes. In the more affluent Bugolobi and the non-residential Civic Centre, only the traffic reduction which is already typically lighter in the evening is seen and limited outdoor combustion and reliance on street food much lower.
In summary, diurnal variation is largely explained by meteorological factors. Adjusting for this we observe that reduced traffic activity during the day leads to general reduction of 1 standard deviation across all regions, the greatest improvement comes at night for locations on major roads close to dense residential areas with heavy traffic and where outdoor combustion and street cooking is known to be prevalent. These findings indicate that policy initiatives that regulate transport activities would lead to immediate improvement on ambient air quality.
Conclusion and policy recommendations
This study explored the impact of COVID-19 lockdown restrictions on diverse air quality profiles for four distinctive locations in the Greater Kampala region of Uganda. We identify a reduction in PM2.5 of between 17 and 50% compared with the same period in 2019 with the greatest increase coming in densely populated areas close to major roads. Investigation into diurnal variation reveals a broadly consistent improvement for all locations at all times. The greatest reductions occurred after the 7pm curfew and again, mostly in densely populated areas close to major roads. Implicitly, blanket policy interventions that target peak pollution periods could be proportionately adopted across the study area. Assuming that domestic fuel use is unlikely to have decreased, we identify traffic density, and street cooking and outdoor combustion as likely sources of the reduction. Policy initiatives in the transport sector such as vehicle emissions controls, traffic management, mass transit systems and pedestrianisation, in addition to regulation of outdoor open burning should be adopted to reduce the impact on air quality. Similarly, exploring the prospects of community driven initiatives could be essential to tackling diffuse and clustered pollution sources.
CRediT authorship contribution statement
Engineer Bainomugisha: supervision, conceptualization, review and editing. Paul Green: project administration, formal analysis, writing-original draft. Deo Okure: methodology, writing-original draft, writing-review and editing. Priscilla Adong: data curation, calibration, visualisation. Richard Sserunjogi: software, calibration, visualisation.
Declaration of competing interest
Authors declare no known competing financial and/or personal interests that could influence the findings of the paper.
Acknowledgements
This work was supported by the Systems Approach to Air Pollution -East Africa (ASAP-East Africa) project, the United Kingdom Research and Innovation (UKRI) and the Global Challenges Research Fund (GCRF), the World Bank, Google.org, the NRF and SwedBio.
References
AirQo (2020). AirQo, Africa's Air Quality Network. Available at https://www.airqo.africa (Accessed May 15, 2020). [ Links ]
Alsahli, Mohammad M and Meshari Al-Harbi (2018). "Allocating optimum sites for air quality monitoring stations using GIS suitability analysis". In: Urban Climate 24, pp. 875-886. doi: https://doi.org/10.1016/j.uclim.2017.11.001. [ Links ]
Atkeson, Andrew (2020). What Will Be the Economic Impact of COVID-19 in the US? Rough Estimates of Disease Scenarios. Working Paper 26867. National Bureau of Economic Research. doi: 10.3386/w26867. url: http://www.nber.org/papers/w26867. [ Links ]
Baldwin, Richard and Eiichi Tomiura (2020). "Thinking ahead about the trade impact of COVID-19". In: Economics in the Time of COVID-19. 59(2020). [ Links ]
Barkjohn, Karoline K, Brett Gantt, and Andrea L Clements (2021). "Development and application of a United States-wide correction for PM25 data collected with the PurpleAir sensor". In: Atmospheric Measurement Techniques 14.6, pp. 4617-4637. doi: 10.5194/amt-14-4617-2021. [ Links ]
Brunekreef, Bert and Stephen T Holgate (2002). "Air pollution and health". In: The Lancet 360.9341, pp. 1233-1242. doi: https://doi.org/10.1016/S0140-6736(02)11274-8. [ Links ]
Burnett, Richard T et al. (2014). "An integrated risk function for estimating the global burden of disease attributable to ambient fine particulate matter exposure". In: Environmental Health Perspectives 122.4, pp. 397-403. doi: https://doi.org/10.1289/ehp.1307049. [ Links ]
Castell, Nuria et al. (2017). "Can commercial low-cost sensor platforms contribute to air quality monitoring and exposure estimates?" In: Environment International 99, pp. 293-302. doi: https://doi.org/10.1016/j.envint.2016.12.007. [ Links ]
Chen, Jiu-Chiuan and Joel Schwartz (2009). "Neurobehavioral effects of ambient air pollution on cognitive performance in US adults". In: Neurotoxicology 30.2, pp. 231-239. doi: https://doi.org/10.1016/j.neuro.2008.12.011. [ Links ]
Chen, Wei, Hongzhao Tang, and Haimeng Zhao (2015). "Diurnal, weekly and monthly spatial variations of air pollutants and air quality of Beijing". In: Atmospheric Environment 119, pp. 21-34. doi: 10.1016/j.atmosenv.2015.08.040. [ Links ]
Chow, Judith C. et al. (1999). "Temporal Variations of PM2.5, PM10, and Gaseous Precursors during the 1995 Integrated Monitoring Study in Central California". In: Journal of the Air & Waste Management Association 49.9, pp. 16-24. doi: 10.1080/10473289.1999.10463909. [ Links ]
Cohen, Aaron J et al. (2017). "Estimates and 25-year trends of the global burden of disease attributable to ambient air pollution: an analysis of data from the Global Burden of Diseases Study 2015". In: The Lancet 389.10082, pp. 1907-1918. doi: https://doi.org/10.1016/S0140-6736(17)30505-6. [ Links ]
Coker, Eric S et al. (2021). "A Land Use Regression Model using Machine Learning and Locally Developed Low Cost Particulate Matter Sensors in Uganda". In: Environmental Research, p. 111352. doi: https://doi.org/10.1016/j.envres.2021.111352. [ Links ]
Cole, Matthew and Eric Neumayer (2004). "Examining the Impact of Demographic Factors On Air Pollution". In: Population and Environment. doi: 10.1023/B:POEN.0000039950.85422.eb. [ Links ]
Dantas, Guilherme et al. (2020). "The impact of COVID-19 partial lockdown on the air quality of the city of Rio de Janeiro, Brazil". In: Science of The Total Environment 729, p. 139085. issn: 00489697. doi: https://doi.org/10.1016/j.scitotenv.2020.139085. [ Links ]
DeGaetano, Arthur T. and Owen M. Doherty (2004). "Temporal, spatial and meteorological variations in hourly PM25 concentration extremes in New York City". In: Atmospheric Environment 38.11, pp. 1547-1558. doi: 10.1016/j.atmosenv.2003.12.020. [ Links ]
Ding, GA et al. (2005). "Vertical structures of PM10 and PM2.5 and their dynamical character in low atmosphere in Beijing urban areas". In: Science in China, Series D: Earth Sciences 48, pp. 3854. doi: 10.1360/05yd0031. [ Links ]
EPA (2020a). Aclima Project. Available at https://www.epa.gov/air-research/aclima-fact-sheet (Accessed on April 07, 2020) [ Links ]
EPA (2020b). Village Green Project. Available at https://www.epa.gov/airresearch/village-green project (Accessed on May 14, 2020). [ Links ]
Harrison, RM and AR Deacon (1998). "Spatial correlation of automatic air quality monitoring at urban background sites: implications for network design". In: Environmental Technology 19.2, pp. 121-132. doi: https://doi.org/10.1080/09593331908616664. [ Links ]
He, Guojun, Yuhang Pan, and Takanao Tanaka (2020). "The short-term impacts of COVID-19 lockdown on urban air pollution in China". In: Nature Sustainability 3.12, pp. 1005-1011. doi: https://doi.org/10.1038/s41893-020-0581-y. [ Links ]
Ju, Min Jae, Jaehyun Oh, and Yoon-Hyeong Choi (2021). "Changes in air pollution levels after COVID-19 outbreak in Korea". In: Science of the Total Environment 750, p. 141521. [ Links ]
Kabir, Mahvish et al. (2020). "COVID-19 pandemic and economic cost; impact on forcibly displaced people". In: Travel Medicine and Infectious Disease, p. 101661. issn: 1477-8939. doi: https://doi.org/10.1016/j.tmaid.2020.101661. [ Links ]
Karagulian, Federico et al. (2015). "Contributions to cities' ambient particulate matter (PM): A systematic review of local source contributions at global level". In: Atmospheric Environment 120, pp. 475-483. doi: https://doi.org/10.1016/j.atmosenv.2015.08.087. [ Links ]
Kelly, KE et al. (2017). "Ambient and laboratory evaluation of a low-cost particulate matter sensor". In: Environmental Pollution 221, pp. 491-500. doi: https://doi.org/10.1016/j.envpol.2016.12.039. [ Links ]
Khuzestani, Reza Bashiri et al. (2017). "Quantification of the sources of long-range transport of PM2.5 pollution in the Ordos region, Inner Mongolia, China". In: Environmental Pollution 229, pp. 1019-1031. doi: https://doi.org/10.1016/j.envpol.2017.07.093. [ Links ]
Lall, Somik Vinay, Henderson, and J. Vernon (2017). Africa's Cities: Opening Doors to the World. http://hdl.handle.net/10986/25896. Washington, DC: World Bank. isbn: 978-1-4648-1045-9. doi: 10.1596/978-1-4648-1044-2. [ Links ]
Levy Zamora, Misti et al. (2018). "Field and laboratory evaluations of the low-cost plantower particulate matter sensor". In: Environmental Science & Technology 53.2, pp. 838-849. doi: https://doi.org/10.1021/acs.est.8b05174. [ Links ]
Liousse, Catherine et al. (2014). "Explosive growth in African combustion emissions from 2005 to 2030". In: Environmental Research Letters 9.3, p. 035003. doi: https://doi.org/10.1088/1748-9326/9/3/035003. [ Links ]
Liu, Xiaoting et al. (2020). "Low-cost sensors as an alternative for long-term air quality monitoring". In: Environmental Research 185, p. 109438. doi: https://doi.org/10.1016/j.envres.2020.109438. [ Links ]
Mage, David et al. (1996). "Urban air pollution in megacities of the world". In: Atmospheric Environment 30.5, pp. 681-686. doi: https://doi.org/10.1016/1352-2310(95)00219-7. [ Links ]
Mahato, Susanta, Swades Pal, and Krishna Gopal Ghosh (2020). "Effect of lockdown amid COVID-19 pandemic on air quality of the megacity Delhi, India". In: Science of The Total Environment 730, p. 139086. issn: 0048-9697. doi: https://doi.org/10.1016/j.scitotenv.2020.139086. [ Links ]
Marais, Eloise A and Christine Wiedinmyer (2016). "Air quality impact of diffuse and inefficient combustion emissions in Africa (DICE-Africa)". In: Environmental Science & Technology 50.19, pp. 10739-10745. doi: https://doi.org/10.1021/acs.est.6b02602. [ Links ]
McFarlane, Celeste et al. (2021). "First Measurements of Ambient PM2.5 in Kinshasa, Democratic Republic of Congo and Brazzaville, Republic of Congo Using Field-calibrated Low-cost Sensors". In: Aerosol and Air Quality Research 21, pp. 200619-200619. doi: https://doi.org/10.4209/aaqr.200619. [ Links ]
Morawska, Lidia et al. (2018). "Applications of low-cost sensing technologies for air quality monitoring and exposure assessment: How far have they gone?" In: Environment International 116, pp. 286-299. doi: https://doi.org/10.1016/j.envint.2018.04.018. [ Links ]
Mostafa, Mohamed K, Gamil Gamal, and A Wafiq (2021). "The impact of COVID 19 on air pollution levels and other environmental indicators-A case study of Egypt". In: Journal of Environmental Management 277, p.111496. doi: https://doi.org/10.1016/j.jenvman.2020.111496. [ Links ]
Mukherjee, Anondo et al. (2019). "Measuring spatial and temporal PM2.5 variations in Sacramento, California, communities using a network of low-cost sensors". In: Sensors 19.21, p. 4701. doi: https://doi.org/10.3390/s19214701. [ Links ]
Nicola, Maria et al. (2020). "The socio-economic implications of the coronavirus pandemic (COVID-19): A review". In: International Journal of Surgery 78, pp. 185-193. issn: 1743-9191. doi: https://doi.org/10.1016/j.ijsu.2020.04.018. [ Links ]
Okure, Deo et al. (2022). "Characterization of Ambient Air Quality in Selected Urban Areas in Uganda Using Low-Cost Sensing and Measurement Technologies". In: Environmental Science & Technology. doi: https://doi.org/10.1021/acs.est.1c01443. [ Links ]
Petkova, Elisaveta P et al. (2013). "Particulate matter pollution in African cities". In: Air Quality, Atmosphere & Health 6.3, pp. 603614. doi: https://doi.org/10.1007/s11869-013-0199-6. [ Links ]
Pfotenhauer, David J et al. (2019). "Updated Emission Factors from Diffuse Combustion Sources in Sub-Saharan Africa and Their Effect on Regional Emission Estimates". In: Environmental Science & Technology 53.11, pp. 6392-6401. doi: https://doi.org/10.1021/acs.est.8b06155. [ Links ]
Pope III, C Arden and Douglas W Dockery (2006). "Health Effects of Fine Particulate Air Pollution: Lines that Connect". In: Journal of the Air & Waste Management Association 56.6, pp. 709-742. doi: 10.1080/10473289.2006.10464485. [ Links ]
Richmond, Amy, Ian Myers, and Hafisa Namuli (2018). "Urban informality and vulnerability: A case study in Kampala, Uganda". In: Urban Science 2.1, p. 22. doi: https://doi.org/10.3390/urbansci2010022. [ Links ]
Roy, Rana (2016). "The cost of air pollution in Africa". In: OECD Publishing, Paris 333. doi: https://doi.org/10.1787/5jlqzq77x6f8-en. [ Links ]
Sanita di Toppi, Luigi, Lorenzo Sanita di Toppi, and Erika Bellini (2020). "Novel Coronavirus: How Atmospheric Particulate Affects Our Environ577 ment and Health". In: Challenges 11.1. issn: 2078-1547. doi: 10.3390/ challe11010006. url: https://www.mdpi.com/2078-1547/11/1/6. [ Links ]
Seaton, Anthony et al. (1995). "Particulate air pollution and acute health effects". In: The Lancet 345.8943, pp. 176-178. [ Links ]
Setti, Leonardo, Fabrizio Passarini, Gianluigi De Gennaro, Pierluigi Barbieri, et al. (2020). "The Potential role of Particulate Matter in the Spreading of COVID-19 in Northern Italy: First Evidence-based Research Hypotheses". In: medRxiv. doi: 10.1101/2020.04.11.20061713. [ Links ]
Setti, Leonardo, Fabrizio Passarini, Gianluigi De Gennaro, Pierluigi Baribieri, et al. (2020). "SARS-Cov-2 RNA Found on Particulate Matter ofcBergamo in Northern Italy: First Preliminary Evidence". In: medRxiv. doi: 10.1101/2020.04.15.20065995. [ Links ]
Spangl, Wolfgang et al. (2007). Representativeness and classification of air quality monitoring stations. Umweltbundesamt. 2007. Available at: https://www.umweltbundesamt.at/fileadmin/site/publikationen/rep0121.pdf [ Links ]
Tobias, Aurelio et al. (2020). "Changes in air quality during the lockdown in Barcelona (Spain) one month into the SARS-CoV-2 epidemic". In: Science of The Total Environment 726, p. 138540. issn: 0048-9697. doi: https://doi.org/10.1016/j.scitotenv.2020.138540. [ Links ]
Travaglio, Marco et al. (2020). "Links between air pollution and COVID-19 in England". In: Environmental Pollution 268, p. 115859. doi: doi.org/10.1016/j.envpol.2020.115859. [ Links ]
Uganda Bureau of Statistics (2016). The National Population and Housing Census 2014 Main Report. [ Links ]
Uganda Bureau of Statistics (UBOS) (2011). Report on the Census of Business Establishments 2010/2011. [ Links ]
United Nations (2018). World Urbanization Prospects: The 2018 Revision, Online Edition. Available at https://population.un.org/wup/Download/ (Accessed on May 10, 2020). [ Links ]
Venter, Zander S et al. (2020). "COVID-19 lockdowns cause global air pollution declines". In: Proceedings of the National Academy of Sciences 117.32, pp. 18984-18990. [ Links ]
Vermeiren, Karolien et al. (2012). "Urban growth of Kampala, Uganda: Pattern analysis and scenario development". In: Landscape and Urban Planning 106.2, pp. 199-206. [ Links ]
Watson, John G. and Judith C. Chow (2002). "A wintertime PM2.5 episode at the Fresno, CA, supersite". In: Atmospheric Environment 36.3, pp. 465-475. doi: 10.1016/s1352-2310(01)00309-0. [ Links ]
World Bank (2018). Coordinating Investments Across Greater Kampala Would Boost Growth for Uganda-World Bank Report. Available at https://www.worldbank.org/en/news/press-release/2018/03/09/coordinating-investments-across-greater-kampala-wouldboost-growth-for-uganda-world-bank-report. (Accessed on May 10, 2020). [ Links ]
World Health Organisation (2016). Air pollution levels rising in many of the world's poorest cities. Available at https://www.who.int/news-room/detail/12-05-2016-air-pollution-levels-rising-in-many-of-the-world-s-poorest-cities (Accessed on May 28, 2020). [ Links ]
World Health Organisation (2018). "9 out of 10 people worldwide breathe polluted air, but more countries are taking action, 2018". In: Available at http://www.who.int/news-room/detail/02-05-2018-9-out-of-10-people-worldwide-breathe-polluted-air-but-more-countries-are-taking-action. [ Links ]
World Health Organisation (2021). WHO global air quality guidelines: particulate matter (PM2.5 and PM10), ozone, nitrogen dioxide, sulfur dioxide and carbon monoxide. World Health Organisation, xxi, 267 [ Links ]
Wu, Xiao et al. (2020). "Exposure to air pollution and COVID-19 mortality in the United States: A nationwide cross-sectional study". In: medRxiv. doi: 10.1101/2020.04.05.20054502. [ Links ]
Xue, Tao et al. (2019). "Declines in mental health associated with air pollution and temperature variability in China". In: Nature Communications 10.1, pp.1-8. [ Links ]
Yan, Shujun et al. (2016). "Spatial and temporal characteristics of air quality and air pollutants in 2013 in Beijing". In: Environmental Science and Pollution Research 23.14, pp. 13996-14007. doi: 10.1007/s11356-016-6518-3. [ Links ]
Received: 12 May 2021
Reviewed: 13 July 2021
Accepted: 14 December 2021
1 https://www.yowerikmuseveni.com/speeches
2 The data gaps in figure 2 between September & October and November & December is due to prolonged outage of the sensors

