


Services on Demand
Article
 English (pdf)
 Article in xml format
 Article references
Indicators

Related links
-
 Cited by Google
 -
 Similars in Google
Share

 Permalink
Clean Air Journal
On-line version ISSN 2410-972X
Print version ISSN 1017-1703
Clean Air J. vol.32 n.1 Pretoria 2022
http://dx.doi.org/10.17159/caj/2022/32/1.12546
RESEARCH ARTICLE
A street-level assessment of greenhouse gas emissions associated with traffic congestion in the city of Nairobi, Kenya
Cynthia N. SitatiI, II; Christopher OludheI; Leah OyakeI; Aderiana M. MbandiIII, IV
IDepartment of Earth and Climate Sciences, University of Nairobi, Kenya
IIStockholm Environment Institute
IIISouth Eastern Kenya University
IVUnited Nations Environment Programme
ABSTRACT
Traffic congestion significantly contributes to climate change due to the emissions of greenhouse gases such as carbon dioxide (CO2), nitrous oxide (N2O) and ozone (O3). Rapid urbanization and poor planning coupled with increased motorization and fragmented public transport systems in cities such as Nairobi have led to increased vehicle emissions especially during heavy traffic along the various roads and within the central business district. To reduce greenhouse gas emissions in the urban transport sector, institutional coordination and relevant policy tools must be considered. This study aimed at estimating CO2 emissions from different vehicle categories during traffic congestion, using Uhuru Highway as a case study. The relationship between traffic congestion and CO2 emissions was analyzed using qualitative and quantitative methods, through a bottom-up approach. 120 questionnaires were administered to vehicle owners, passengers and pedestrians to get individual vehicle characteristics and opinions on the best actions for reduction of CO2 emissions along Uhuru Highway in Nairobi. The average annual daily traffic (AADT) for different vehicles from 2014 to 2019 was used to estimate the CO2 emissions. Results showed that private cars predominate over other vehicle types, contributing 73% of the total CO2 emissions in the Nairobi CBD. Private cars are the highest contributors of CO2 emissions with a total of 25.3 million grams of carbon dioxide equivalent (gCO2e), between 2014 and 2019. In comparison, public service vehicles, commonly referred to as Matatus, emitted 6.89 million gCO2e, light commercial vehicles 1.82 million gCO2e, heavy goods vehicles 251,683 gCO2e and motorcycles 181,054 gCO2e. To minimize CO2 emissions, the study recommends the enforcement of strong mobility policies to control the high motorization rate. One of these policies is the prioritization of the development of a mass public transport system to achieve the potential health, economic and environmental gains within the CBD.
Keywords: greenhouse gas emissions, urbanization, traffic congestion, CO2 emissions, policy
Introduction
The transport sector plays a vital role in contributing to the successful implementation of all Sustainable Development Goals (SDGs). According to Partnership on Sustainable Low Carbon Transport (SLoCaT), the sector is considered as the engine of the global economy that helps in accelerating human development (SLoCaT, 2019). However, as the global economy grows, transport greenhouse gas emissions continue to rise, impacting on the successful implementation of the SDGs. The increase in emission of greenhouse gases is as a result of burning of fossil fuels (IPCC, 2014) which ultimately alters the climate causing adverse effects such as floods, droughts and heatwaves, especially in cities (La Notte et al., 2018).
The International Energy Agency (IEA) estimates that the transport sector is responsible for 24% of total CO2 emissions (IEA, 2020). Road transportation accounts for nearly three quarters of these emissions. This includes emissions from traffic congestion which has become a common occurrence in cities and urban areas around the world.
Traffic congestion is a serious problem in urban road networks, especially in developing cities (Rajé et al., 2018). It contributes to an increase in travel time and fuel consumption, causes environmental pollution, decreases productivity and thereby imposes huge economic, social and environmental costs on the economy (Bharadwaj et al., 2017). Also, it results in emissions of harmful substances such as particulate matter, volatile organic compounds (VOCs) and also greenhouse gases such as carbon dioxide (CO2), nitrogen oxides (NOx), methane (CH4) and ozone (O3) (Transportation Research Board, 2002). Among the greenhouse gases, CO2 is the most significant because of its long-term impact on global warming (having a lifespan of hundreds of years) as compared to other gases. CO2 has the capacity to absorb excess heat from the sun and redirect it back to the surface of the earth, making the planet habitable. Increased concentrations of CO2 trap heat, thereby causing enhanced warming hence climate change.
Studies have shown that CO2 emissions from traffic congestion are influenced by different factors. Pandian et al. (2009) investigated the effects of traffic on vehicle emissions and revealed that traffic conditions, driving speed and pattern, vehicle and road characteristics, and vehicle composition greatly influence emissions especially near road intersections. Other factors such as the slope, density and length of the road, travel time, distance and speed of each vehicle on the road and class of the road that determines the traffic conditions and driving patterns, have also been reported to influence CO2 emissions (Li et al., 2014; Zhang & Zhu, 2017; Zhu, 2013).
According to Raje et al. (2018) traffic congestion poses a huge threat to the social, economic and environmental development in many cities of both developed and developing countries. Cities in the USA, UK, Poland, Slovakia and Spain have experienced congestion which has resulted in increased CO2 emissions (Chang et al., 2017). Another study conducted in Chennai, India showed that the transportation sector was one of the largest emitters contributing 29.7% of the total CO2 emissions (Kumar and Nagendra, 2016). China is the world's biggest emitter of CO2 (Zheng et al., 2020) whose transportation sector accounts for 9.3% of the country's total emissions. More than 8% of the total carbon emissions are from traffic congestion (Zhang et al., 2019), in which private vehicles constitute to the majority of the traffic especially in metropolitan areas such as Beijing (Li and Jones, 2015; Zheng et al., 2020). Other cities such as Mexico City, Bangkok, Singapore, Jakarta, Manila, Delhi and Mumbai have reported drops in their average speed during peak hours, an indication of heavy traffic congestion (Chang et al., 2017). Sao Paulo, Brazil, has been widely known to experience traffic congestion on a daily basis that lasts for 2-3 hours (Chang et al., 2017).
The majority of African countries also experience traffic congestion which results in massive delays as well as a decrease in productivity (Agyapong and Ojo, 2018). This can be attributed to a rapid increase in vehicle ownership coupled with rapid urbanization in many African countries (Doumbia et al., 2018), second-hand vehicles from the developed nations and inefficiency of public transport (Wojuade, 2018). South Africa has the highest greenhouse gas emissions of the African countries with the transportation sector accounting for 30.8% (Rhikhotso et al., 2016). The city of Tshwane in South Africa has experienced heavy traffic congestion, contributing 7.2% of South Africa's total CO2 emissions (Rhikhotso et al., 2016). In Ivory Coast, Abidjan has also experienced intense traffic congestion which has significantly contributed to the increase in the city's emission levels (Doumbia et al., 2018). Kenya has experienced traffic congestion in its major cities of Nairobi, Kisumu and Mombasa (Salon and Gulyani, 2019). This has caused a rise in emission levels within the transportation sector which is responsible for about 11% of the country's total greenhouse gas emissions (Government of Kenya, 2018).
Due to the rapid increase in vehicle ownership, the emission levels have been projected to increase to about 14.7% of total greenhouse gas emissions by 2030 (Government of Kenya, 2018). It is estimated that the road transport sector accounts for 99% of greenhouse gas emissions from non-aviation transport sector in Kenya (Cameron et al., 2012).
The problem: Nairobi City with Uhuru Highway as a case study
Nairobi is the most populated city in Kenya with a population of about 4.4 million people (Kenya National Bureau of Statistics (KNBS), 2019) and has the highest concentration of sources of industrial air pollutants and vehicles in Kenya (Gaita et al., 2014; Maroa, 2019). As the city's population continues to increase, air quality continues to deteriorate as a result of increased vehicle emissions, exposing both the citizens and visitors to health risks (Kinney et al., 2011; Odhiambo et al., 2010; Rajé et al., 2018a).
Heavy traffic congestion experienced within the city of Nairobi is mainly attributed to the high rates of motorization (Gachanja, 2015), as 60% of the total registered vehicles in Kenya operate in Nairobi (Madara et al., 2018). Nairobi City has one of the longest average trips to work compared to other African cities which is attributed to heavy traffic congestion (Rajé et al., 2018).
As of 2013, the total person trip generation by persons living inside Nairobi City was 6.8 million-person trips in a day. The most popular mode of transport is walking (over 40%), with 28% of commuters using public transport and 14% use private vehicles (JICA, 2014). In 2015, the city generated 7.8 million trips per day (JICA, 2018).
In Nairobi, vehicle emissions contribute about 39% of fine particulate matter (Gaita et al., 2014). Heavy traffic congestion worsens the situation as it consumes much fuel, increases travel time and leads to environmental pollution (Bharadwaj et al., 2017). Pedestrians walking along the busy streets of Nairobi are exposed to pollution emitted from stationary vehicles during times of traffic congestion. Street vendors and traffic police who spend much of their day on congested streets are also affected by the emissions from motor vehicles (Kinney et al., 2011).
Public transport, mainly dominated by matatus and private cars have been reported to be the major contributors to traffic congestion, especially in the CBD of Nairobi (Mitullah, 2020).
This is attributed to inefficiencies such as not operating on schedules within the public transport, making Nairobi residents opt for private means of transport. As a result, private vehicles become more dominant on the roads.
Traffic congestion has imposed a heavy economic burden on the Kenyan economy. In a recent report by the Nairobi Metropolitan Area Transport Authority (NMATA), it was estimated that traffic congestion costs Kenya almost $1 billion per year, with an average travel time of about 57 minutes in Nairobi, making Nairobi the fourth most congested city in the world (Mwakaneno, 2019). This implies that the economic and environmental costs of traffic congestion in Nairobi are at an acute stage and therefore need to be explored further to reduce these costs.
Regulatory guidelines such as the Kenya Standard Code of Practice for inspection of road vehicles (KS 1515 of 2000) (governs motor vehicle inspection and hence vehicle emissions in Kenya) have been put in place to control vehicular emissions. However, Nairobi lacks a regular air quality management system, which includes management of greenhouse gas emissions such as CO2 (Japan International Cooperation Agency (JICA), 2018). Therefore, there is need to assess the city's CO2 emissions from traffic congestion which contribute to the overall ambient air quality.
Materials and methods
The study adopted an exploratory case study considering Uhuru Highway in Nairobi to investigate the relationship between traffic congestion and greenhouse gas emissions. Four data sources were used: questionnaire surveys, traffic counts, scheduled interviews and secondary sources. Various actors were involved in the study including pedestrians along the street, passengers using public vehicles, drivers/owners/vehicle operators and key informants from the relevant authorities within the study area.
Study area
The study was carried out in Nairobi City which serves as an economic, administrative, political and cultural center. Nairobi is one of the largest and fastest-growing cities in Africa (Mastrota, 2019). Located at 1.32°S and 36.9°E, it covers an area of approximately 696 km2, with an estimated population of 4.4 million (Kenya National Bureau of Statistics (KNBS), 2019). Nairobi is possibly the city most affected by vehicle emissions from traffic congestion in Kenya. The study examines how traffic congestion contributes to greenhouse gas emissions within the boundaries of the central business district of Nairobi City along Uhuru Highway (Figure 1).
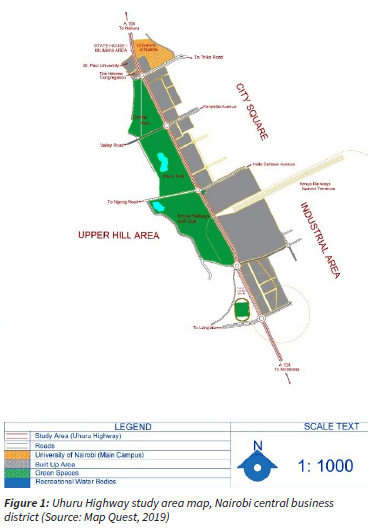
The highway is a major artery into and out of the central business district of Nairobi and experiences heavy traffic volume compared to other roads. It is one of the busiest and most congestion-prone highways in Nairobi (Kenneth et al., 2020). The road segment connects major highways in the country (Mombasa Road, Thika Road and Nairobi-Nakuru highway), and there is a good mix of vehicles during traffic congestion. The strategic location of the Jomo Kenyatta International Airport (JKIA) along Mombasa Road gives an indication of major traffic flow into and out of the central business district on Uhuru Highway. Major cities (Nairobi, Mombasa and Kisumu) and towns (Nakuru, Eldoret and Malindi) in the country are also connected through this highway.
Sampling strategy for questionnaires
A quota sampling technique was used to obtain information from three groups of people: vehicle owners, passengers and pedestrians who were the main participants in the survey. To ensure that the survey was representative, vehicle owners were further divided into five different groups: passenger cars, matatus, heavy goods vehicles, light commercial vehicles and motorcycles.
Following the sampling procedure of Van Dessel (2013), a target sample of n=120 for the questionnaire survey was needed to obtain a 95% confidence level with a ±5% margin of error. 130 participants were invited to participate in the survey, out of which the researchers obtained 105 completed questionnaires. This represents a response rate of 80.7%, which according to Baruch and Holtom (2008) is within the acceptable range of 8085% for face-to-face questionnaires.
Questionnaire surveys
A questionnaire survey that involved both quantitative and qualitative data was developed to collect information on vehicle characteristics, vehicle activity and opinions on emission reduction strategies from traffic congestion. These variables provided information on fleet characteristics, composition, infrastructural challenges, ease of movement and emission reduction measures.
Face-face questionnaire interviews were conducted from 10-14 June 2019 by two trained research assistants between 10:00 and 18:00. The targeted sites are high density areas, which made it easy for the researchers to obtain information relevant to the study. These areas are business parking lots and petrol filling stations located along Uhuru Highway.
Responses from the questionnaire survey were also used to determine the Travel Time Index (TTI), a congestion indicator. TTI is the ratio of the time that a vehicle takes to move from one point to another during free flow as compared to during peak hours.
Scheduled interviews
Scheduled interviews provided more information on strategies that can be used to reduce greenhouse gas emissions from traffic congestion. The key people to provide this information were representatives from relevant authorities in the transport sector (Kenya National Highway Authority, Nairobi City County Environment Department, National Transport and Safety Authority and the National Environment Management Authority). These interviews were important as they enabled the researchers to get an in-depth understanding of the problem.
Secondary sources
Secondary data was obtained from different sources from the literature review, government databases, scholarly articles and also reputable websites. Secondary data that described the population of registered vehicles in Kenya was used to provide a comparative analysis of estimated CO2 emissions at a street level (Uhuru Highway), sub-national level (Nairobi) and national level (Kenya) as 60% of the total registered vehicles operate in Nairobi (Madara et al., 2018).The other source of secondary data was the Average Annual Daily Traffic (AADT) from the Kenya National Highways Authority (KENHA) database. These data were used to estimate traffic-related emissions of CO2 between 2014 and 2019 by using IPCC Tier 3 methodology. However, only data for 2014 was available at the KENHA database. Data for the subsequent years was projected up to 2019 using the growth rate formula in Equation (1)

where:
A is the current average annual daily traffic
P is the Average Annual Daily Traffic of the previous year
r is the traffic growth rate of the vehicle fleet (%)
n is the number of years projected
The traffic growth rates were obtained from the Road Sector Investment Program-2 2015-2019 from the Kenya Roads Board Database. Due to limitations of AADT data availability, 2014 was used as a base year, from which trends and patterns of CO2 emissions were estimated.
Estimation of CO2 emissions
According to the 2016 report of the International Energy Agency, all CO2 emissions associated with fuel combustion depend on the volume of fuel burned, the fuel density, the carbon content of the fuel and the carbon fraction that is oxidized to CO2 (IEA, 2016). CO2 emissions from fuel combustion depends on the amount of carbon in the fuel, which is specific to the type and grade of the fuel. To determine the carbon content in the fuel, a chemical analysis is carried out. As such, the information can be obtained from the fuel supplier. However, if the carbon content of the fuel is not known, the calculation of CO2 emissions is based on the predetermined emission factors. The factors will help approximate the carbon content of the fuel to quantify the amount of CO2 that will be released when the fuel is burned. IPCC Tier 3 methodology (IPCC, 2001) was used to calculate CO2 emissions using the formula in the Equation (2).
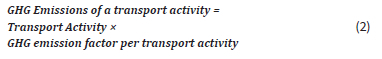
The formula was further modified by Adhi (2018), to suit the study as shown in Equation 3. The primary data requirements for this approach include:
• Traffic count/flow: this provides the total number of vehicles per hour/day/week along the chosen area of study
• The total length of the road segment under investigation
• Vehicle activity (fuel consumption/fuel economy)
• Emission factors are only based on fuel consumption.
The basis for these emission factors is the Handbook of Emission Factors for Road Transport (HBEFA Version 3.3). (Notter et al., 2019).

Where;
E is the total CO2 emissions (gram CO2 per day)
A is the average number of vehicles of type A per day
F is the specific fuel consumption per vehicle type A (litres/km)
l is the length of the road (km)
ef is the emission factor (grams CO2/litre)
The specific fuel consumption per type of vehicle is the local fuel economy obtained from Mbandi et al. (2019), INFRAS (2017b) and INFRAS (2018), representing Kenya's specific emission factors. Tank-to-wheel CO2 emission factors have been used to develop trends and patterns from 2014-2019 for road vehicle categories along Uhuru Highway.
Traffic counts
Traffic counts involved the use of both primary and secondary data. Primary data was collected from 18-23 June 2019, and was conducted with the help of two trained research assistants. The research assistants went through training to ensure that they have adequate knowledge on the subject matter. Secondary data comprising the Average Annual Daily Traffic was obtained from the Kenya National Highway Authority for 2014.
Descriptive and inferential analysis
While questionnaire surveys targeted members of the public and included both qualitative and quantitative information, traffic counts and secondary sources were mainly quantitative in nature. Interviews provided qualitative information since the researchers needed to have an in-depth understanding of traffic congestion and its impacts, and actions that the relevant authorities have/are taking to solve the problem.
Descriptive analyses were conducted to determine statistical parameters of primary data which formed the basis of quantitative analysis. Inferential analysis was used to deduce from the sample data the perceptions of the targeted population of the traffic congestion and its impacts on emissions. Overall and detailed conclusions were drawn from the analysis based on mean, mode, frequencies and percentages to describe the findings of the study. Questions with non-numeric responses were matched and an assumed opinion reached based on the frequency of the responses in which a codebook was developed with the help of SPSS software. The output has been presented in the form of graphs, charts and percentages. The estimated CO2 emissions were then used to generate a traffic emissions inventory for different vehicle types.
Results
Factors that contribute to traffic congestion
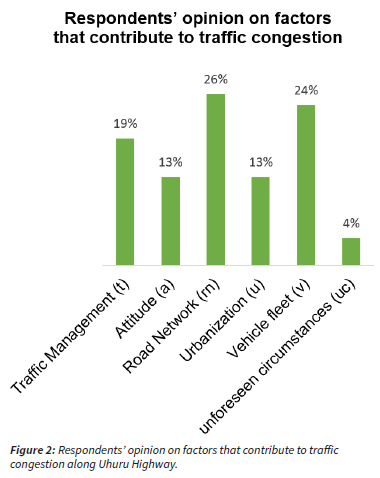
Feedback from the questionnaire surveys on factors that contribute to traffic congestion was classified into six categories: i) traffic management; ii) attitude; iii) road network; iv) urbanization; v) vehicle fleet; and vi) Unforeseen (Figure 2). All issues related to poor traffic control by the police officers or poor functioning of traffic lights as the main cause of congestion were classified under traffic management. Issues of having too many roundabouts or the road capacity being too small to accommodate the growing number of vehicles were classified under the road network factor. Issues of ignorance of traffic rules by the drivers and careless driving were classified under attitude while circumstances such as accidents or vehicle breakdown were classified under unforeseen circumstances. Vehicle fleet simply implies that congestion was caused by a specific type of vehicle. Lastly, the reasons given as due to increased motorization rates in Nairobi and too many vehicles using the highway at the same time resulting in congestion were classified under urbanization. In ranking these variables, it was observed that the inadequate road network was the most common reason given for congestion, followed by vehicle fleet and traffic management. Attitude and urbanization came in fourth while unforeseen circumstances came in last.
Congestion measures
Table 1 shows the average travel time and average TTI on Uhuru Highway for five vehicle categories. The varying distances travelled by different vehicle categories is attributed to the number of trips a particular vehicle takes. The average TTI for all vehicle classes on Uhuru Highway is 2.8, meaning that a vehicle takes 2.8 times longer to do a certain trip in peak hours than in free flow traffic.
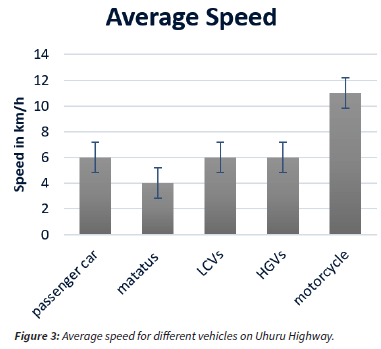
On average, passenger cars travel at an approximate speed of 6k m/h, matatus at 4 km/h, light goods vehicles at 6 km/h, heavy goods vehicles at 6 km/h and motorcycles at 11 km/h (Figure 3), regardless of the time (peak and off-peak hours).
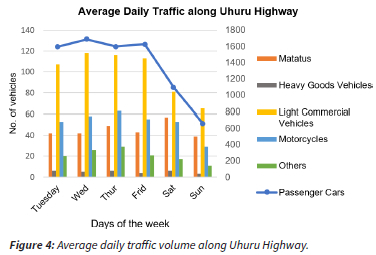
A traffic count was carried out for six days in July 2019 (Figure 4). A similar pattern is observed on every day of the week. Passenger vehicles have the highest traffic count, recording an average number of more than 600 vehicles within a span of 15 minutes on a daily basis. The count also revealed that passenger cars have the highest traffic volume on Uhuru Highway on different days of the week. Wednesdays and Fridays had the highest traffic volume from the observed vehicle fleet, recording a total of 1934 and 1862 vehicles respectively. There was also a high volume of traffic on Tuesdays and Thursdays with 1821 and 1861 vehicles respectively. During the weekend, the traffic volume was moderate, averaging 1304 vehicles on Saturdays and 807 vehicles on Sundays.
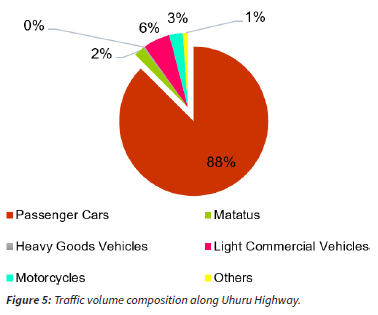
Most vehicles on Uhuru Highway are passenger cars, comprising of 88% of the total traffic volume (Figure 5). This was followed by light commercial vehicles with 6% of the total traffic. Motorcycles came in the third place constituting 3%, followed by matatus with 2% while heavy goods vehicles comprised less than 1% of the total traffic volume.
Based on the responses from the questionnaire survey, the majority of residents use petrol rather than diesel. The fuel consumption rates were reported to be dependent on the usage of vehicles and number of trips made in a day. The majority of people with cars consume between 1-10 litres of fuel daily while some use more than 40 litres, depending on the number of trips.
Vehicle contribution to CO2 emissions
Contribution of passenger cars
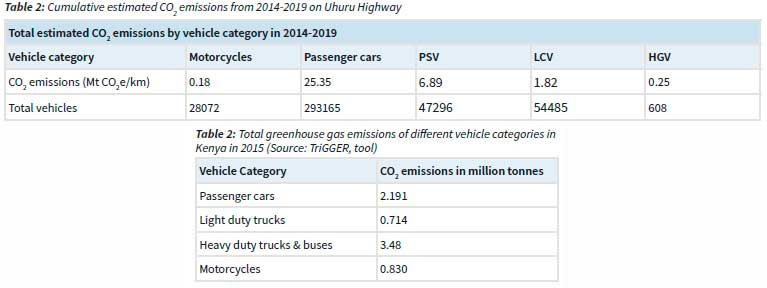
Passenger cars were the biggest contributors of CO2 emissions, contributing cumulatively to a total of about 25 million grams of CO2 equivalent per kilometer, from 2014-2019 (Table 2). This is because they are the most common vehicle on the highway. The increase in the total number of vehicles translates to the increase in CO2 emissions. Private cars including station wagons and 4WD (four-wheeled drive) cars were all classified as passenger cars in this study.
Contribution of public service vehicles (PSV)
All public service vehicles (excluding taxis) providing public transport were categorized as matatus. This category of vehicles contributed the second most CO2, about 6.9 million grams of CO2 equivalent per vehicle kilometer (Table 2). The number of matatus on the highway has been on the rise since 2014 resulting in an increase in CO2 emissions.
Contribution of light commercial vehicles (LCV)
This category of vehicle includes all medium-sized vehicles that are used for commercial purposes such as medium-sized lorries, pick-ups, vans and light buses. LCVs contribute a significant amount of CO2 emissions and emissions have been increasing since 2014. Their emission factor is high, implying that they are among the worst polluters. LCVs have been estimated to contribute to about 650,000 gO2e/km by the end of 2019.
Contribution of heavy goods vehicle (HGV)
Heavy goods vehicles such as trucks and trailers have the lowest traffic volume on the highway. However, the number has been increasing gradually, with 2019 likely to have an average daily traffic of 160 trucks using the highway. Despite this group of vehicles having the least numbers, they are the worst polluters because of their high emission factor. By 2019, HGVs will have cumulatively contributed to about 250,000 gCO2e/km, which is higher than that of motorcycles (181,000 gCO2e/km).
Contribution of motorcycles
Motorcycles are the lowest contributors of CO2 emissions. They also have the lowest emission factor. There has been a steady increase of CO2 emissions by motorcycles on the highway. This trend is expected to increase owing to the increase in the number of motorcycles as a result of rapid urbanization, motorization and increase in population.
CO2 emission levels
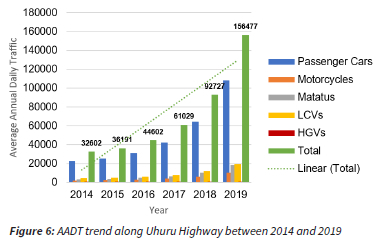
To estimate the emissions from the different vehicle categories, a bottom-up approach was adopted. The primary data requirements were; the average daily traffic volume on Uhuru Highway, activity data of the vehicle (fuel consumption), emission factors and the total length of the road segment. The AADT has been increasing yearly with 2014 having a total of 32,602 vehicles of all types operating along the road (Figure 6). In 2015 there was also an increase in traffic volume recording a total of 36,191 vehicles, and 44,602, 61,029, 92,727 and 156,477 vehicles in 2016, 2017, 2018 and 2019 respectively.
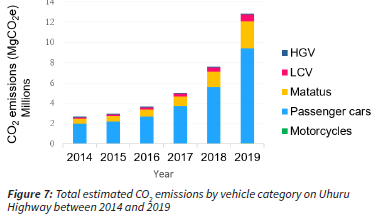
There was a steady increase in CO2 emissions from passenger cars, motorcycles, matatus, LCVs and HGVS between 2014 - 2019. By 2019, passenger cars were estimated to have contributed 9.3MgCO2e, motorcycles 0.067 MgCO2e, matatus 2.7 MgCO2e, LCVs 0.65 MgCO2e ang HGVs 0.067 MgCO2e.
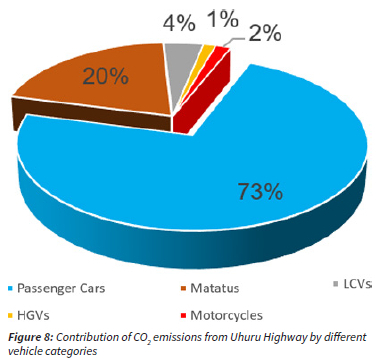
Passenger cars are the highest contributors to CO2 emissions, comprising 73% of the total emissions followed by matatus (20%), LCVs (4%), Motorcycles (2%) and finally, the least contributors are the HGVs with 1% (Figure 8).
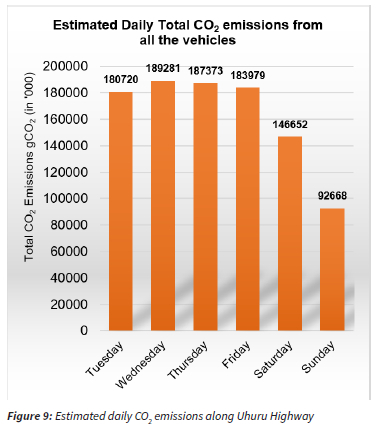
CO2 emissions by day of the weekdays were highest on Tuesdays, Wednesdays, Thursdays and Fridays (180,720 gCO2, 189,281 gCO2, 187,373 gCO2 and 183,979 gCO2 respectively).
On Saturdays and Sundays, the emission levels were lower at 146,652 gCO2 and 92,668 gCO2 respectively.
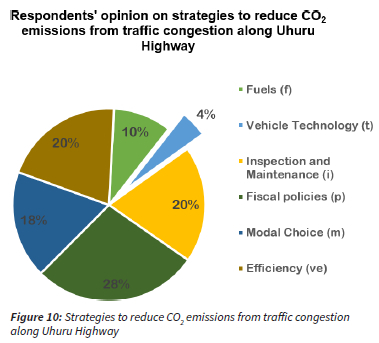
Interventions to reduce traffic-related CO2 emissions
Figure 10 shows some of the interventions that could help in mitigating CO2 emissions from traffic congestion as suggested by the questionnaire survey respondents. 28% of the respondents reported that enforcement of fiscal policies would be the best option to reduce CO2 emissions from traffic congestion. This includes elimination of old and unroadworthy vehicles on the road, and imposing stricter rules on those that defy the already established regulations. The second strategy was ensuring proper inspection and maintenance, and improving vehicle efficiency of all vehicles which was supported by 20% of the respondents. Modal choice was proposed by 18% of respondents, use of quality fuels was supported by 10% and lastly was vehicle technology which was supported by 5% of the respondents.
Discussion
This study has demonstrated that traffic congestion contributes significantly to greenhouse gas emissions in cities such as Nairobi that experience heavy congestion during peak hours. Respondents acknowledged that congestion along Uhuru Highway is mainly caused by too many roundabouts and that the capacity of the road is too small to accommodate the growing number of vehicles. This means that the demand factors exceed the supply factors and as a result, vehicles move at sluggish speeds and greater speed variation, causing congestion. These findings conform with those of Kozlak and Wach (2018) that established demand-side factors to be more important than supply-side factors, hence contributing to congestion on urban roads.
Factors such as poor planning of the city, poor traffic management, increase in population, illegal parking, among others emerged to be the major causes of traffic congestion along Uhuru Highway. Studies by Rahane and Saharkar (2014) also conform to these findings, citing on-street parking as the major cause of congestion in cities. Additionally, Zhang et al. (2011) also noted that congestion mainly occurs as a result of rapid increase in car ownership and use, especially during rush hour periods in work zones. However, this study was only limited to specific types of vehicles during peak and off-peak hours on different days of the week in a specific work zone within the CBD of Nairobi City. Attitude, which includes arrogance, poor discipline and general driver behaviour, also emerged as a key contributing factor to traffic congestion along Uhuru Highway as reported by respondents during the questionnaire survey.
In Nairobi, passenger cars contribute the most to traffic congestion, and are the greatest contributor of CO2 emissions. The calculations conform with those of Nejadkoorki (2008) who found out that passenger cars were the main source of greenhouse gas emissions accounting for 72.5% of all CO2 emissions in Norwich. A similar study conducted in Tehran by Kakouei (2012) also revealed that private cars were the main sources of greenhouse gas emissions, contributing about 88% of CO2 emissions from road transport.
Comparison with the Kenya National Greenhouse Gas Inventory
The Transport Inventory and Greenhouse Gas Emissions Reporting (TrIGGER) tool developed by GIZ is a bottom-up spreadsheet model that is used to calculate national transport greenhouse gas inventories for different countries, including Kenya (Scherer and Christoph, 2018). This tool was used to calculate CO2 emissions for Kenya for the different vehicle categories in 2015 (Table 2).
Uhuru highway contributes less than 1% of the total CO2 emissions from transport in Kenya. According to Madara et al. (2018), 60% of the total vehicles registered in Kenya operate in Nairobi. This has been estimated by the National Transport and Safety Authority (NTSA) to have an average of 10% annual increase, and a total of 4-5 million vehicles by 2030 (Government of Kenya, 2015). The TriGGER tool provided a total of 7,199 Mt CO2 emissions from the road transport sector in Kenya in 2015. Based on these results, vehicle emissions in Nairobi are likely to contribute 4.32 Mt CO2, which is more than half of the total emissions from road transport in the country. Therefore, Nairobi needs to put in more efforts towards reducing emissions from road transport.
Policy implications
These results build on existing evidence that traffic congestion is a significant contributor to CO2 emissions and air pollution. Previous research has focused on the contribution of traffic congestion to air pollution (Kinney et al., 2011; Gaita et al., 2014; Rajé et al., 2018; Singh et al., 2021). These results demonstrate that congestion is also a contributor to CO2 emissions.
Traffic congestion in Nairobi increases fuel consumption and CO2 emissions. This conforms with the findings of Bharadwal et al. (2017) in a study conducted in Mumbai Metropolitan Areas in which traffic congestion was reported to have a great impact on fuel consumption, travel time and CO2 emissions. The stakeholder-led narratives reveal that the rapid growth rate of the economy in Nairobi city is a major driving force of traffic congestion. As the economy grows, there is increasing demand for a better lifestyle, including vehicle ownership (Brand et al, 2018). This could explain the steady increase in the number of vehicles, especially the passenger cars.
Nairobi City County Government (NCCG) is aware of these forces driving traffic congestion in the central business district and it is putting in a lot of effort to decongest the city, with the ultimate goal of improving air quality. Many innovative projects are underway to ease traffic such as the ongoing construction of the Nairobi Expressway which is expected to ease the flow of traffic through the city, reducing congestion along Mombasa Road, Uhuru Highway and Waiyaki Way, light rails, installation of intelligence traffic lights, traffic Marshalls and many more plans.
Enforcement of fiscal policies to eliminate old and unroadworthy vehicles, and imposing stricter rules on those that defy the
already established regulations are key when proposing mitigative measures to reduce traffic congestion. Moreover, there should be effective stakeholder engagement for impactful interventions that benefit the public and promote sound environmental stewardship. The main lessons learnt from megacities such as Mexico City, Jakarta, Beijing, Singapore and Hong Kong highlight the importance of implementing policies such as driving restrictions, ownership restraints and other programmes that could limit growth of the vehicle fleet and improve the traffic conditions (Li and Jones, 2015; Song et al., 2018).
It must be acknowledged that this century offers a daunting challenge to control greenhouse gas emissions without affecting economic development, particularly in fast-urbanizing cities like Nairobi, where economic development, reducing unemployment and improving people's living standards are at the forefront. The steady growth of private vehicles in such cities will continue to have a significant impact on resource depletion and global warming if nothing is done to control the growth. It is important to have institutional coordination and appropriate policy tools in place so as to achieve CO2 emission reduction in urban transportation. In addition, governance of urban transport must be strengthened, ensuring that transport policies are integrated into urban development plans. Also, to ensure that there is notable progress towards low-carbon transport, there must be involvement of a wide range of stakeholders as well as partners with a common goal and interests.
Conclusion
This study achieved its main objective by demonstrating that traffic congestion is a significant contributor to greenhouse gas emissions, particularly CO2 emissions, in Nairobi.
Taking Uhuru Highway as a case study, the findings indicate that passenger cars are the highest contributors of CO2 emissions because of their great numbers on the road segment. More efforts need to be put in place in to decongest the city and reduce CO2 emissions. For example, adoption of car free days could help in lowering congestion in the city. Metropolises such as Kigali, Addis Ababa and Cape Town have already proved that car-free initiatives can work in sub-Saharan cities to help reduce congestion and encourage other alternative means of transport both during normal days and car-free days This goes beyond decongesting a city as people will claim their spaces in a friendly environment.
Nairobi city is growing fast and experiencing rapid growth in transport emissions. Allocation of the city's road space needs to be more equitable in order to accommodate people's needs. There is a strong desire for more sustainable mobility options within the city to reduce travel times and emissions, and create healthier and more livable cities. Most important is to implement effective policies that guide the changes in mobility within the city.
Acknowledgements
The completion of this research project would not have been what it is, were it not for the inputs of several people who contributed immensely. I am grateful to the University of Nairobi for granting me the opportunity to pursue my graduate studies at the Institute for Climate Change and Adaptation. Special appreciation to my supervisors, Doctors Christopher Oludhe, Leah Oyake-Ombis and Aderiana Mbandi. Your patience and time dedicated from project conception to completion have contributed to the success of this project.
Author contributions
Conceptualization, methodology, data collection and analysis, writing/revisions: CS; student supervision: CO, LO and AM.
References
Adhi, R.P. (2018) 'Top-Down and Bottom-Up Method on Measuring CO2 Emission from Road-Based Transportation System (Case Study: Entire Gasoline Consumption, Bus Rapid Transit , and Highway in Jakarta, Indonesia)'. Jurnal Teknologi Lingkungan, 19(2), pp. 249-258. [ Links ]
Agyapong, F. and Ojo, T.K. (2018) 'Managing Traffic Congestion in the Accra Central Market, Ghana'. Journal of Urban Management, 7(2), pp. 85-96. DOI: 10.1016/j.jum.2018.04.002. [ Links ]
Baruch, Y. and Holtom, B.C. (2008) 'Survey Response Rate Levels and Trends in Organizational Research'. Human Relations, 61(8), pp. 1139-1160. [ Links ]
Bharadwaj, S., Ballare, S. and Chandel, M.K. (2017) 'Impact of Congestion on Greenhouse Gas Emissions for Road Transport in Mumbai Metropolitan Region'. Transportation Research Procedia, 25, pp. 3542-3555. DOI: 10.1016/j.trpro.2017.05.282. [ Links ]
Brand, C., Anable, J. and Morton, C. (2018) 'Lifestyle , Efficiency and Limits: Modelling Transport Energy and Emissions Using a Socio-Technical Approach'. Energy Efficiency. Available at: https://link.springer.com/article/10.1007/s12053-018-9678-9#citeas. [ Links ]
Cameron, L., Laura, W. and Seton, S. (2012) Kenya's Climate Change Action Plan: Mitigation Chapter 7: Transportation. [ Links ]
Chang, Y.S., Lee, Y.J. and Choi, S.S.B. (2017) 'Is There More Traffic Congestion in Larger Cities? -Scaling Analysis of the 101 Largest U.S. Urban Centers-'. Transport Policy, 59, pp. 54-63. DOI: 10.1016/j.tranpol.2017.07.002. [ Links ]
Van Dessel, G. (2013) How to Determine Population and Survey Sample Size?. Available at: https://www.checkmarket.com/blog/how-to-estimate-your-population-and-survey-sample-size/ (Accessed: 4 April 2019). [ Links ]
Doumbia, M. et al. (2018) 'Emissions from the Road Traffic of West African Cities: Assessment of Vehicle Fleet and Fuel Consumption'. Energies, 11(9), pp. 1-16. DOI: 10.3390/en11092300. [ Links ]
Gaita, S.M. et al. (2014) 'Source Apportionment and Seasonal Variation of PM25 in a Sub-Sahara African City: Nairobi , Kenya'. Atmospheric Chemistry and Physics, (March). DOI: 10.5194/acpd-14-9565-2014. [ Links ]
Gastaldi, M. et al. (2017) 'On-Road Measurement of CO2 Vehicle Emissions under Alternative Forms of Intersection Control'. Transportation Research Procedia, 27, pp. 476-483. DOI: 10.1016/j.trpro.2017.12.048. [ Links ]
Goh, M. (2002) 'Congestion Management and Electronic Road Pricing in Singapore'. Journal of Transport Geography, 10(1), pp. 29-38. DOI: 10.1016/S0966-6923(01)00036-9. [ Links ]
Government of Kenya. (2015) Energy Regulatory Commission. Report on Global Fuel Economy Initiative Study in Kenya. [ Links ]
De Grange, L. and Troncoso, R. (2011) 'Impacts of Vehicle Restrictions on Urban Transport Flows: The Case of Santiago, Chile'. Transport Policy, 18(6), pp. 862-869. DOI: 10.1016/j.tranpol.2011.06.001. [ Links ]
Hao, H., Wang, H. and Ouyang, M. (2011) 'Comparison of Policies on Vehicle Ownership and Use between Beijing and Shanghai and Their Impacts on Fuel Consumption by Passenger Vehicles'. Energy Policy, 39(2), pp. 1016-1021. DOI: 10.1016/j.enpol.2010.11.039. [ Links ]
IEA. (2016) Key CO2 Emission Trends. Excerpt from: CO2 Emissions from Fuel Combustion. Available at: http://www.iea.org/statistics/topics/CO2emissions/. [ Links ]
IEA. (2020) Tracking Transport 2020. Available at: https://www.iea.org/reports/tracking-transport-2020 (Accessed: 24 November 2020). [ Links ]
INFRAS. (2017) Handbook Emission Factors for Road Transport (HBEFA). Version HBEFA 3.3. INFRAS, Berne. Available at: www.hbefa.net/. [ Links ]
INFRAS. (2018) Road Transport GHG Emission Factors for Kenya. Pilot Study for 2015. [ Links ]
Japan International Cooperation Agency (JICA). (2018) Republic of Kenya the Project on Detailed Planning of Integrated Trnasport System and Loop Line in the Nairobi Urban Core. Nairobi. [ Links ]
Kakouei, A., Vatani, A. and Idris, A.K. Bin. (2012) 'An Estimation of Traffic Related CO2 Emissions from Motor Vehicles in the Capital City of, Iran'. Journal of Environmental Health Science and Engineering, 9(1), pp. 1-5. [ Links ]
Kenneth, J.K., Mwea, S.K. and Dulo, S.O. (2020) 'Emissions of Vehicular Traffic along Uhuru Highway Corridor in Nairobi'. Journal of Engineering and Architecture, 8(2), pp. 22-27. DOI: 10.15640/jea.v8n2a4. [ Links ]
Kenya National Bureau of Statistics (KNBS). (2019) 2019 Kenya Population and Housing Census Volume I: Population By County and Sub-County. Available at: http://www.knbs.or.ke. [ Links ]
Kinney, P.L. et al. (2011) 'Traffic Impacts on PM(25) Air Quality in Nairobi, Kenya.' Environmental Science & Policy, 14(4), pp. 369378. DOI: 10.1016/j.envsci.2011.02.005. [ Links ]
Kozlak, A. and Wach, D. (2018) 'Causes of Traffic Congestion in Urban Areas. Case of Poland'. SHS Web of Conferences, 57, p. 01019. DOI: 10.1051/shsconf/20185701019. [ Links ]
Kumar, M.K. and Nagendra, S.M.S. (2016) 'Quantification of Anthropogenic CO2 Emissions in a Tropical Urban Environment'. Atmospheric Environment, 125, pp. 272-282. DOI: 10.1016/j.atmosenv.2015.11.024. [ Links ]
Lakouari, N. et al. (2020) 'Modeling and Simulation of CO2 Emissions in Roundabout Intersection'. Journal of Computational Science, 40, p. 101072. DOI: 10.1016/j.jocs.2019.101072. [ Links ]
Li, P. and Jones, S. (2015) 'Vehicle Restrictions and CO2 Emissions in Beijing - A Simple Projection Using Available Data'. Transportation Research Part D: Transport and Environment, 41(2015), pp. 467-476. DOI: 10.1016/j.trd.2015.09.020. [ Links ]
Li, Z. et al. (2014) 'Analytical Studies of CO2 Emission in a Mixed Traffic Flow with Different Vehicles'. Physica A: Statistical Mechanics and Its Applications, 413, pp. 320-328. DOI: 10.1016/j.physa.2014.07.010. [ Links ]
Madara, O., James, N. and Rita, M. (2018) Characteristics of the In-Service Vehicle Fleet in Kenya. Nairobi, Kenya. [ Links ]
Maroa, J.C. (2019) 'An Assessment of the Contribution of the Corporate Taxi Industry to the Nairobi County Carbon Emission'. International Journal of Current Business and Social Sciences, 1(3), pp. 216-230. [ Links ]
Mastrota, E. (2019) How Nairobi Became One Of The Fastest Growing Cities In The World. The National Digest in the World News. Available at: https://thenationaldigest.com/how-nairobi-became-one-of-the-fastest-cities-in-the-world/ (Accessed: 1 May 2020). [ Links ]
Mbandi, A.M. et al. (2019) 'Estimating On-Road Vehicle Fuel Economy in Africa: A Case Study Based on an Urban Transport Survey in Nairobi, Kenya'. Energies, 12(6), pp. 6-8. DOI: 10.3390/en12061177. [ Links ]
Mitullah, W. V. (2020) Kenya: Nairobi. INC DOI: 10.1016/B978-0-12-815265-2.00007-8. [ Links ]
Mwakaneno, G. (2019) JKIA-Westlands Expressway: The First Step Towards Solving Nairobi's Traffic Menace? The Kenyan Wallstreet. Available at: https://kenyanwallstreet.com/expressway-between-jkia-and-westland-first-step-to-solving-nairobis-traffic-jam/ (Accessed: 25 January 2020). [ Links ]
Nejadkoorki, F. et al. (2008) 'An Approach for Modelling CO2 Emissions from Road Traffic in Urban Areas'. Science of the Total Environment, 406(1-2), pp. 269-278. DOI: 10.1016/j. scitotenv.2008.07.055. [ Links ]
La Notte, A., Tonin, S. and Lucaroni, G. (2018) 'Assessing Direct and Indirect Emissions of Greenhouse Gases in Road Transportation, Taking into Account the Role of Uncertainty in the Emissions Inventory.' Environmental Impact Assessment Review, 69, pp. 82-93. [ Links ]
Odhiambo, G.O. et al. (2010) 'Motor Vehicles Air Pollution in Nairobi, Kenya'. Research Journal of Environmental and Earth Sciences, 2(4), pp. 178-187. [ Links ]
Pandian, S., Gokhale, S. and Ghoshal, A.K. (2009) 'Evaluating Effects of Traffic and Vehicle Characteristics on Vehicular Emissions near Traffic Intersections'. Transportation Research Part D: Transport and Environment, 14(3), pp. 180-196. DOI: 10.1016/j.trd.2008.12.001. [ Links ]
Rahane, S.K. and Saharkar, U.R. (2014) 'Traffic Congestion - Causes And Solutions: A Study Of Talegaon Dabhade City'. Journal of Information, Knowledge and Research in Civil Engineering, 3(1), pp. 160-163. [ Links ]
Rajé, F., Tight, M. and Pope, F.D. (2018) 'Traffic Pollution: A Search for Solutions for a City like Nairobi'. Cities, 82(June), pp. 100-107. DOI: 10.1016/j.cities.2018.05.008. [ Links ]
Salon, D. and Gulyani, S. (2019) 'Commuting in Urban Kenya: Unpacking Travel Demand in Large and Small Kenyan Cities'. Sustainability (Switzerland), 11(14), pp. 1-22. DOI: 10.3390/su11143823. [ Links ]
Scherer, E. and Christoph, H. (2018) User Manual TrIGGER Tool. Available at: https://www.changing-transport.org/wp-content/uploads/2018_Manual_Technical_Report_TriGGER.pdf. [ Links ]
Singh, A. et al. (2021) 'Air Quality Assessment in Three East African Cities Using Calibrated Low-Cost Sensors with a Focus on Road-Based Hotspots'. Environmental Research Communications, 3(7). DOI: 10.1088/2515-7620/ac0e0a. [ Links ]
SLoCaT. (2019) Sustainable Transport: A Critical Driver to Achieve the Sustainable Development Goals SUSTAINABLE TRANSPORT: A CRITICAL DRIVER TO ACHIEVE THE SUSTAINABLE. Available at: https://slocat.net/wp-content/uploads/2020/02/SLOCAT_2019_transport_and_vnrs_2014-2019_final_version.pdf. [ Links ]
Song, Q. et al. (2018) 'Could Urban Electric Public Bus Really Reduce the GHG Emissions: A Case Study in Macau?' Journal of Cleaner Production, 172, pp. 2133-2142. DOI: 10.1016/j.jclepro.2017.11.206. [ Links ]
Wojuade, C.A. (2018) 'Contribution of Automobile to Climate Change in Africa'. JENRM, 1, pp. 78-85. [ Links ]
Zhang, K., Batterman, S. and Dion, F. (2011) 'Vehicle Emissions in Congestion: Comparison of Work Zone, Rush Hour and Free-Flow Conditions'. Atmospheric Environment, 45(11), pp. 19291939. DOI: 10.1016/j.atmosenv.2011.01.030. [ Links ]
Zhang, L. et al. (2019) A Review of China's Road Traffic Carbon Emissions. Elsevier B.V. DOI: 10.1016/j.jclepro.2018.10.003. [ Links ]
Zhang, L.D. and Zhu, W.X. (2017) 'Heterogeneous Traffic Flow System Carbon-Dioxide Emission Control'. Proceedings - 2017 Chinese Automation Congress, CAC 2017, 2017-Janua(1), pp. 535-539. DOI: 10.1109/CAC.2017.8242826. [ Links ]
Zheng, J. et al. (2020) 'Comparative Analysis of the CO2 Emissions of Expressway and Arterial Road Traffic: A Case in Beijing'. (2017), pp. 1-15. DOI: 10.1371/journal.pone.0231536. [ Links ]
Zhu, W.X. (2013) 'Analysis of CO2 Emission in Traffic Flow and Numerical Tests'. Physica A: Statistical Mechanics and Its Applications, 392(20), pp. 4787-4792. DOI: 10.1016/j.physa.2013.06.024. [ Links ]
 Correspondence:
Cynthia N. Sitati
sitaticynthia@gmail.com
Received: 13 October 2021
Reviewed: 13 November 2021
Accepted: 3 March 2022

