


Services on Demand
Article
 English (pdf)
 Article in xml format
 Article references
Indicators

Related links
-
 Cited by Google
 -
 Similars in Google
Share

 Permalink
Clean Air Journal
On-line version ISSN 2410-972X
Print version ISSN 1017-1703
Clean Air J. vol.31 n.2 Pretoria 2021
http://dx.doi.org/10.17159/caj/2020/31/2.11980
RESEARCH ARTICLE
Source apportionment of ambient fine and coarse aerosols in Embalenhle and Kinross, South Africa
Nicola M. WaltonI, *; Stuart J. PikethI; Pietervan ZylII; Willy MaenhautIII; Roelof BurgerI; Brigitte LanguageI; Paola FormentiIV
IUnit for Environmental Sciences and Management, North-West University, Potchefstroom, South Africa
IIChemical Resource Beneficiation, North-West University, Potchefstroom, South Africa
IIIGhent University (UGent), Department of Chemistry, Krijgslaan 281, S12, BE-9000 Gent, Belgium
IVUniversité de Paris and Univ Paris Est Cretéil, CNRS, LISA, F-75013 Paris, France
ABSTRACT
The South African Highveld is recognised as a region having significant negative ambient air quality impacts with its declaration as an Air Quality Priority Area in 2007. Such areas require the implementation of specific air quality intervention strategies to address the air quality situation. A greater understanding of the composition of the atmospheric aerosol loading and the contributing air pollution sources will assist with the formulation and implementation of these strategies. This study aims to assess the composition and sources of the aerosol loading in Embalenhle and Kinross located on the Highveld. Fine (PM2.5) and coarse (PM.25-10) aerosol samples were collected during summer and winter, which were quantified by gravimetry. Wavelength-Dispersive X-Ray Fluorescence (WD-XRF) spectrometry and Ion Chromatography (IC) analysis were applied to determine the chemical compositions of aerosol samples on filters. Mean PM2.5 concentrations in Embalenhle and Kinross ranged from 16.3 to 34.1 ug/m3 during winter and 7.4 to 19.0 ug/m3 during summer. Mean PM2.5-10 concentrations ranged from 10.3 to 114 ug/m3 during winter and 5.9 to 11.2 μg/m3 during summer. Si, Al, S, SO42- and NH4+ were the most abundant species in PM2.5 during both seasons. The elements Na and Ca were also abundant at both sites during winter and summer, respectively. In PM2.5-10, Si, Al, SO42- and F- were the most abundant species during both seasons. The element Na was also abundant at both sites during winter with S and Ca also having high abundances at Embalenhle and Kinross, respectively, during summer. Source apportionment was performed by Positive Matrix Factorisation (PMF), which resolved five sources. Dust, secondary aerosols, residential combustion, wood and biomass burning, and industry were determined to be the contributing sources. Any measures to mitigate particulate air pollution on the Highveld should consider these key sources.
Keywords: Particulate matter, source apportionment, positive matrix factorisation, backward trajectories.
Introduction
South Africa, and especially the industrialised Highveld, is a significant anthropogenic and natural aerosol region of the southern Hemisphere (Held, 1996). South Africa has one of the three largest industrialised economies on the African continent and boasts significant mining and metallurgical industries (Venter et al., 2012). It is the largest regional energy producer on the continent, generating most of the electricity in coal-fired power plants (Tiitta et al., 2014; Josipovic et al., 2019). The Highveld region has been recognised as a region having significant negative ambient air quality impacts and as such, was declared an Air Quality Priority Area on 23 November 2007. Power generation activities are located on the Highveld close to extensive coalfields. Other significant emission sources include household fuel burning, motor vehicles, heavy industries and mining activities (DEA, 2012).
Exposure to elevated concentrations of fine particulate matter is of significant health concern in several regions of South Africa (Altieri and Keen, 2019). The adverse human health effects associated on exposure to elevated levels of particulate matter have been well documented by the World Health Organisation (WHO). They include a range of acute and chronic respiratory and cardiovascular effects, irreversible changes in physiological function (e.g., lung function) and premature mortality (WHO, 2006). There is a need to develop strategies to improve the air quality and diminish the health risks associated with airborne particulate matter. A greater understanding of the composition of the atmospheric aerosol loading and the contributing air pollution sources is an essential step to achieving this.
Source apportionment is used to identify air pollution sources and to quantify their contribution to ambient pollution levels in an airshed (Belis et al., 2014). Different source assessment methods include emission inventories, dispersion models and receptor models (Viana et al., 2008; Belis et al., 2014). Receptor models commonly utilised include, amongst others, Positive Matrix Factorisation (PMF) and Chemical Mass Balance (CMB). A key determinant in selecting an appropriate model for a particular airshed is the degree of knowledge required about the contributing sources, prior to the application of a receptor model (Viana et al., 2008). Multivariate models such as PMF require less knowledge of the contributing sources, while CMB requires detailed understanding of the sources and their compositions.
Within South Africa, several aerosol source apportionment studies have been undertaken to understand aerosol characteristics and their attributions. Annegarn et al. (1998) used the CMB model to apportion particulate matter to sources in Soweto township in the Gauteng Province. The CMB model was also applied to studies in the Vaal Triangle in the Gauteng Province (Engelbrecht et al., 1996a, 1998), Qalabotjha in the Free State Province (Engelbrecht et al., 2002). Olifantsfontein on the Highveld (Engelbrecht et al., 1996b) and Nelspruit in the Mpumulanga Province (Engelbrecht et al., 1996c). However, only a few studies have applied the PMF model. Tiitta et al. (2014) used PMF to characterise the organic aerosol properties of aerosol mass spectra from a grassland site in the North West Province (Welgegund). More recently, Tshehla and Djolov (2018) used PMF to apportion sources of particulate matter from an industrialised rural area (Steelpoort and surrounding areas) in the Limpopo Province. The primary sources identified from source apportionment studies in South Africa include mineral dust, industry, residential fuel burning, sea salt and biomass burning (Maenhaut et al., 1996; Annegarn et al., 1998; Piketh et al., 1999; Engelbrecht et al., 2002). However, for the most part, such studies are limited in South Africa, with additional research required to understand other aerosol sources and their contributions (Mathuthu et al., 2019).
This study aims to identify the air pollution sources contributing to the aerosol loading at two residential areas located on the Highveld, i.e., Embalenhle and Kinross, as well as to apportion their contribution to the aerosol loading by applying the PMF model.
Materials and methods
Site description
The Highveld Priority Area (HPA) covers an area of 31 106 km2 and forms part of South Africa's elevated inland plateau. The terrain of the HPA is relatively flat, ranging from approximately 1400 m above sea level in the north-west to 1900 m above sea level in the southeast. The HPA experiences a temperate climate with warm, wet summers and cool, dry winters.
Aerosol sampling was undertaken at two sites in the HPA, namely, Embalenhle and Kinross in the Mpumalanga Province (Figure 1). Sampling was undertaken at Embalenhle school (-26.535 °S, 29.073 °E) and Kinross (-26.435 °S, 29.057 °E in summer and -26.415 °S, 29.070 °E in winter). Embalenhle is a low-income residential area, approximately 8 km to the west of the town of Secunda. Kinross is a low-density residential area located about 12 km north of Embalenhle. Kinross was selected as an upwind sampling site to determine any other additional significant contributing sources in the area (other than emissions from Embalenhle).
Both residential areas are located close to a major petrochemical refinery and associated open-cast mining activities. Matla and Kriel coal-fired power stations are located approximately 27 km and 30 km, respectively, to the north of these two sites. Based on the Census 2011, domestic fuels such as coal, wood and paraffin continue to be used in Embalenhle even though most households are electrified.
Aerosol sampling
Aerosol sampling was undertaken during winter from 15 to 31 July 2016 and 5 to 17 August 2016 and during summer from 14 to 28 February 2017 at Embalenhle and Kinross.
Sampling was undertaken using the 'Gent' stacked filter unit (SFU) sampler (Maenhaut et al., 1994; Hopke et al., 1997). The sampler collects particles with an aerodynamic diameter (AD) < 10 μm in separate coarse and fine fractions. The coarse fraction corresponds to aerosols collected with an AD between 10 and 2.5 μm, while the fine fraction corresponds to aerosols collected with an AD < 2.5 μm. Two 47-mm Nuclepore® polycarbonate filters with pore diameters of 8.0 μm and 0.4 urn are sequentially used during sampling. The flow rate was set to 16 L/min. The filters were weighed prior to and after sampling using an XP26 DeltaRange Microbalance (Mettler-Toledo AG, Greifensee, and CH), to determine the deposited gravimetric mass after 12 hours of exposure. Samples were collected twice a day, from approximately 10:00 - 22:00 and 22:00 - 10:00 to capture the bimodal concentration peak. After sampling, the Nuclepore® filters were stabilised for 24 hours in a temperature and humidity-controlled environment, prior to weighing and then placed in a stabilised environment prior to chemical analysis. Blanks were also collected during both sampling campaigns, comprising 10% of the total collected samples during each campaign.
Chemical analyses
Elemental Analysis
Wavelength-Dispersive X-Ray Fluorescence (WD-XRF) spectrometry analysis was performed using a Panalytical Axiosmax spectrometer. This instrument implemented sequential sampling of the selected element and has a rhodium anode x-ray tube with a 4 kW generator. The system uses helium gas as a medium within the analysis chamber. An area with a 20 mm diameter was analysed on each sampled filter. MICROMATTER™ calibration standards were used for calibration purposes, which are National Institute of Standards and Technology (NIST) traceable reference materials. These standards have a Nuclepore® polycarbonate aerosol membrane backing mounted in a 25 mm ring mount. Each element had two calibration points, i.e., a very light standard ranging between 3 - 8 ug.cm-2 and a heavier standard ranging between 40 - 60 ug.cm-2.
Elements determined using SuperQ software included: sodium (Na), magnesium (Mg), aluminium (Al), silicon (Si), phosphorus (P), sulphur (S), chlorine (Cl), potassium (K), calcium (Ca), titanium (Ti), vanadium (V), chromium (Cr), manganese (Mn), iron (Fe), nickel (Ni), zinc (Zn) and lead (Pb). All measurements were corrected by the average of the blank values from each campaign.
Ionic Analysis
Ion chromatography (IC) analysis of the water-soluble aerosol fraction was undertaken with a Dionex ICS-3000 system consisting of two flow lines (Conradie et al., 2016). One flow line was used to detect anion species and the other flow line for cation species. Before chemical analysis was commenced, the filters were leached in 10 mL de-ionised water in an ultrasonic bath for 30 min. A five-point calibration from 20 ppb to 500 ppb, was conducted using certified stock solutions obtained from Industrial Analytical (Muyemeki et al., 2021). Ionic species determined included: fluoride (F-), chloride (Cl-), nitrate (NO3-), sulphate (SO42-), sodium (Na+), ammonium (NH4+), potassium (K+), calcium (Ca2+), magnesium (Mg2+) and the organic acids, formic, acetic and oxalic acid. All measurements were corrected by the average of the blanks from each campaign.
Meteorological data
Temperature, relative humidity and rainfall data were obtained from the South African Weather Services' weather station in Secunda (-26.497 °S; 29.186 °E), while wind speed and wind direction were retrieved from the ambient air quality monitoring station operated by Sasol in Embalenhle (-26.552 °S; 29.112 °E).
Positive matrix factorisation
PMF is a multivariate factor analysis technique that deconstructs a matrix of speciated sample data into two matrices: factor contributions and factor profiles (Norris et al., 2014). The PMF model equation can be expressed as follows:

where Xij is the concentration of species j measured on sample i; p is the number of factors contributing to the samples; fkj is the concentration of species j in factor profile k; gik is the relative contribution of factor k to sample i, and e is the error of the PMF model for the species j measured on sample i.
In this paper, source apportionment was undertaken using the EPA PMF 5.0 software package (Norris et al., 2014). Model input included receptor (ambient) concentrations and realistic uncertainties. For the ambient files, the water-soluble ionic form instead of the elemental form was retained for Cl-, Na+ and K+. K+ was selected over K as a better biomass burning tracer species. Species that were below the detection limit (BDL) in all samples collected were excluded from further analysis. Negative values in the dataset were recognised as BDL values and were replaced by half of the method detection limit (MDL). The corresponding uncertainties were calculated as (5/6) x MDL (Polissar et al., 1988). The MDL for each element was defined as three times the standard deviation of the average values of the blank filters (Barbaro et al., 2019) (supplementary Table 1). For concentrations greater than the MDL, uncertainties were calculated using the formula (Norris et al., 2014):

Three to six PMF factors were evaluated in the model. Each of these models was run 100 times using randomised seeds. The final solution was selected on the basis of the interpretability of the factors and the results of the model error estimation methods. Source types were assigned to each PMF factor based on known indicator species and by comparison to known source profiles from the USEPA's SPECIATE database (USEPA, 1999). It is recognised that source profiles vary considerably across different regions of the world and where available, comparison was made with local source profiles (Engelbrecht et al., 2000, 2001, 2002).
Particulate mass was included in the PMF model as a 'total variable'. In this study, the reconstructed particulate mass was used in the PMF model instead of the measured gravimetric mass as this produced a more stable solution. Reconstruction of the gravimetric mass included the following aerosol components: (1) inorganic ions of SO42-, NO3- and NH4+; (2) geological minerals = 2.20 Al + 2.49 Si +1.63 Ca + 1.94 Ti + 2.42 Fe known as the IMPROVE 'soil' formula; (3) sea salt, estimated as Cl + 1.4486 Na, where 1.4486 is the ratio of the concentration of all elements except Cl in sea water to the Na concentration in sea water (Maenhaut et al., 2002); (4) trace elements (excluding S and geological minerals) summed in their elemental form; (5) remaining mass or 'others', which was assumed to be non-crustal K based on the formula K - 0.6 Fe (Maenhaut et al., 2002), the sum of organic acids (Putaud et al., 2000) and other species unaccounted for. The detailed methodology is outlined in Chow et al. (2015).
Air mass trajectory analysis
For each sampling campaign, the air mass history was analysed using back trajectories calculated with the HYbrid Single-Particle Lagrangian Integrated Trajectory (HYSPLIT) version 4.8 modelling software This software was developed by the National Oceanic and Atmospheric Administration (NOAA) Air Resources Laboratory (ARL) (Stein et al., 2015; Rolph et al., 2017). The model was run with the GDAS meteorological archive (spatial resolution of 1° x 1°) produced by the US National Weather Service's National Centre for Environmental Prediction and archived by ARL (Air Resources Laboratory, 2012). Individual 72-hour back trajectories for air masses at an arrival height of 100 m above ground level were calculated. The geomorphology in HYSPLIT is not well defined therefore an arrival height of 100 m above ground level was selected as lower arrival heights could result in increased error margins on single trajectory calculations (Tiitta et al., 2014). Errors for individual trajectories range from 15 to 30% of the back trajectory distance travelled (Stohl, 1998; Riddle et al., 2006). The individual trajectories were then grouped into clusters of similar air mass origins using the trajectory cluster analysis tool in the HYSPLIT model. The number of clusters retained was determined by the percent change in the total spatial variance (TSV) whereby a significant increase in the change of TSV indicates that 'different' rather than 'similar' clusters are being paired (Draxler et al., 2020).
Results and discussion
Meteorological conditions
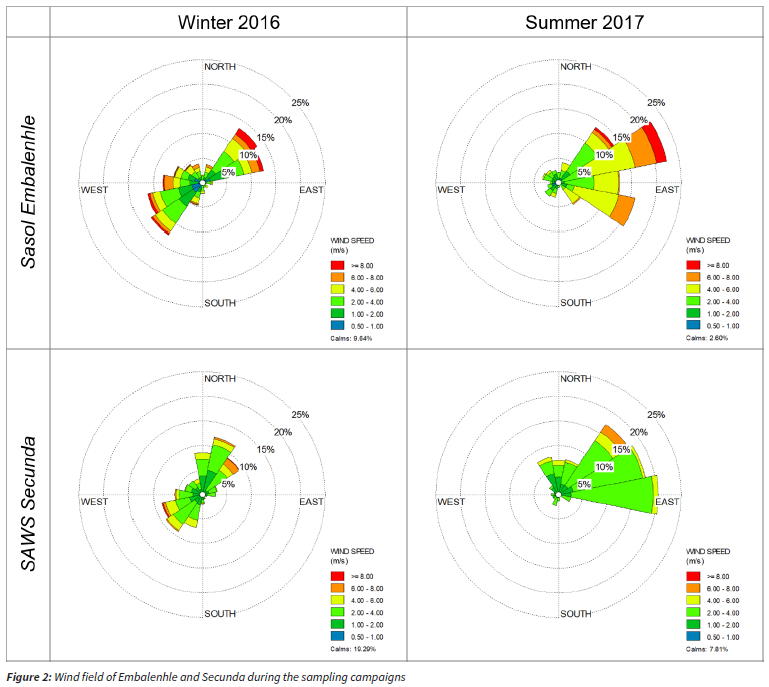
During the winter sampling campaign in 2016, a high-pressure system dominated most of the sampling period, resulting in sunny and cool to warm conditions. Daily average temperatures ranged from -1.0 °C to 26.2 °C. From 24 to 27 July 2016, an upper-air cut-off low prevailed, resulting in rainfall and a subsequent reduction in aerosol concentrations. Winds were moderate to fast and originated predominantly from the northeasterly and southwesterly sectors (Figure 2).
A low-pressure surface trough prevailed for most of the summer sampling campaign in 2017. For the first few days of the sampling campaign, a tropical storm to the east of the country resulted in rain in Embalenhle on 14 February 2017. Rainfall was also experienced from 19 - 25 February 2017. Rainfall is one of the main mechanisms for scavenging aerosol particles from the atmosphere (Zheng et al., 2019). Daily average temperatures were warm to hot and ranged from 11.9 °C to 30.2 °C. Surface winds remained moderate to high, with winds originating mainly from the northeast, east-northeast and east (Figure 2).
Long-range transport clusters
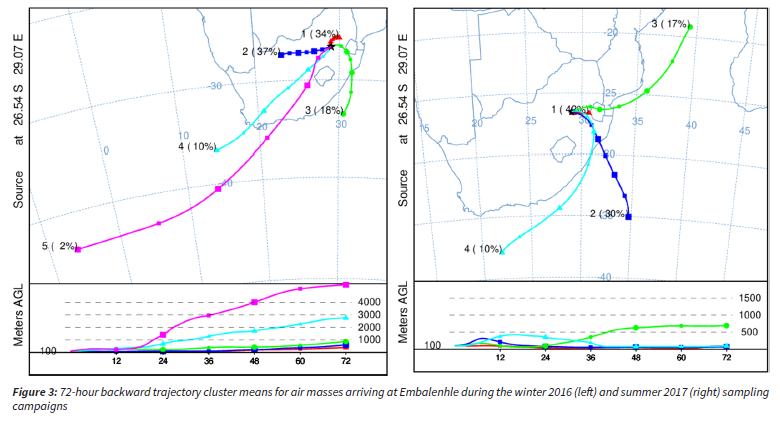
Two dominant low-level air masses influenced the area during winter (Figure 3). Air mass 1 (accounting for 37% of the trajectories) originated from the west and passed over the mining areas of the western Bushveld Igneous Complex in the North-West Province. A significant portion of the global ferrochromium and platinum group metals is produced in this region (Venter et al., 2016). Air mass 2 (accounting for 34% of the trajectories) originated from the northeast via a short pathway. This air mass passed over the Mpumalanga Highveld before arriving at the sites.
The remaining three high-level trajectories (together accounting for 30% of the trajectories) originate from the Atlantic and Indian Oceans.
During summer, four air masses were identified (Figure 3). Air mass 1, originating via a short pathway from the east, was the dominant air mass and accounts for 43% of the trajectories. The remaining three trajectories (accounting for 30%, 17% and 10% of the trajectories) originated from the Atlantic and Indian Oceans.
Gravimetric concentrations
The ambient mass concentrations measured in the two size fractions at Embalenhle and Kinross during the sampling campaigns are presented in Figure 4. It is evident that the median PM2.5 and PM2.5-10 concentrations are higher at Embalenhle than the upwind site of Kinross during both seasons. This indicates the contribution of localised air pollution sources in the township, especially during the winter months when residential fuel burning is most widespread.
During winter, median PM2.5 concentrations were 32.5 μg/m3 and 15.6 μg/m3 at Embalenhle and Kinross, respectively, decreasing to 16.9 ug/m3 and 5.6 ug/m3 at Embalenhle and Kinross, respectively, during summer. Median PM2.5-10 concentrations were substantially higher at Embalenhle during winter (87.6 μg/ m3), decreasing to 5.4 μg/m3 during summer. At Kinross, median PM2.5-10 concentrations of 5.3 ug/m3 and 3.5 ug/m3 were recorded during winter and summer, respectively.
The seasonal difference in aerosol concentrations is reflective of the changes in source emission strength and the prevailing meteorological conditions during each season.
Chemical composition
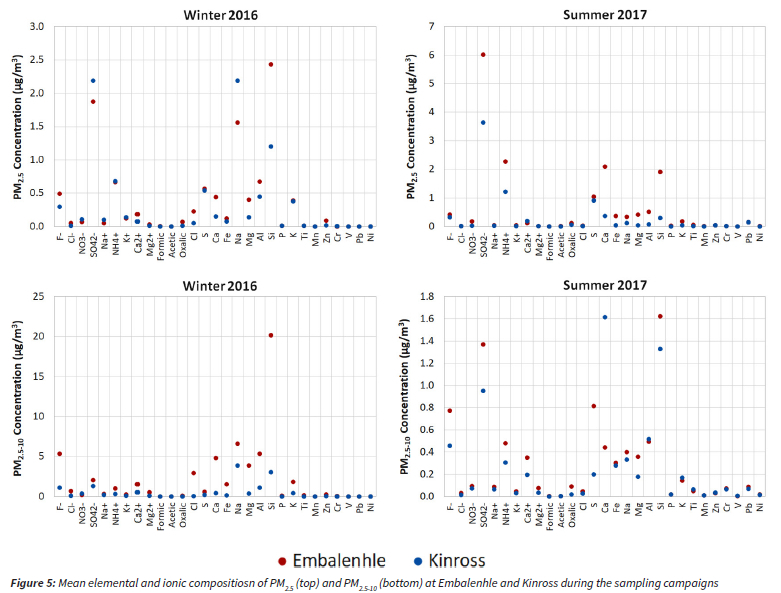
The elemental and ionic composition of PM2.5 and PM2.5-10 at each site during winter and summer are graphically represented in Figure 5. The mean concentrations and standard deviations are numerically presented in supplementary Tables 2 and 3. Spearman correlation coefficients are numerically given in supplementary Tables 4 - 11.
Elemental
The elements Si, Al and S were the dominant species at Embalenhle and Kinross during both seasons in PM2.5. Na was also abundant at both sites during winter and Ca during summer. Strong correlations are seen between Si, Ca, Fe, Na, Mg, Al and Ti suggesting either a crustal origin or coal combustion origin of these species (Maenhaut et al., 1996). The abundance of Ca and Na has also been reported by Venter et al. (2017) in trace metal concentrations at Welgegund in the North-West Province. The abundance of S, as well as the strong correlations seen with the secondary species, SO42- and NH4+, indicates that coal combustion is an important source at these sites. Coal is used as a residential fuel in Embalenhle and a petrochemical plant is located to the immediate right of Embalenhle. Several coal-fired power stations are also present in the region, with Kriel Power Station and Matla Power Station the closest to Kinross. Back trajectory analysis shows that the sites are impacted by air masses from the Highveld region as well as from air pollution sources in the western Bushveld Igneous Complex during winter (Figure 3).
In PM2.5-10, Si, Na and Al were the most abundant elements at Embalenhle and Kinross during winter. Contributions from Si and Al remained high during summer with S and Ca also abundant at Embalenhle and Kinross, respectively. Strong correlations between Al, Si, Ca, Fe and Mg indicate a dominant crustal origin of these species.
Heavy metals such as V, Ni, Cr and Zn are also present in low abundances in the datasets. V and Ni can be associated with the petrochemical industry (Bosco et al., 2005; de la Campa et al., 2011) and oil combustion sources (Moreno et al., 2010; Viana et al., 2008). Zn and Cr can also originate from waste burning and motor vehicles (de Bruin et al., 2006; Pant and Harrison, 2012).
Ionic
SO42- and NH4+ were the most abundant species in PM25. This has also been seen in a number of studies undertaken at various sites in South Africa (Tiitta et al., 2014; Conradie et al., 2016; Venter et al., 2018; Muyemeki et al., 2021). These species are strongly correlated at both sites, again indicating a common secondary origin, such as coal combustion, of these species.
The species K+, an excellent tracer for wood and biomass burning (Zhang et al., 2013; Yu et al., 2016), is present in higher abundances during winter, as also observed by Venter et al. (2018) at Welgegund. This is consistent with the fire burning season, which reaches maximum intensity in South Africa in September (Scholes et al., 1996a and b). Aurela et al. (2016) found that the chemical composition of fresh biomass burning plumes was comprised mainly of SO42-, OC, EC, NH4+ and K+ in the fine fraction, while Na+, Cl-, NO3- and oxalate were divided between the fine and coarse fractions. K+ was in the form of potassium chloride (KCl) in fresh smoke. K+ is correlated with Na+ in both size fractions at Embalenhle and Kinross, as well as Cl-, NO3-, SO42- and NH4+ in some of the datasets, supporting a contribution from wood and biomass burning.
The presence of Cl- in the datasets can also originate from coal combustion, waste burning (Liu et al., 2017; Yang et al., 2018) and sea salt (Vasconcellos et al., 2007). While air masses originating from the Indian and Atlantic Oceans are evident in the back trajectory analysis (Figure 3), Cl- and Na+ are poorly correlated in most of the datasets which does not support a significant marine source of these species.
In PM2.5-10, SO42- and F- are the most abundant species at both sites during both seasons. High abundances of Ca2+ and NH4+ are also seen during winter and summer, respectively. During both seasons, SO42- is strongly correlated with NH4+ and moderately correlated with NO3- at Embalenhle and Kinross. F- shows good correlations with various species such as SO42-, K+, Mg, Al and Si which can be associated with coal combustion, wood and biomass burning, soil dust and industry.
Ratios of NO3-/SO42- can be used to evaluate the sources of these two ionic species (Gao et al., 1996). NO3-/SO42- ratios > 1 indicate a greater contribution of NO3- from vehicle emissions while NO3-/ SO42-- ratios < 1 indicate a significant contribution of SO 2- from industrial activities. Mean NO3-/SO42- ratios for both sites indicate that industrial activities are the dominant source of these species during both seasons (Table 1).

SO42- and NH4+ abundances are significantly higher during summer compared to winter. During summer, the increase in relative humidity favours SO42- production (Aurela et al., 2016; Shikwambana and Sivakumar, 2019). The prevailing wind field, combined with the high contribution of these species in the coarse fraction, suggests emissions from neighbouring coal-fired power stations are impacting Embalenhle and Kinross.
Comparison of measured concentrations
For contextualisation of the elemental and ionic concentrations measured at Embalenhle (and Kinross), the findings have been compared to concentrations measured in Zamdela in the Free State Province (Muyemeki et al., 2020) (Table 2). Similar to Embalenhle, Zamdela is a low-income township and is also located within a Priority Area, the Vaal Triangle Airshed Priority Area. The township is also located close to petrochemical activities.
In PM2.5, Fe was the most abundant species at Zamdela during the winter which is likely due to ferromanganese (FeMn) activities in the area (Venter et al., 2017). This is also seen in the higher Mn recorded at Zamdela compared to the minor contribution at the two Highveld sites. Si, which was the most abundant PM2.5 species at Embalenhle during the same season, was significantly lower at Zamdela. Na concentrations at the two Highveld sites were substantially higher than those recorded at Zamdela during winter. Na concentrations remained high at Embalenhle during summer while Kinross and Zamdela showed similar concentrations.
K+ concentrations were higher at Zamdela compared to the two Highveld sites suggesting a stronger influence of wood and biomass burning at this site.
The heavy metals, Cr and Ni, were considerably higher at Zamdela with Zn and V also higher than Embalenhle and Kinross. This is likely due to the stronger industrial influence in the Vaal Triangle.
The secondary species, SO42- and NH4+, were seen to be abundant at all three sites during both seasons. However, SO42- and NH4+ concentrations were over double those at Embalenhle and Kinross during winter, although summer concentrations were similar at Embalenhle. S concentrations were also higher than those reported for the Highveld sites during both seasons.
In PM2.5-10, Si was the most abundant species at both the Highveld and Zamdela sites (with the exception of Na and Ca at Kinross in winter and summer, respectively). Al concentrations were similar at Embalenhle and Zamdela during winter but lower at Embalenhle during summer.
SO42- and NH4+ concentrations were higher at Zamdela compared to the Highveld sites, during both seasons. However, F- concentrations at Zamdela were lower during both seasons. F- concentrations at Embalenhle were almost double those measured at Zamdela during winter.
Source apportionment
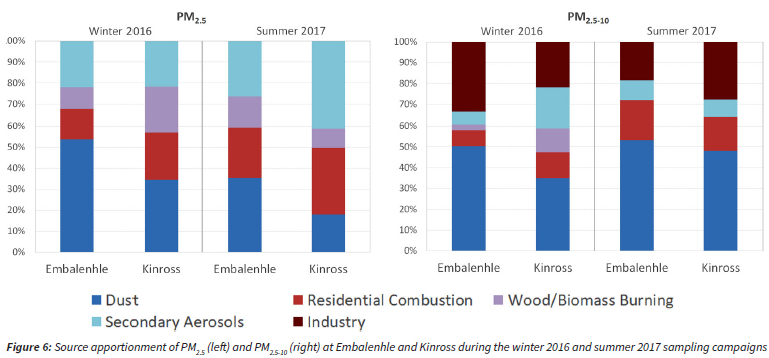
The PMF model identified dust, residential combustion, secondary aerosols, wood and biomass burning, and industry as the main sources contributing to the aerosol loading in Embalenhle and Kinross. The source apportionment results are shown in Figure 6. Four and five factor profiles were identified to be the most representative in the fine and coarse fraction, respectively.
Fine fraction
A dust profile was identified by the presence of traditional soil elements such as Ca, Mg, Si, Al, Fe, Ti and Mn. This profile accounted for 55% and 42% of the reconstructed PM2.5 mass concentrations at Embalenhle and Kinross, respectively, during winter and 35% and 18% during summer. The dust contribution at Embalenhle during winter is overestimated and likely represents a mixed dust and coal combustion profile, given the similarity of the species in each source. This has been confirmed through CMB modelling for the site (not given in this paper), which shows both a dust (~22%) and coal combustion (~38%) contribution.
Residential combustion is distinguished by the presence of Cl-, Zn, Na+, NH4+ and K+ in the profiles. Zn can be emitted from the burning of waste while the presence of K+ can be attributed to the burning of unsorted domestic and garden waste (Muyemeki et al., 2020). Residential combustion accounts for 12 to 13% (winter) and 9 to 24% (summer) of the reconstructed PM25 mass concentrations at both sites.
A secondary inorganic aerosol profile is detected by the presence of secondary species such as SO42-, NH4+, and NO3- (Crilley et al., 2017). Secondary aerosols are found predominantly in the fine fraction and contribute to 22% and 25% of the reconstructed PM2.5 mass concentrations at Embalenhle and Kinross, respectively, during winter. During summer, the contribution increases to 26% and 41%, respectively, due to the increase in relative humidity during this season. Coal combustion is the dominant source of secondary aerosols as the burning of coal releases significant quantities of the precursor gases, SO2, NOx and NH3, which then oxidise into secondary particles (Watson et al., 1994).
A wood and biomass burning profile, identified by the abundance of K+ as well as Cl-, SO42-, NO3-, NH4+, Na+ and organic acids. Wood is also used as a residential fuel in Embalenhle although to a much lesser degree than coal. This source accounted for 11% and 20% of the reconstructed PM25 mass concentrations at Embalenhle and Kinross, respectively, during winter. During summer, this source contribution is 14% and 32%.
Coarse fraction
In the coarse fraction, dust accounted for 35 to 51% of the reconstructed PM2.5-10 mass concentrations during winter and 46 to 50% during summer, at both sites. This source represents both a natural (wind-blown) and anthropogenic component of dust. Elements such as Zn, V, Pb, Ni and Cr are also seen in the profiles which can be associated with resuspended dust from paved and unpaved roads. Zn, Pb, Ni and Cr are associated with dust from tyre wear and braking (Adachia and Tainoshob, 2004; Hjortenkrans et al., 2007) while V could also originate from neighbouring industrial activities.
Residential combustion contributes to 9 to 13% (winter) and 14 to 23% (summer) of the reconstructed PM2.5-10 mass concentrations at both sites.
Secondary aerosols account for 4% and 19% at Embalenhle and Kinross, respectively, during winter and 10% and 9%, respectively, during summer.
A wood and biomass burning profile is only seen at Embalenhle (2%) and Kinross (11%) during winter.
Industrial activities are also identified in the coarse fraction with the presence of SO42-, NH4+, S, Al, Si and the heavy metals, Cr, V, Ni and Pb. Industry contributes to 33% and 22% of the reconstructed PM2.5-10 mass concentrations at Embalenhle and Kinross, respectively, during winter and 18 to 32% during summer. The presence of V and Ni indicates a contribution from the neighbouring petrochemical plant with coal-fired power stations also contributing, especially during summer.
Conclusions
Aerosol sampling undertaken at Embalenhle and Kinross during winter and summer shows Si, Al, S, SO42- and NH4+ to be the most abundant PM2.5 species during both seasons. The elements Na and Ca were also abundant at both sites during winter and summer, respectively. In PM2.5-10, Si, Al, SO42- and F- were the most abundant species during both seasons. The element Na was also abundant at both sites during winter with S and Ca also having high abundances at Embalenhle and Kinross, respectively, during summer.
PMF modelling provided an assessment of dust (natural and anthropogenic), residential combustion, secondary aerosols, wood and biomass burning, and industry as the primary sources contributing to the aerosol loading in Embalenhle and Kinross. Of these, dust and secondary aerosols are the most significant contributors. Emissions from neighbouring industrial activities are also seen to influence the air quality in these two areas. Emission reduction measures to be implemented in the region should consider these sources.
It is noted that the findings of this study are based on two short-term sampling campaigns. As such, the findings of this paper are not necessarily representative of the entire winter and summer seasons. Aerosol concentrations are influenced by various factors such as meteorological conditions and emission source strengths which show considerable spatial and temporal variability.
Acknowledgements
The authors wish to acknowledge the South African Weather Services for providing the meteorological data. NOAA ARL is acknowledged for the provision of the HYSPLIT transport and dispersion model and/or READY website.
Collection of aerosol data from the sampling sites was made possible through the loan of the 'Gent' SFU samplers from Professor Willy Maenhaut at Ghent University.
Jan-Stefan Swartz and Belinda Venter are thanked for performing the IC and XRF analyses, respectively, at the North-West University. Andrew Venter is acknowledged for his assistance in the chemical preparation procedures.
Author contributions
Nicola Walton analysed the data for Embalenhle and Kinross, applied the PMF model to the datasets and drafted this paper. This manuscript was reviewed by each of the authors listed above.
References
Adachia, K and Tainoshob, Y., 2004: Characterization of heavy metal particles embedded in tire dust, Environment International, 30: 1009-1017. https://doi.org/10.1016/j.envint.2004.04.004 [ Links ]
Altieri, K.E. and Keen, S.L. 2019, Public health benefits of reducing exposure to ambient fine particulate matter in South Africa, Science of the Total Environment, 684:610-20. https://doi.org/10.1016/j.scitotenv.2019.05.355 [ Links ]
Annegarn, H.J., Grant, M.R., Kneen, M.S. and Scorgie. Y. 1998, Direct Source Apportionment of Particulate Pollution within a Township, Low Smoke Coal Programme, Department of Minerals and Energy, South Africa. [ Links ]
Aurela, M., Beukes, J.P., Van Zyl, P., Vakkari, V., Teinilä, K., Saarikoski, S and Laakso, L. 2016, The composition of ambient and fresh biomass burning aerosols at a savannah site, South Arica, South African Journal of Science, 112: 55-62. http://dx.doi.org/10.17159/sajs.2016/20150223 [ Links ]
Barbaro, E., Feltracco, M., Cesari, D., Padoan, S., Zangrando, R., Contini, D., Barbante, C and Gambaro. A. 2019, Characterization of the water soluble fraction in ultrafine, fine, and coarse atmospheric aerosol, Science of the Total Environment, 658: 1423 - 1439. https://doi.org/10.1016/jj.scitotenv.2018.12.298 [ Links ]
Belis, C.A., Larsen, B.R., Amato, F., El Haddad, I., Favez, O., Harrison, R.M., Hopke, P.K., Nava, S., Paatero, P., Prévôt., Quass, U., Vecchi, R and Viana, M. 2014, European Guide on Air Pollution Source Apportionment with Receptor Models, JRC Reference Report, EUR 26080, Luxembourg. [ Links ]
Bosco, M.L., Varrica, D and Doongarra, G. 2005, Case study: inorganic pollutants associated with particulate matter from an area near a petrochemical plant, Environmental Research, 99, 18-30. https://doi.org/10.1016/jJ.envres.2004.09.011 [ Links ]
Chow, J.C., Lowenthal, D.H., Antony Chen, L.-W., Wang, X and Watson, J.G. 2015, Mass reconstruction methods for PM2.5: a review, Air Quality, Atmosphere and Health, 8:243-263 http://doi.org/10.1007/s11869-015-0338-3 [ Links ]
Conradie, E.H., Van Zyl, P.G., Pienaar, J.J., Beukes, J.P., Galy-Lacaux, C., Venter, A. and Mkhatshwa, G.V. 2016, The chemical composition and fluxes of atmospheric wet deposition at four sites in South Africa, Atmospheric Environment, 146: 113 - 131. https://doi.org/10.1016/j.atmosenv.2016.07.033 [ Links ]
Crilley, L.R., Lucarelli, F., Bloss, W.J., Harrison, R.M., Beddows, D.C., Calzolai, G., Nava, S., Valli, G., Bernardoni, V and Vecchi, R. 2017, Source apportionment of fine and coarse particles at a roadside and urban background site in London during the 2012 summer ClearfLo campaign, Environmental Pollution, 220, 766778. https://doi.org/10.1016/j.envpol.2016.06.002 [ Links ]
de Bruin Y.B., Koistinen K., Yit-Tuomi T., Kephatopoulos S and Lantunen M., 2006: A review of Source Apportionment Techniques and Marker substances available for identification of personal exposure, Indoor and Outdoor sources of Chemicals. European Commission, Directorate General, Joint Research Centre, EUR 22349EN. [ Links ]
De la Campa, A.S., Moreno, T., De La Rosa, J., Alastuey, A and Querol, X. 2011, Size distribution and chemical composition of metalliferous stack emissions in the San Roque petroleum refinery complex, southern Spain, Journal of Hazardous Matter, 190(1-3), 713-722. https://doi.org/10.1016/jjhazmat.2011.03.104 [ Links ]
Department of Environmental Affairs (DEA). 2012, Highveld Priority Area Air Quality Management Plan, Pretoria, Republic of South Africa. [ Links ]
Draxler, R.R. and Rolph, G.D. 2012, HYSPLIT (HYbrid Single-Particle Lagrangian Integrated Trajectory) Model access via NOAA ARL READY Website (http://ready.arl.noaa.gov/HYSPLIT.php), NOAA Air Resources Laboratory, Silver Spring, MD. [ Links ]
Draxler, R., Stunder, B., Rolph, G., Stein, A. and Taylor, A. HYSPLIT5 User's Guide Version 4-Last Revision: April 2020 [Internet]. Silver Spring, Md; 2020. Available from: https://www.arl.noaa.gov/documents/reports/hysplit_user_guide.pdf. [ Links ]
Engelbrecht, J.P., Swanepoel, L., Chow, J.C., Watson, J.G. and Egami, R.T. 2002, The comparison of source contributions from residential coal and low-smoke fuels, using CMB modeling, in South Africa, Environmental Science & Policy, 5 (2): 157-167. https://doi.org/10.1016/S1462-9011(02)00029-1 [ Links ]
Engelbrecht, J.P., Swanepoel, L., Chow, J.C., Watson, J.G. and Egami, R.T. 2001, PM2.5 and PM10 concentrations from the Qalabotjha low-smoke fuels macro-scale experiment in South Africa, Environmental Monitoring and Assessment, 69(1): 1-15. https://doi.org/10.1023/A:1010786615180 [ Links ]
Engelbrecht, J.P., Swanepoel, L., Zunckel, M., Chow, J.C., Watson, J.G. Egami, R.T. 2000, Modelling PM10 aerosol data from the Qalabotjha low-smoke fuels macro-scale experiment in South Africa, Ecological Modelling, 127: 235-244. https://doi.org/10.1016/S0304-3800(99)00212-4 [ Links ]
Engelbrecht, J.P., Reddy, V.S., Swanepoel, L. and Mostert, J. C. 1998: Aerosol monitoring and source apportionment in the Vaal Triangle, Special Publication No. 17, Mintek, Randburg, South Africa, Randburg, 135. [ Links ]
Engelbrecht, J.P., Reddy, V.S., Swanepoel, L. and Mostert, J.C. 1996a, Results on the CMB7 receptor modelling in the Vaal Triangle, Clean Air Journal, 9 (5), 16-24. https://doi/org/10.17159/caj/1996/9/5.7106 [ Links ]
Engelbrecht, J.P., Reddy, V.S., Swanepoel, L. and Mostert, J.C. 1996b, Airborne particulate matter monitoring and source apportionment in Olifantsfontein, Confidential Communication C2391 (declassified), Mintek, Randburg, South Africa, Randburg, South AfricaC2391M, 18. [ Links ]
Engelbrecht, J.P., Reddy, V.S., Swanepoel, L. and Mostert, J.C.: 1996c, Results of a source apportionment study at Valencia Park and Köhler Industries, in Nelspruit., Confidential Communication C2367M (declassified), Mintek, Randburg, South AfricaC2367M, 21. [ Links ]
Gao, Y., Arimoto, R., Duce, R.A, Chen, L.Q., Zhou, M.Y and Gu, D.Y., 1996: Atmospheric non-sea-salt sulfate, nitrate and methanesulfonate over the China Sea, Journal of Geophysical Research: Atmospheres, 101(D7):12601-12611. https://doi.org/10.1029/96JD00866 [ Links ]
Held, G., Scheifinger, H., Snyman, G. M., Tosen, G. R., and Zunckel, M. 1996, The Climatology and Meteorology of the Highveld, in: Air pollution and its impacts on the South African Highveld, 5 edited by: Held, G., Gore, B. J., Surridge, A. D., Tosen, G. R., Turner, C. R., and Walmsey, R. D., Environmental Scientific Association Cleveland, 1996. [ Links ]
Hjortenkrans, D.S.T., Bergback, B.G and Haggerud, A.V., 2007: Metal emissions from brake linings and tires: case studies of Stockholm, Sweden 1995/1998 and 2005, Environmental Science and Technology, 41, 5224-5230. https://doi.org/10.1021/es070198o [ Links ]
Hopke, P.K., Xie, Y., Raunemaa, T., Biegalski, S., Landsberger, S., Maenhaut, W., Artaxo, P. and Cohen, D. 1997, Characterization of the Gent stacked filter unit PM10 sampler, Aerosol Science and Technology, 27: 726-735. https://doi.org/10.1080/02786829708965507 [ Links ]
Josipovic, M., Leal-Liousse, C., Crobeddu, B., Baeza-Squiban, A., Segakweng, C.K., Galy-Lacaux, C., Beukes, J.P., van Zyl, P.G and Fourie, G. 2019, Aerosol characterisation including oxidative potential as the proxy of health impact: a case of a residential site in a highly industrialised area, Clean Air Journal, Volume 29, No 2. https://doi.org/10.17159/caj/2019/29/2.7517 [ Links ]
Liu, B., Wu, J., Zhang, J., Wang, L., Yang, J., Liang, D., Dai, Q., Bi, X., Feng, Y., Zhang, Y and Zhang, Q. 2017, Characterization and source apportionment of PM2 5 based on error estimation from EPA PMF 5.0 model at a medium city in China, Environmental Pollution, 222: 10-22. https://doi.org/10.1016/j.envpol.2017.01.005 [ Links ]
Maenhaut, W., Schwarz, J., Cafmeyer, J. and Chi, X.G. 2002, Aerosol chemical mass closure during the EUROTRAC-2 AEROSOL Intercomparison 2000, Nuclear Instruments and Methods in Physics Research Section B: Beam Interactions with Materials and Atoms, 189, 233-237. https://doi.org/10.1016/S0168-583X(01)01048-5 [ Links ]
Maenhaut, W., Francois, F and Cafmeyer, J. 1994, The "Gent" stacked filter unit (SFU) sampler for the collection of aerosols in two size fractions: Description and instructions for installation and use, Applied Research on Air Pollution Using Nuclear-related Analytical Techniques, Report on the First Research Co-ordination Meeting, Vienna, Austria, 30 March-2 April 1993, NAHRES-19, IAEA, Vienna, p. 249-263. [ Links ]
Maenhaut, W., Salma, I., Cafmeyer, J., Annegarn, H.J and Andreae, M.O. 1996, Regional atmospheric aerosol composition and sources in the eastern Transvaal, South Africa, and impact of biomass burning, Journal of Geophysical Research, 101, D19: 23631-23650. https://doi.org/10.1029/95JD02930 [ Links ]
Mathuthu, M., Dudu, V.P and Manjoro, M. 2019, Source Apportionment of Air Particulates in South Africa: A Review, Atmospheric and Climate Sciences, 9: 100-113. https://doi.org/10.4236/acs.2019.91007 [ Links ]
Moreno, T., Querol, X., Alastuey, A., de la Rosa, J., de la Campa, A.M.S., Minguillon, M., Pandolfi, M., Gonzalez-Castenedo, Y., Monfort, E. and Gibbons, W. 2010, Variations in vanadium, nickel and lanthanoid element concentrations in urban air, Science of the Total Environment, 408(2), 4569-4579. https://doi.org/10.1016/j.scitotenv.2010.06.016 [ Links ]
Muyemeki, L., Burger, R., Piketh, S.J., Language, B., Beukes, J.P and van Zyl, P.G., 2021: Souce apportionment of ambient PM10-2.5 and PM25 for the Vaal Triangle, South Africa, South African Journal of Science, 117(5/6). https://doi.org/10.17159/sajs.2021/8617 [ Links ]
Norris, G., Duvall, R., Brown, S and Bai,S. 2014, EPA Positive Matrix Factorization (PMF) 5.0 Fundamentals and User Guide, U.S Environment Protection Agency, Office of Research and Development, Washington, DC. [ Links ]
Pant, P and Harrison, R.M. 2012, Critical review of receptor modelling for particulate matter: A case study of India, Atmospheric Environment, 49: 1-12. https://doi.org/10.1016/j.atmosenv.2011.11.060 [ Links ]
Piketh, S.J., Swap, R.J., Anderson, C.A., Freiman, M.T., Zunckel, M. and Held, G. 1999, The Ben Macdhui high altitude trace gas and aerosol transport experiment, South African Journal of Science, 95: 35-43. [ Links ]
Polissar, A.V., Hopke, P.K., Paatero, P., Malm, W.C and Sisler, J.F. 1998, Atmospheric aerosol over Alaska 2. Elemental composition and sources, Journal of Geophysical Research, 103 (D15): 19045-19057. https://doi.org/10.1029/98JD01212 [ Links ]
Putaud, J.P., Van Dingenen, R., Mangoni, M., Virkkula, A., Raes, F., Maring, H., Prospero, J.M., Swietlicki, E., Berg, O.H., Hillamo, R and Makela. 2000: Chemical mass closure and assessment of the origin of the submicron aerosol in the marine boundary layer and the free troposphere at Tenerife during ACE-2, Tellus, 52B:141-168. https://doi.org/10.3402/tellusb.v52i2.16090 [ Links ]
Riddle, E. E., Voss, P. B., Stohl, A., Holcomb, D., Maczka, D., Washburn, K and Talbot, R. W. 2006, Trajectory model validation using newly developed altitude-controlled balloons during the International Consortium for Atmospheric Research on Transport and Transformations 2004 campaign, Journal of Geophysical Research, 111, D23S57. https://doi.org/10.1029/2006JD007456 [ Links ]
Rolph, G., Stein, A and Stunder, B. 2017, Real-time Environmental Applications and Display sYstem: READY, Environmental Modelling & Software, 95: 210-228. https://doi.org/10.1016/j.envsoft.2017.06.025 [ Links ]
Scholes, R.J., Kendall, J. and Justice, C.O. 1996a, The quantity of biomass burned in southern Africa, Journal of Geophysical Research, 101, D19: 23667-23676. https://doi.org/10.1029/96JD01623 [ Links ]
Scholes, R.J., Ward, D.E. and Justice, C.O. 1996b, Emissions of trace gases and aerosol particles due to vegetation burning in southern hemisphere Africa, Journal of Geophysical Research, 101, D19: 23677-23682. https://doi.org/10.1029/95JD02049 [ Links ]
Shikwambana, L and Sivakumar, V. 2019, Investigation of various aerosols over different locations in South Africa using satellite, model simulations and LIDAR, Meteorological Applications, 26: 275-287. https://doi.org/10.1002/met.1761 [ Links ]
Stein, A.F., Draxler, R.R, Rolph, G.D., Stunder, B.J.B., Cohen, M.D and Ngan, F. 2015, NOAA's HYSPLIT atmospheric transport and dispersion modeling system, Bulletin of the American Meteorological Society, 96: 2059-2077. https://doi.org/10.1175/BAMS-D-14-00110.1 [ Links ]
Stohl, A., 1998, Computation, accuracy and application of trajectories - a review and bibliography, Atmospheric Environment, 32, 947-966. https://doi.org/10.1016/S1352-2310(97)00457-3 [ Links ]
Tiitta, P., Vakkari, V., Croteau, P., Beukes, J.P., van Zyl, P.G., Josipovic, M., Venter, A.D., Jaars, K., Pienaar, J.J., Ng, N.L., Canagaratna, M.R., Jayne, J.T., Kerminen, V.-M., Kokkola,H., Kulmala, M., Laaksonen, A., Worsnop, D.R and Laakso, L. 2014, Chemical composition, main sources and temporal variability of PM1 aerosols in southern African grassland, Atmospheric Chemistry and Physics, 14: 1909-1927. https://doi.org/10.5194/acp-14-1909-2014 [ Links ]
Tshehla, C and Djolov, G. 2018, Source profiling, source apportionment and cluster transport analysis to identify the sources of PM and the origin of air masses to an industrialised rural area in Limpopo, Clean Air Journal, 28 (2): 54-66. http://dx.doi.org/10.17159/2410-972x/2018/v28n2a18 [ Links ]
USEPA. 1999, SPECIATE: EPA's repository of total organic compound and particulate matter speciated profiles for a variety of sources for use in source apportionment studies, United States Environmental Protection Agency OAQPS, Research Triangle Park, NC, 1999. [ Links ]
Venter, A.D., van Zyl, P.G., Beukes, J.P., Swartz, J., Josipovic, M., Vakkari, V., Laakso, L. and Kulmala, M. 2018, Size-resolved characteristics of inorganic ionic species in atmospheric aerosols at a regional background site on the South African Highveld, Journal of Atmospheric Chemistry, 75: 285-304. https://doi.org/10.1007/s10874-018-9378-z [ Links ]
Venter, A.D., van Zyl., P.G., Beukes, J.P., Josipovic, M., Hendriks, J., Vakkari, V. and Laakso, L. 2017, Atmospheric trace metals measured at a regional background site (Welgegund) in South Africa, Atmospheric Chemistry and Physics, 17:4251-4263. https://doi.org/10.5194/acp-17-4251-2017 [ Links ]
Venter, A.D., Beukes, J.P., van Zyl, P.G., Josipovic, M., Jaars, K. and Vakkari, V., 2016: Regional atmospheric Cr(VI) pollution from the Bushveld Igneous Complex, South Africa, Atmospheric Pollution Research, 7, 762-767. https://doi.org/10.1016Zj.apr.2016.03.009 [ Links ]
Venter, A.D., Vakkari, V., Beukes, J.P., van Zyl, P.G., Laakso, H., Mabaso, D., Tiitta, P., Josipovic, M., Kulmala, M., Pienaar, J.J. and Laakso, L. 2012, An air quality assessment in the industrialised western Bushveld Igneous Complex, South Africa, South African Journal of Science, 108(9/10): 1-10. https://doi.org/10.4102/sajs.v108i9/10.1059. [ Links ]
Viana, M., Kuhlbusch, T.A.J., Querol, X, Alastuey, A., Harrison, R.M., Hopke, P.K., Winiwarter, W., Vallius, A., Szidat, S., Prevot, A.S.H., Hueglin, C., Bloemen, H., Wahlin, P., Vecchi, R., Miranda, A.I., Kasper-Giebl, A., Maenhaut, W and Hitzenberger, R. 2008, Source apportionment of particulate matter in Europe: A review of methods and results, Journal of Aerosol Science, 39(10): 827 - 849. https://doi.org/10.1016/j.jaerosci.2008.05.007 [ Links ]
Yang, X., Wang, T., Xia, M., Gao, X., Li, Q., Zhang, N., Gao, Y., Shuncheng, L., Wang, X., Xue, L., Yang, L and Wang, W. 2018, Abundance and origin of fine particulate chloride in continental China, Science of the Total Environment, 624: 1041-1051. https://doi.org/10.1016/j.scitotenv.2017.12.205 [ Links ]
Watson, J.G., Chow, J.C., Lurmann, F.W and Misarra, S., 1994: Ammonium nitrate, nitric acid, and ammonia equilibrium in wintertime Phoenix, Arizona, Journal of Air & Waste Management Association, 44(4): 405-412. [ Links ]
World Health Organisation (WHO). 2006, Air Quality Guidelines: Global Update 2005: Particulate Matter, ozone, nitrogen dioxide and sulfur dioxide, World Health Organization, Geneva, Switzerland. [ Links ]
Yu, Q., Gao, B., Li, G., Zhang, Y., He, Q., Deng, W., Huang, Z., Ding, X., Hu, Q., Huang, Z., Wang, Y., Bi, X. and Wang, X. 2016, Attributing risk burden of PM2.5- bound polycyclic aromatic hydrocarbons to major emission sources: Case study in Guangzhou, South China, Atmospheric Environment, 142: 313-323. https://doi.org/10.1016/j.atmosenv.2016.08.009 [ Links ]
Zhang, R., Jing, J., Tao, J. and Hsu, S.C. 2013, Chemical characterization and source apportionment of PM2.5 in Beijing: Seasonal perspective, Atmospheric Chemistry and Physics, 13: 7053-7074. https://doi.org/10.5194/acp-13-7053-2013 [ Links ]
Zheng, Z., Zu, G., Li, Q., Chen, C. and Li, J. 2019, Effect of precipitation on reducing atmospheric pollutant over Beijing, Atmospheric Pollution Research, 10: 1443-1453. https://doi.org/10.1016/j.apr.2019.04.001 [ Links ]
Received: 23 August 2021
Reviewed: 16 October 2021
Accepted: 22 November 2021

