Services on Demand
Article
 English (pdf)
 Article in xml format
 Article references
Indicators

Related links
-
 Cited by Google
 -
 Similars in Google
Share

 Permalink
Clean Air Journal
On-line version ISSN 2410-972X
Print version ISSN 1017-1703
Clean Air J. vol.31 n.1 Pretoria 2021
http://dx.doi.org/10.17159/caj/2021/31/1.9087
RESEARCH ARTICLE
Assessing SO2, NO2 and O3 in rural areas of the North West Province
Morongoa NgoashengI; Johan P. BeukesI; Pieter G. van ZylI; Jan-Stefan SwartzI; Victor LoateII; Portia KrisjanII; Sandile MpambaniII; Markku KulmalaIII; Ville VakkariI, IV; Lauri LaaksoI, IV
IAtmospheric Chemistry Research Group, Chemical Resource Beneficiation, North-West University, Potchefstroom, South Africa, morongoangoasheng@gmail.com, paul.beukes@nwu.ac.za, pieter.vanzyl@nwu.ac.za, 20564759@nwu.ac.za
IIDirectorate Environmental Quality Management; Rural, Environment and Agricultural Development (READ), North West Provincial Government, Loatev@nwpg.gov.za, PKrisjan@nwpg.gov.za, SMpambani@nwpg.gov.za
IIIDepartment of Physical Sciences, University of Helsinki, FI-00101, Helsinki, Finland, markku.kulmala@helsinki.fi
IVFinnish Meteorological Institute, FI-00101, Helsinki, Finland, Lauri.Laakso@fmi.fi, Ville.Vakkari@fmi.fi
ABSTRACT
Air quality monitoring has been lacking in the rural and western North West Province. Here ambient sulphur dioxide (SO2), nitrogen dioxide (NO2) and ozone (O3) concentrations, monitored with passive samplers at 10 sites, are presented. Widespread SO2 and NO2 problems weren't observed. However, regular O3 standard limit exceedances are likely across the province. Increased SO2 and NO2 concentrations in the colder and drier months were evident. Inversion layer trapping of low-level emissions during the colder months and open biomass burning in the drier months increased ground level pollutant concentrations. Wet deposition of SO2 and NO2, and enhanced SO2 conversion to particulate sulphate, result in lower wet season concentrations. O3 concentrations were lower from May to July and higher from August to March. Three phenomena contributed to this. Firstly, shorter daylight hours (less photochemistry) and secondly, lower biogenic volatile organic compound (O3 precursors) concentrations during the colder months. Thirdly, the late winter/ early spring open biomass burning peak lead to elevated carbon monoxide (CO) concentration (also an O3 precursor). Spatial patterns indicated higher SO2 concentrations in the west, due mainly to industrial emissions. The NO2 spatial map indicated two areas of higher concentration, i.e. Bapong in the east due mainly to industrial emissions, and Taung with its higher population density. The O3 spatial map was almost the inverse of NO2. The lower O3 and higher NO2 around Taung indicated that O3 is likely titrated there. Additionally, the results indicate that non-point source emissions of NO2 are high enough to results in exceedances of the O3 standard limit. Overlay back trajectory maps showed that sites in the east are more frequently impacted by pollution transported from the Mpumalanga Highveld, Vaal Triangle and the Johannesburg-Pretoria megacity if compared to the west. Conversely, cleaner air masses impact the west more than sites in the east.
Keywords: Air quality, North West Province, spatial patterns, seasonal patterns, passive samplers
Introduction
Anthropogenic activities are increasing the ambient tropospheric concentrations of inorganic gaseous pollutants, which include nitrogen dioxide (NO2), sulphur dioxide (SO2) and ozone (O3). These species are globally considered as important pollutants and are criteria pollutants according to the South African National Environment Management: Air Quality Act of 2004 (Government Gazette 2005).
Human health issues associated with NO2 and nitrogen oxide (NO) (combined referred to as NOx), as well as SO2 include irritation of the respiratory system, which can cause breathing difficulties. People who suffer from asthma are particularly sensitive to chronic inhalation of elevated NOx and SO2 concentrations, which may result in long-term effects such as pulmonary asthma and chronic bronchitis (Pandey et al. 2005). Exceedances of the South African NO2 and SO2 ambient air quality standard limits have been reported for numerous locations/areas (e.g. DEA 2010).
Oxidation of SO2 and NO2 lead to the formation of sulphate (SO42-) and nitrate (NO3-), respectively. In South Africa it has been indicated that these species contribute significantly to the acidity of atmospheric particulate matter (Venter et al. 2018), acid rain (Conradie et al. 2016), eutrophication of the terrestrial and aquatic environment (Dunnink et al. 2016), and secondary aerosol formation (Vakkari et al. 2015). SO42- and NO3- also scatter radiation (IPCC 2013) and are important species within the context of aerosol climate forcing in South Africa (Venter et al. 2020).
Tropospheric O3 is a secondary pollutant formed from the photochemical reaction of NO2 (Seinfeld and Pandis 2016). O3 can have detrimental impacts on crops and vegetation (Laakso et al. 2013). Additionally, O3 is a short-lived greenhouse gas, which has a net warming effect (IPCC, 2013). Exceedances of the South African O3 air quality standard limit has been reported for large areas of the South African interior (Laban et al. 2018).
Major sources of atmospheric pollutants in South Africa include fossil fuel combustions, traffic, open biomass burning (veld fires), mining and metallurgical activities, and household combustion. The Mpumalanga Highveld, Johannesburg-Pretoria (JHB-Pta) megacity and the Vaal Triangle are all regions that are relatively polluted and where ambient air quality standard limits are regularly exceeded (Government Gazette 2012, 2020). In addition, numerous large point and area sources are located in the western Bushveld Complexes (wBC) (Rustenburg, Brits and Sun City areas) within the North West Province. This area was included in the Waterberg Priority Area (Government Gazette, 2010), due to current and possible future exceedances of ambient air quality standard limits there. Typical sources of pollutants in the wBC include pyro-metallurgical smelters, mining activities, household combustion, open biomass burning and vehicular emissions (Piketh et al. 2005).
Due to the above-mentioned air quality issues associated with the Mpumalanga Highveld, JHB-Pta megacity, Vaal Triangle and wBC, numerous regulatory and research studies are/have been conducted there. However, to the knowledge of the authors, no systematic air quality studies have been conducted in the rural areas of the western North West Province. Therefore, the general aim of this study was to assess SO2, NO2 and O3 concentrations in rural areas of the North West Province. The specific objectives were to: i) measure SO2, NO2 and O3 with a cost effective manner at 10 sites for at least two full seasonal cycles; ii) contextualise SO2, NO2 and O3 concentrations, in terms of air quality standard limits, as well as with measurements conducted elsewhere; iii) establish seasonal and spatial patterns of the pollutant species; iv) indicate possible sources and/or contributing factors and v) give guidance to possible future ambient measurements of SO2, NO2 and O3 in the area.
Experimental
Passive sampling and associated analytical methods
Since the rural North West Province covers a large surface area, it was impractical (too expensive and logistically difficult) to conduct this study with active sampling. Therefore, passive diffusive samplers developed by the North-West University (NWU) (Pienaar et al. 2015) were used to measure monthly average concentrations. Although passive samplers do not give instantaneous concentration values (as with active samplers), they are ideal to map a large region and identify potential areas where higher resolution measurements should be conducted.
Passive sampler preparations were conducted as specified by Dhammapala (1996) with sodium hydroxide (NaOH) dissolved in methanol, NaOH and sodium iodide (NaI) dissolved in methanol, and sodium nitrite (NaNO2), potassium carbonate (K2CO3) and glycerol dissolved in a water-methanol mixture used as adsorbent solutions for SO2, NO2 and O3, respectively. After preparation, each sampler was labelled according to the preparation date, designated site and pollutant species. Thereafter, each sampler was placed in an airtight plastic vial and sealed in an airtight bag. For each pollutant species a laboratory blank sampler was prepared for every monthly sample batch that was deployed. These blanks were sealed and stored in the laboratory freezer until analysis.
The passive samplers were deployed and exposed in pairs for each pollutant species. Exposure of pairs reduced data loss should a specific sampler suffer any sort of interference. A log sheet was kept for every sampler, in order to record important variables needed for calculations and/or observations that would assist in explanations (e.g. exposure and collection times and date, and unusual events such as nearby fires). The passive samplers were exposed by placing them in a stainless-steel rail, mounted under an aluminium sampler hood. Hoods were either attached to an aluminium shaft and stand base, or a bracket that was screwed onto a suitable structure (e.g. wooden power/telephone pole, or road sign) approximately 1.5m above ground level. The sampler hood act as a shield, which protect the exposed samplers against direct sunlight and rain.
After the exposure period was complete, the passive samplers were removed, sealed in plastic vials and bags. Directly thereafter, fresh unexposed samplers were deployed for the following month. Exposed samplers were sent back to the lab for analysis. Upon receipt, the samplers were logged as received and stored in a freezer until analysis.
In preparation for chemical analysis, the pollutant specific impregnated filters of the passive samplers were leached as previous specified (Dhammapala 1996, Pienaar et al. 2015). Analyses of the leached solutions were conducted with an Ion Chromatography Dionex ICS 3000 system, fitted with an Ionpac AS16 (4 mm) analytical column, an AS16 guard column (4 mm) and a conductivity detector. Background conductivity was lowered by a self-regenerating electrochemical suppressor (4 mm AERS-500), fitted with a carbonate removal device. The flow rate was maintained at 1.2 cm3min-1. The system was also equipped with an eluent (hydroxide, OH-) generator. Calibration of the IC was conducted using stock solutions with concentrations of 0.02, 0.2, 0.8, 1.5 and 2.5 μmol.dm-3 of the relevant chemical species.
The combination of passive samplers and analytical procedure have been used in numerous published studies (e.g. Swartz et al. 2020, the most recent). In addition, the accuracy (how close to calibrated active samplers) and precision (repeatability) of the passive samplers have been demonstrated in national (Dhammapala 1996) and international (Pienaar et al. 2015) inter-comparisons. Quality assurance of the analytical procedure was further verified by participating in the bi-annual Laboratory Inter-Comparison Study (LIS) organised by the World Meteorological Organisation (WMO) (e.g. as presented in Conradie et al. 2016, Swartz et al. 2020).
Ancillary data
Air mass movements were determined by calculating 96hour back trajectories for air masses arriving at a height of 100m above ground level, for every hour during the sampling campaigns. This was done by using the Hybrid Single-Particle Lagrangian Integrated Trajectory model (HYSPLIT, version 4.8) (Draxler and Hess 2004). The model was run with meteorological data of the Global Data Assimilation System (GDAS) archive of the National Centre for Environmental Prediction (NCEP) of the United States National Weather Service and the Air Resources Laboratory (ARL) archive, accessed 01/09/2020.
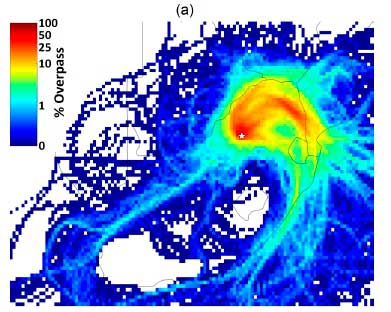
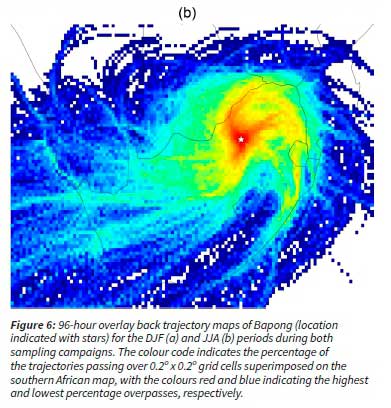
Overlay back trajectory maps (introduced in Vakkari et al. 2011) were compiled in order to get an overview of air mass movement for a specifics site during specific measurement months, or for the entire measurement period. In such maps a colour code was used to indicate the percentage of the hourly arriving trajectories passing over 0.2° x 0.2° grid cells that were superimposed on the South African map, with the colours red and blue indicating the highest and lowest percentage overpasses, respectively.
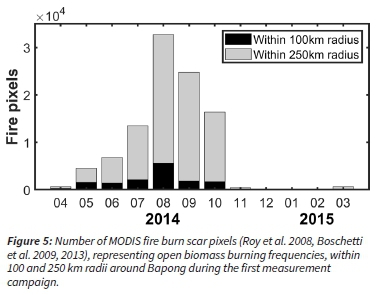
The National Aeronautics and Space Administration (NASA) Moderate Resolution Imaging Spectrometer (MODIS) collection 5 burned area product (Roy et al. 2008) was used to determine open biomass burning fire locations. Such data is expressed as gridded 500 m fire burn scar pixels (Boschetti et al. 2009, 2013).
Measurement campaigns
Monthly SO2, NO2 and O3 measurements were conducted at 10 sites during two sampling campaigns, i.e. April 2014 to March 2015 and February 2018 to October 2019. In addition, a more intensive campaign was conducted in June, July and August (JJA) 2019. During this intensive campaign, 15 additional sites were monitored. The additional sites were located mostly in-between (via tar road access) the 10 sites that were monitored over the entire time, during both campaigns. The intensive campaign was done for two reasons. Firstly, to distinguish whether the trace gas concentrations at the 10 sites, which were located in small urban areas, differed from concentrations in-between the urban areas. Secondly, the larger number of sites made it possible to obtain a better spatial representation of pollutant concentrations across the province.
Measurement sites
The Directorate Environmental Quality Management; Rural, Environment and Agricultural Development (READ), of the North West Provincial Government indicated numerous municipal areas for which no air quality data existed. Based on this information 10 measurement sites were selected, to balance the limited financial resources available, logistical access and likely scientific information that could be obtained. The locations of these measurement sites at Tosca, Morokweng, Ganyesa, Vryburg, Sannieshof, Taung, Christiana, Schweizer-Reneke, Bapong and Ottoshoop are indicated within a regional perspective in Figure 1.
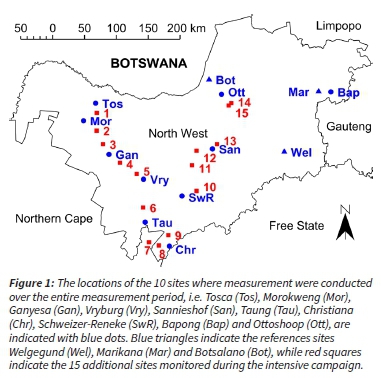
The locations of the 15 additional sites considered during the JJA intensive campaign are also indicated in Figure 1 (as sites numbered 1-15). Furthermore, the locations of Welgegund (Jaars et al. 2016 and 2018), Marikana (Van Zyl et al. 2014) and Botsalano (Laakso et al. 2008; Vakkari et al. 2013), all located in the North West Province, are also shown. Continuous measurements of the pollutant species considered in this paper are/have been conducted there. Therefore, these stations were used as reference sites.
Results and discussion
SO2, NO2 and O3 sampling efficiency and contextualisation of concentrations
Overall, a 95.83% sampling efficiency was achieved during the combined 33-month sampling period, which can be considered as very good.
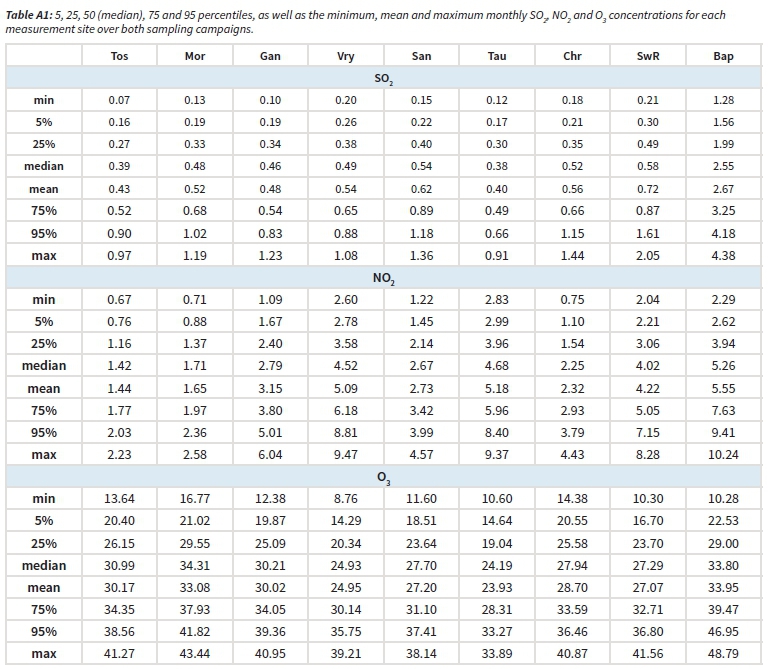
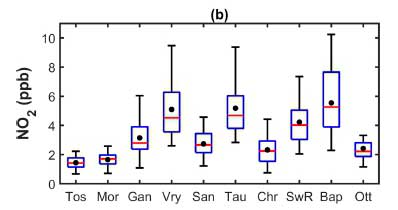
In order to contextualise the results, the statistical spread of SO2, NO2 and O3 concentrations measured at each site, over both sampling campaigns are presented in Figures 2a, b and c, respectively (associated data is presented in Table A1, Appendix). The variation in median/mean concentrations for the sites reflect the spatial distribution of pollutant concentrations.
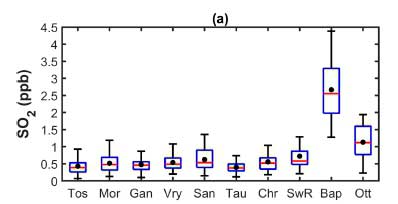
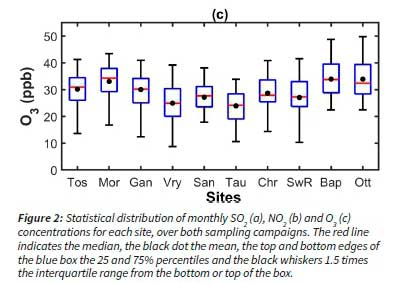
However, it (the spatial distribution) is discussed in spatial distribution and is therefore not considered further here.
Taung and Tosca had the lowest median and mean SO2 concentrations, of 0.38 and 0.40, and 0.39 and 0.43 ppb, respectively (Figure 2a and Table A1, Appendix). These median/mean concentrations compare well with the mean SO2 concentrations reported by for Okaukuejo in Namibia (0.43 ppb), a relatively unpolluted southern African continental background site (Martins et al. 2007). Bapong had the highest median and mean SO2 concentrations of 2.55 and 2.67 ppb, respectively, which were significantly higher than the other sites considered in this study. The Bapong median/mean concentrations were lower than the 3.80 ppb reported for Marikana (Venter et al. 2012) located close to several smelters in the North West Province, and within the concentration range reported for the Mpumalanga Highveld (2.80 to 13.30 ppb according to Martins et al. 2007, Lourens et al. 2011, Laakso et al. 2012).
Tosca and Morokweng had the lowest median and mean NO2 concentrations of 1.42 and 1.44, and 1.65 and 1.71 ppb, respectively (Figure 2b and Table A1, Appendix). These median/ mean concentrations were significantly higher than the mean NO2 concentrations reported for Okaukuejo in Namibia (0.34 ppb) and Louis Trichardt in the Limpopo Province (0.74 ppb) (Martins et al. 2007). Bapong, Taung and Vryburg had the highest median and mean NO2 concentrations of 5.26 and 5.55, 4.68 and 5.18, and 4.52 and 5.16 ppb, respectively, which were significantly higher than the other sites considered in this study. The Bapong, Taung and Vryburg median/mean concentrations falls in the concentrations range reported for the Mpumalanga Highveld (2.50 to 9.20 ppb, according to Martins et al. 2007, Lourens et al. 2011, Laakso et al. 2012) and is lower than the 8.50 ppb reported for Marikana (Venter et al. 2012).
Taung and Vryburg had the lowest mean and median O3 concentrations of 23.29 and 24.19, and 25.02 and 25.47 ppb, respectively (Figure 2c and Table A1, Appendix). These median/ mean concentrations are similar to mean O3 concentrations reported for Okaukuejo in Namibia, i.e. 23.00 ppb (Martins et al., 2007). Ottoshoop, Bapong and Morokweng had the highest median and mean O3 concentrations of 33.51 and 34.74, 33.96, and 34.76 and 34.94 and 33.61 ppb, respectively. These median/ mean concentrations were higher than the 29.10 ppb mean concentration reported for Marikana located close to several smelters in the North West Province (Venter et al. 2012), and within the concentration range reported for the Mpumalanga Highveld (16.30 to 37.10 ppb, according to Martins et al. 2007, Lourens et al. 2011, Laakso et al. 2012).
In order to contextualise the results further, the measured concentrations were compared to the South African ambient air quality standards limits (Government Gazette, 2009). However, as no monthly standard limit values exist for any of the three species considered, such comparisons are not straight forward. As previously mentioned, the relatively long averaging periods required for passive sampling is one of the disadvantages of this method.
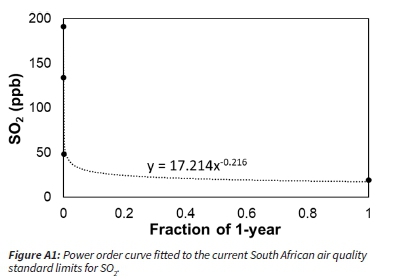
For SO2, annual average concentrations (calculated from April'14 to March'15 and February'18 to January'19) for all 10 sites varied between 0.35 to 2.63 ppb, which is substantially lower than the specified 1-year average limit of 19 ppb (Government Gazette, 2009). To contextualise the monthly results within the context of ambient air quality standard limits, a curve fit was applied to the 10 min., 1-hr., 8-hrs., 24-hrs and 1-year standard limits specified for SO2 (Government Gazette, 2009), as indicated in Figure A1 (Appendix). By using the equation of the fitted curve, it was possible to estimate a potential monthly average "limit" value, which was found to be 29.53 ppb. Comparing the monthly SO2 concentration values with the afore-mentioned calculated value indicated that if a monthly limit did exist for SO2 it would likely not have been exceeded during the measurement period. However, the impacts of SO2 is not a continuum across a wide concentration range (Katsouyanni et al. 1996), therefore, the method applied here is a simplification of reality, but it does give some quantitative indication of monthly average SO2 air quality. Venter et al. (2012) indicated that on average 4, 0.4 and 0 exceedances of the 10-min (191 ppb), 1-hr (124 ppb) and 24-hrs (48 ppb) SO2 standard limit values occurred at Marikana, which is approximately 17.5 km (measured in a straight line) from the Bapong site. The average SO2 concentration measured at Bapong was 2.67 ppb, while that of Marikana was reported as 3.80 ppb (Venter et al. 2012). Therefore, it might be possible that some exceedances of the 10-min and 1-hr standard limit values occurred at Bapong. However, the number of such exceedances are unlikely to be close to the 526 and 88 allowed frequency of exceedances specified for the 10-min and 1-hr standards, respectively (Government Gazette, 2009). It is also unlikely that such exceedances will occur at any of the other sites, since the SO2 concentrations were significantly lower there (Figure 2a).
For NO2, annual average concentrations (April'14-March'15 and February'18-January'19) for all 10 sites varied between 1.28 to 5.90 ppb, which is substantially lower than the specified 1-year average standard limit of 21 ppb (Government Gazette, 2009). As previously stated, it is impossible to directly compare monthly average values with shorter standard limit period, such as the 1-hr. standard limits specified for NO2. It is also impossible to estimate a monthly standard "limit" for NO2 (as illustrated for SO2 in Figure A1, Appendix), as there are only two standard limit values specified in the current legislation (Government Gazette, 2009). Similar to the SO2 results, Bapong again had the highest NO2 concentrations. The average NO2 concentration measured throughout the sampling periods at Bapong was 5.55 ppb, while that of Marikana was reported as 8.50 ppb (Venter et al. 2012). Since Venter et al. (2012) did not report any exceedance of the 1-hr standard limit at Marikana, it is unlikely that NO2 concentrations at Bapong, or any of the other measurement sites, exceeded the 1-hr standard limit of 106 ppb.
O3 only has an 8-hrs. moving standard limit of 61 ppb (Government Gazette, 2009), therefore, it was impossible to directly indicate exceedances of the afore-mentioned standard limit. However, as indicated in Section 2.3 an intensive campaign was undertaken, during which concentrations of the three pollutants of interest were measured at 15 additional sites during JJA 2019. During this JJA period the O3 concentrations were highest at Bapong, Ottoshoop and Morokweng, i.e. 34.33, 32.50 and 31.75 ppb, which are similar to the Welgegund and Botsalano JJA calculated O3 values of 36.62 and 32.69 ppb, respectively. The lowest O3 concentrations during the JJA period were measured at Taung, Schweizer-Reneke and Vryburg, i.e. 24.33, 22.71 and 22.70 ppb, respectively, which were similar to the JJA value of 23.21 ppb calculated for Marikana. Relatively recently Laban et al. (2018) presented the average number of days per month on which the O3 8-hrs moving average standard limit were exceeded at the afore-mentioned reference sites, i.e. Welgegund (up to approximately 9.9 days per month), Botsalano (up to approximately 5.4 days per month) and Marikana (up to approximately 12.1 days per month). Considering the similarly in JJA O3 average concentrations measured during this study with the afore mentioned published data (Laban et al. 2018), it is highly likely that significant number of O3 exceedances also occurred at all the sites where measurements were conducted in this study.
Seasonal patterns
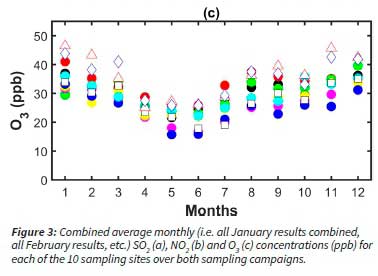
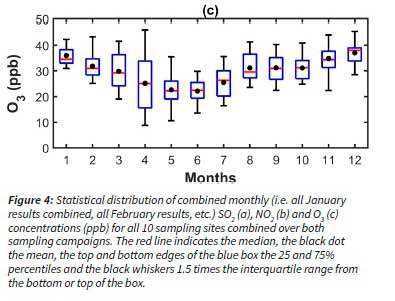
The monthly average concentrations (average for all January concentrations, average for all February concentrations, etc.) for SO2 (a), NO2 (b) and O3 (c) are presented for each site separately, combined for both measurement campaigns, in Figure 3. In Figure 4 statistical distribution of combined monthly concentrations (all January concentrations, all February concentrations, etc.) for SO2 (a), NO2 (b) and O3 (c) for all sites combined over both sampling campaigns, are presented as boxplots. The latter gives a regional (Figure 4), rather than a site specific (Figure 3) perspective on seasonal patterns.
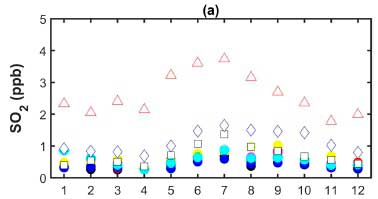
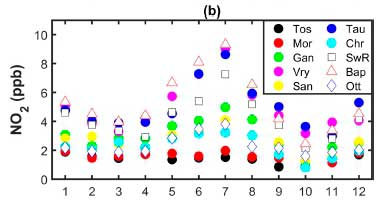
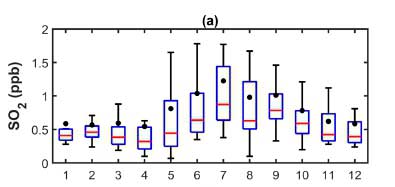
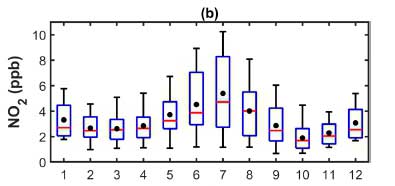
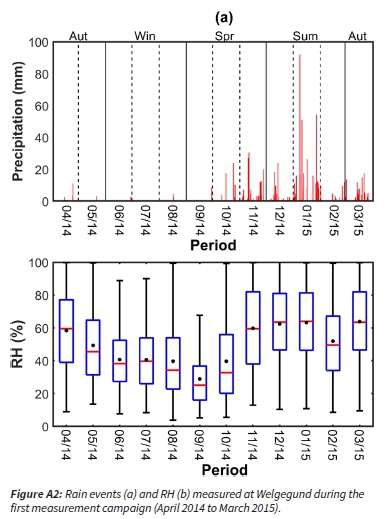
From both Figures 3(a and b) and 4(a and b), a relatively well-defined and similar seasonal pattern is evident for SO2 and NO2, i.e. higher concentrations in the colder months of June to August, as well as late autumn (May) and early spring (September), while the rest of the year has lower concentration values. Similar seasonal patterns have previously been reported for other areas in South Africa (Josipovic et al. 2010). This seasonal pattern indicates possible additional contribution from sources such as household combustion for space heating that occurs more frequently in the colder months (Adesina et al. 2020), as well as open biomass burning that occurs more frequently in the drier months (Chiloane et al. 2017). Additionally, enhanced trapping of low-level emissions during the colder months by a low-level inversion layer(s) lead to increased concentrations of pollutants at ground level (Garstang et al. 1996). Gierens et al. (2019) reported the formation of such a low-level thermal inversion layer to occur approximately 81% of the time during JJA at Welgegund in the North West Province, while it only occurred approximately 33% during December, January and February (DJF). Also, the daily persistence of the low-level thermal inversion layer is longer during JJA, if compared to DJF (Gierens et al. 2019). Furthermore, increased wet deposition of both SO2 (as SO42-) and NO2 (as NO3-) (Conradie et al. 2016), as well as enhanced conversion of SO2 to particulate SO42-that occur during the wet season when the relative humidity (RH) is higher (Seinfeld and Pandis 2016), result in lower gaseous concentrations during the warmer/wetter months. Unfortunately, rain volumes and RH were not measured at any of the 10 sites considered in this study, but it was measured at Welgegund. Figures A2a and b (Appendix) present the rain events and RH measured at Welgegund during the first measurement campaign (April 2014 to March 2015), respectively. As is evident, rain events are frequent during the rainy season (approximately middle October to end of March), with very few events during the rest of the year. RH is lower from approximately May to October.
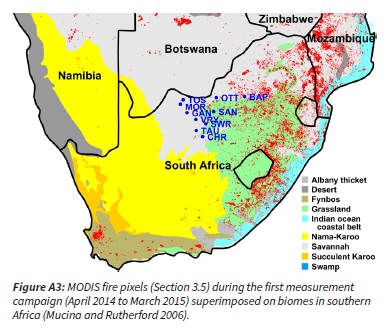
In contrast to the SO2 and NO2 seasonal patterns, O3 concentrations (Figures 3a and 4a) were on average lowest during the colder months of May to July and higher in the period August to December, as well as January to March. Similar seasonal O3 patterns have previously been presented for Welgegund, Botsalano and Marikana (Laban et al. 2018), which are all situated in the North West Province. Similar to Laban et al. (2018), three phenomena can be considered to partially explain the observed O3 season pattern. Firstly, the colder months have shorter daylight hours, hence less time for photochemical formation of O3. Secondly, biogenic volatile organic compound (BVOC) emissions in the North West Provice are lower during the colder months (Jaars et al. 2016). VOCs are important within the context of O3 formation, since the alkylperoxy radical (ROO») that form during the oxidation of VOCs convert NO to NO2, from which O3 is formed (Seinfeld and Pandis 2016). Thirdly, the peak in open biomass burning in the interior of southern Africa during late winter and early spring (typically August to mid-October) (Chiloane et al. 2017) also lead to a peak in carbon monoxide (CO) concentrations in the North West Province (Laakso et al. 2008). The oxidation of CO results in the formation of the hydroperoxy radical (HOO»), which similar to the ROO» radical enhance conversion of NO to NO2 (Seinfeld and Pandis 2016). As an example, the frequencies of open biomass burning within 100 and 250 km radii around the Bapong site are presented in Figure 5, for the first measurement campaign. This data clearly indicates a peak in such events during late winter and early spring, which correspond with higher ambient O3 concentrations. All sites exhibited similar seasonal open biomass burning frequency, with the only difference that sites further west had lower overall MODIS fire burn scar pixel counts, due lower productive (less vegetation biomass produced per year) biomes occurring in the western South Africa interior (Figure A3, Appendix).
Thus far, air mass histories were not considered in explaining the observed seasonal patterns (Figures 3 and 4), although it is well-know that it can play an important role (Garstang et al. 1996, Tyson and Preston-Whyte 2000). To illustrate the importance thereof, hourly arriving 96-hour back trajectories for the DJF and JJA periods during both sampling campaigns for Bapong (again used as an example site) are presented in Figure 6. From this example, it is evident that the principal flow of air masses towards Bapong (indicated by red) during DJF (Figure 6a) follows an anti-cyclonic pattern, with dominance from the sector between north northwest to northeast. There is limited airflow from the south (indicated by yellow). During the JJA period (Figure 6b) the anti-cyclonic pattern is still evident, but much more air masses pass over the area directly south of Bapong (indicated by red), where the relatively polluted JohannesburgPretoria (JHB-Pta) megacity lie (Lourens et al. 2011 and 2016). Also, more air masses pass over the fairly polluted Mpumalanga Highveld during the JJA period. This example indicates that in additional to local sources and local meteorological contributing factors, regional transport of pollutants could contribute to the observed concentrations. Specifically, SO2 and NO2 transport from the JHB-Pta megacity, the Mpumalanga Highveld, the Vaal Triangle and the wBC could have impacts on a regional scale.
Spatial distribution
Site specific SO2, NO2 and O3 concentrations were statistically presented in Figure 2. The highest SO2 concentrations were measured at Bapong (2.55 median and 2.67 ppb mean) throughout the entire sampling period, while the second highest SO2 levels were measured at Ottoshoop (1.12 median and 1.13 ppb mean) (Figure 2a and Table A1, Appendix). Bapong is situated within the wBC that is part of the Bojanala Platinum district, where a large number of platinum group metal (PGM) and base metal (Xiao and Laplante 2004), ferrovanadium (Moskalyk and Alfantazi 2003), as well as ferrochromium smelters (Venter et al. 2016) occur. Situated relatively close (i.e. 13 to 45 km) to Ottoshoop are three cement factories with kilns, while Mahikeng, the capital of the North West Province, is situated 33 km to the west southwest.
NO2 concentrations were the highest at Vryburg (5.52 median and 5.16 ppb mean), Bapong (5.26 median and 5.55 ppb mean), Taung (4.68 mean and 5.18 ppb) and Schweizer-Reneke (4.02 median and 4.22 ppb mean) (Figure 2b and Table A1, Appendix). As indicated in the previous paragraph, Bapong is situated in an industrial area, where higher pollutant concentrations can be expected. Both Vryburg and Taung are areas with larger population densities than most of the rural sites considered in this study, hence vehicle and/or household combustion emissions of NO2 will be more significant. Similarly, vehicle emissions are thought to be the main source of the higher NO2 concentrations reported for Schweizer-Reneke, since the measurement site was located at a municipal building on a relatively busy intersection. The lowest NO2 levels were consistently measured at Tosca and Morokweng, which are both rural areas with very low population density and no significant industrial activities.
In contrast to NO2, the highest O3 levels were measured at Morokweng (33.61 median and 34.97 ppb mean), Ottoshoop (33.51 median and 34.74 ppb mean) and Tosca (30.99 median and 30.17 ppb mean), while the lowest O3 concentrations were measured at Taung (24.19 median and 23.92 ppb mean), Vryburg (25.02 median and 25.47 ppb mean), and Schweizer-Reneke (27.44 median and 27.63 ppb mean) (Figure 2b and Table A1, Appendix). Bapong was the exception, since it had higher O3 and NO2 levels, while NO2 and O3 were inverse of one another at most other sites. SO2 is a primary pollutant, while NO2 can be a primary pollutant, but it is mostly a secondary pollutant that form relatively quickly from NO. During daytime the average ratio of [NO]/[NO2] « 0.1 (Seinfeld and Pandis 2016). During nigh time NO reacts rapidly with O3 to form NO2 (Seinfeld and Pandis 2016). Hence, NO2 acts similar to a primary pollutant, such as SO2. In contrast, O3 is a secondary pollutant, formed from the photochemical reaction of NO2 and with precursor species such as VOCs and CO being important (see discussions in Section 3.2). Therefore, air mass history in relation to NO2 (as well as VOCs and CO) emissions are vital in understanding O3.
In order to better understand transport of SO2 and NO2, as well as regional O3 formation, 96-hr overlay back trajectory maps were compiled for each of the 10 measurement sites for both sampling campaigns combined. Examples of such overlay back trajectory maps for Bapong and Morokweng are presented in Figure 7. These sites were located on the eastern and western borders of the investigated area in the North West province, respectively. Also, Bapong had the highest and Morokweng the 2nd lowest SO2 and NO2 median/mean concentrations during both measurement periods.
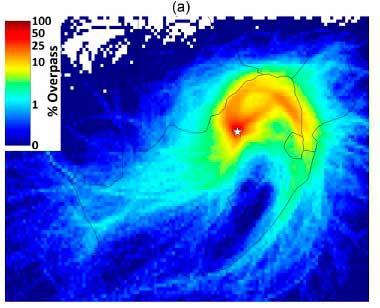
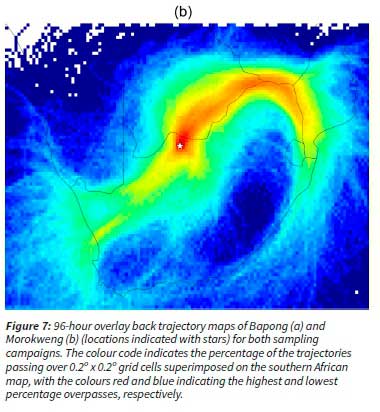
As previously indicated, there were numerous large point sources close to Bapong. In addition, it is evident from Figure 7a that Bapong is also frequently impacted by air masses that had passed over other polluted areas, such as the JHB-Pta megacity, the Mpumalanga Highveld and the Vaal Triangle. In contrast to Bapong, the air mass history of Morokweng (Figure 7b) is dominated by anti-cyclonic circulation, but this circulation mostly takes place north of the South African-Botswana border, where much fewer large point sources occur. In addition, air masses from the southwest of Morokweng, where the relatively clear regional background (i.e. Karoo and Kalahari) is situated, affect it fractional more than Bapong.
As indicated earlier, air mass history is also very important to understand O3. However, since it is a secondary pollutant, and additional phenomena such as titration can occur (Balashov et al. 2014) a more detailed discussion on it (regional O3 perspective) is presented later.
As stated earlier, an intensive campaign was conducted during JJA 2019. The JJA period was specifically selected, since SO2 and NO2 concentrations typically peaked then (Figures 3a and b, Figures 4a and b). In order to visualise the combined results of the 10 original sites, as well as the 15 additional sites, spatially interpolated average concentrations maps for SO2, NO2 and O3 during JJA 2019 are presented in Figure 8. Historic JJA data for Welgegund, Marikana and Botsalano were also included in these figures. These spatially interpolated average concentrations maps are not perfect, since i) only a limited number of sites could be included in this study and ii) the sites could not be equally spaced over the study area. However, notwithstanding these limitations, valuable information can be gained from the maps.
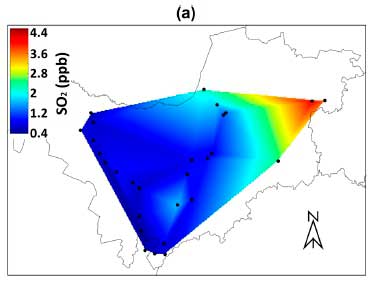
The SO2 spatial map (Figure 8a) indicate higher SO2 concentrations on the eastern side of the study area in the North West Province, than in the west. As indicted earlier, various large point sources occur in the east, that could potentially emit SO2, whereas in comparison the western region of the study area has no significant industries, thus having lower SO2 concentrations. Open biomass burning also occur more frequently in the east, if compared to the west of the study area (Figure A3, Appendix). Although open biomass burning is expected to contribute fractionally less than industrial emissions of SO2 in the context of the study area, savannah and grassland biomes are known to emit 0.47 ± 0.44 g SO2/kg dry material burnt (Andreae 2019). Recently, Vakkari et al. (2020) reported even higher SO2 emissions of 1.1 g SO2/kg for open biomass burning plumes measured specifically at Welgegund in the North-West Province. Hence open biomass burning will also contribute to the higher SO2 concentrations in the eastern than in the west of the study area.
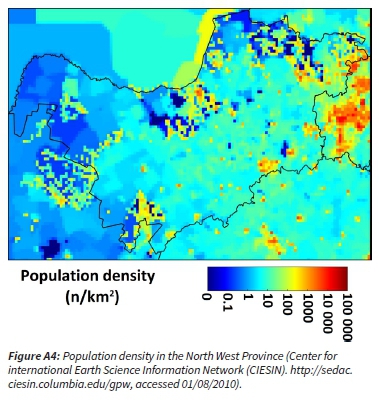
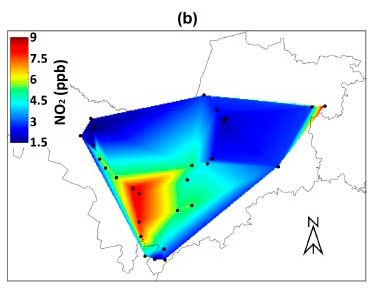
In contrast to the spatial map for SO2, the spatial concentrations map (Figure 8b) indicated two areas of higher concentration, i.e. the extreme east near Bapong and the area around Taung. As previously stated, the high number of large point sources and higher population density near Bapong will results in higher NO2 concentrations. Similarly, the higher population density around Taung (Figure A4, Appendix) and associated higher vehicle emissions result in higher NO2 concentrations there. The fact that the additional measurement sites, monitored during the intensive campaign, were situated next to the relatively busy R378 road, likely also contributed to the higher NO2 measured. The lowest NO2 concentrations were recorded at the Ottoshoop and Welgegund sites.
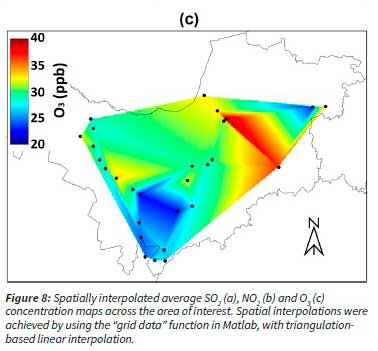
The O3 concentration spatial map (Figure 8c) exhibited almost the inverse spatial trend than the NO2 map (Figure 8b). Particularly the lower O3 measured around the Taung area is of interest. This low O3 concentration area, associated with higher NO2, suggests that O3 is being titrated there during night-time. The spatial map also shows that although significant industrial NO2 emissions do not occur in the western part of the North West Province, non-point source emissions (e.g. vehicle, household combustion and open biomass burning) emit enough NO2 to results in exceedances of the O3 standard limit there.
Conclusions and recommendations
With regard to SO2, the results indicated that it is unlikely that ambient air quality issues are persistent or wide spread in the western, more rural North West Province. Therefore, no monitoring of SO2 is currently required there. It was evident that SO2 was generally higher in the eastern North West Province that is located in, or in proximity to larger point sources. This includes the wBC (Rustenburg/Brits/Sun City area), where one monitoring site (Bapong) was situated. It is therefore recommended that compliance monitoring by industry and/ or government in such areas be continued and/or expanded if required.
The atmospheric chemistry of NO2 and O3 are linked to one another, therefore it makes sense discussing them together. The results indicated that widespread exceedances of the 8-hrs. moving standard limit of 61 ppb for O3 is likely across the entire province, even in the more rural western part. Therefore, systematic and continued measurement of O3 would be advisable, in order to quantify the problem and to estimate impacts better. No exceedances of the annual average limit were reported for NO2, nor were any exceedances of the 1-hr. standard limit predicted. However, tropospheric O3 can only form from NO2, hence it would be important to measure NO2 with O3. Measurements of and O3 in the Taung area would be particularly meaningful, since the spatial maps indicated that O3 is titrated there. The higher NO2 emitted from there is likely a regional source of O3, in addition to regional transport of NO2 from more well-known source areas such as the Mpumalanga Highveld, Vaal Triangle, JHB-Pta megacity and the wBC. Vehicle emissions is also an important source of NO2 across the province, which can only be addressed if the vehicular fleet is updated to higher specification over time and if road worthiness emission regulations are implemented. The release of nitrogen from the fuel consumed during household combustion is also an important source of NOx.
In future studies, particulate matter with an aerodynamic diameter < 2.5 μm (PM2.5) concentrations should be mapped across the province, since the health effect of ambient PM is likely to be more severe than the gaseous species considered in this study. For such a project, passive measurement of PM could also be considered and/or gravimetric filter-based measurements that do not require costly instrument, to make the project feasible. Lastly, it is recommended that possible future studies be augmented by dispersion modelling to at least partially address the non-gradual interpolation of spatial concentrations with triangulation-based linear interpolation that was used here.
Permission to publish
All co-authors agreed to the submission of this paper. The manuscript has not been published or offered elsewhere. Acknowledgment and references have made where required.
Acknowledgments
This work was funded by the Directorate Environmental Quality Management; Rural, Environment and Agricultural Development (READ), of the North West Provincial Government. The Welgegund, Marikana and Botsalano stations were operated through joint South African-Finnish collaboration. This publication also forms part of the output of the Biogeochemistry Research Infrastructure Platform (BIOGRIP) of the Department of Science and Innovation of South Africa, which supports the Welgegund station.
Author contribution
MN conducted the work as part of her MSc study; JPB, PGvZ, VL, PK and SM conceptualised the project; J-SS and MN prepared and analysed all samplers; VL, PK, SM and MN handled sampler logistics; JPB, MN and PGvZ drafted the paper; MK, VV, LL, JPB and PGvZ conceptualised and contributed to the operations of the Botsalano, Marikana and Welgegund stations. All co-authors edited and commented on drafts.
References
Adesina, J.A., Piketh, S.J., Qhekwana, M., Burger, R., Language, B. and Mkhatshwa, G. 2020, 'Contrasting indoor and ambient particulate matter concentrations and thermal comfort in coal and non-coal burning households at South Africa Highveld', Science of the Total Environment 699:134403. https://doi.org/10.1016/j.scitotenv.2019.134403 [ Links ]
Andreae, M.O. 2019, 'Emission of trace gases and aerosols from biomass burning - an updated assessment', Atmospheric Chemistry and Physics 19:8523-8546. https://doi.org/10.5194/acp-19-8523-2019 [ Links ]
Balashov, N. V., Thompson, A. M., Piketh, S. J., and Langerman, K. E. 2014, 'Surface ozone variability and trends over the South African Highveld from 1990 to 2007', Journal of Geophysical Research: Atmospheres 119:4323-4342. https://doi.org/10.1002/2013JD020555 [ Links ]
Boschetti, L., Roy, D., Hoffmann, A.A. 2009, MODIS Collection 5 Burned Area Product - MCD45. User's Guide Version 2.0. [ Links ]
Boschetti, L., Roy, D., Hoffmann, A.A., Humber, M. 2013, MODIS Collection 5.1 Burned Area Product - MCD45. User's Guide Version 3.0.1. [ Links ]
Chiloane, K.E., Beukes, J.P., Van Zyl, P.G., Maritz, P., Vakkari, V., Josipovic, M., Venter, A.D., Jaars, K., Tiitta, P., Kulmala, M., Wiedensohler, A., Liousse, C., Mkhatshwa, G.V., Ramandh, A. and Laakso, L., 2017, 'Spatial, temporal and source contribution assessments of black carbon over the northern interior of South Africa', Atmospheric Chemistry and Physics, 17:6177-6196. https://doi.org/10.5194/acp-17-6177-2017 [ Links ]
Conradie, E.H., Van Zyl, P.G., Pienaar, J.J., Beukes, J.P., Galy-Lacaux, C., Venter, A.D. and Mkhatshwa, G.V. 2016, 'The chemical composition and fluxes of atmospheric wet deposition at four sites in South Africa', Atmospheric Environment 146:113-131. https://doi.org/10.1016/j.atmosenv.2016.07.033 [ Links ]
DEA (Department of Environmental Affairs) 2010, The Highveld Priority Area air quality baseline assessment report 2010, Department Environmental Affairs, South Africa, ISBN: 0621396982, 9780621396980 [ Links ]
Dhammapala, R. 1996, Use of diffuse samplers for the sampling of atmospheric pollutants, MSc Dissertation, Potchefstroom University for CHE. [ Links ]
Draxler, R.R. and Hess, G.D. 2004, Description of the HYSPLIT 4 Modelling System. National Oceanic and Atmospheric Administration (NOAA) Technical Memorandum ERL ARL-224. [ Links ]
Dunnink, J.A., Curtis, C.J., Beukes, J.P., Van Zyl, P.G. and Swartz, J. 2016, 'The sensitivity of Afromontane tarns in the Maloti-Drakensberg region of South Africa and Lesotho to acidic deposition', African Journal of Aquatic Science, 41:413-426. https://doi.org/10.2989/16085914.2016.1244509 [ Links ]
Garstang, M., Tyson, M., Swap, R., Edwards, M., K°allberg, P., and Lindesay, J. A. 1996, 'Horizontal and vertical transport of air over southern Africa', Journal of Geophysical Research: Atmospheres 101:23721-23736. https://doi.org/10.1029/95JD00844 [ Links ]
Gierens, R.T., Henriksson, S., Josipovic, M., Vakkari, V., Van Zyl, P.G., Beukes, J.P., Wood, C.R., and O'Connor, E.J. 2019, 'Observing continental boundary-layer structure and evolution over the South African savannah using a ceilometer', Theoretical and Applied Climatology 136:333-346. https://doi.org/10.1007/s00704-018-2484-7 [ Links ]
Government Gazette (No. 27318) 2005, National Environment Management: Air Quality Act, 2004. [ Links ]
Government Gazette (No. 32816) 2009, National ambient air quality standards. [ Links ]
Government Gazette (No. 33600) 2010, Notice of intention to declare the Waterberg Priority Area. [ Links ]
Government Gazette (No. 35072) 2012, Highveld Priority Area air quality management plan. [ Links ]
Government Gazette (No. 43418) 2020, Draft second generation air quality management plan for Vaal Triangle Airshed Priority Area. [ Links ]
IPCC (Intergovernmental Panel on Climate Change) 2013, Climate Change 2013: The Physical Science Basis. Contribution of Working Group I to the Fifth Assessment Report, Stocker, T.F., D. Qin, G.-K. Plattner, M. Tignor, S.K. Allen, J. Boschung, A. Nauels, Y. Xia, V. Bex and P.M. Midgley (eds.), Cambridge University Press, Cambridge, United Kingdom and New York, NY, USA, 1535 pp. ISBN: 978-1-107-05799-1, 978-1-107-66182-0 [ Links ]
Jaars, K., Van Zyl, P.G., Beukes, J.P., Hellen, H., Vakkari, V., Josipovic, M., Venter, A.D., Räsänen, M., Knoetze, L., Cilliers, D.P., Siebert, S.J., Kulmala, M., Rinne, J., Guenther, A., Laakso, L., and Hakola, H. 2016, 'Measurements of biogenic volatile organic compounds at a grazed savannah grassland agriculture landscape in South Africa', Atmospheric Chemistry and Physics 16:15665-15688. https://doi.org/10.5194/acp-16-15665-2016 [ Links ]
Jaars, K., Vestenius, M., Van Zyl, P.G., Beukes, J.P., Hellen, H., Vakkari, V., Venter, M., Josipovic, M. and Hakola, H. 2018, 'Receptor modelling and risk assessment of volatile organic compounds measured at a regional background site in South Africa', Atmospheric Environment 172:133-148. https://doi.org/10.1016/j.atmosenv.2017.10.047 [ Links ]
Josipovic, M., Annegarn, H.J., Kneen, M.A., Pienaar, J.J. and Piketh, S.J. 2010, 'Concentrations, distributions and critical level exceedance assessment of SO2, NO2 and O3 in South Africa', Environmental Monitoring and Assessment 171:181-196. https://doi.org/10.1007/s10661-009-1270-5 [ Links ]
Katsouyanni, K., Schwartz, J., Spix, C., Touloumi, G., Zmirou, D., Zanobetti, A., Wojtyniak, B., Vonk, J.M., Tobias, A., Ponka, A., Medina, S., Bacharova, L. and Anderson, H.R. 1996, 'Short term effects of air pollution on health: a European approach using epidemiologic time series data: the APHEA protocol', Journal of Epidemiology and Community Health 20 (Suppl 1, S12-S18) [ Links ]
Laakso, L., Laakso, H., Aalto, P.P., Keronen, P., Petäjä, T., Nieminen, T., Pohja, T., Siivola, E., Kulmala1, M., Kgabi, N., Molefe, M., Mabaso, D., Phalatse, D., Pienaar, K. and Kerminen, V.-M. 2008, 'Basic characteristics of atmospheric particles, trace gases and meteorology in a relatively clean southern African savannah environment', Atmospheric Chemistry and Physics 8:4823-4839. https://doi.org/10.5194/acp-8-4823-2008 [ Links ]
Laakso, L., Vakkari, V., Virkkula, A., Laakso, H., Backman, J., Kulmala, M., Beukes, J.P., Van Zyl, P.G., Tiitta, P., et al. 2012, 'South African EUCAARI measurements: seasonal variation of trace gases and aerosol optical properties', Atmospheric Chemistry and Physics 12:1847-1864. https://doi.org/10.5194/acp-12-1847-2012 [ Links ]
Laakso, L., Beukes, J.P., Van Zyl, P.G., Pienaar, J.J., Josipovic, M., Venter, A.D., Jaars, K., Vakkari, V., Labuschagne, C., Chiloane, K. and Tuovinen, J-P. 2013, Chapter 20: Ozone Concentrations and Their Potential Impacts on Vegetation in Southern Africa, In: R. Matyssek, N. Clarke, P. Cudlin, T.N. Mikkelsen, J.-P. Tuovinen, G. Wieser and E. Paoletti (eds.), Developments in Environmental Science, 13:429-450, Elsevier, ISSN: 1474-8177, ISBN: 9780080983493. [ Links ]
Laban, T.L., Van Zyl, P.G., Beukes, J.P., Vakkari, V., Jaars, K., Borduas-Dedekind, N., Josipovic, M., Thompson, A.M., Kulmala, M. and Laakso, L. 2018, 'Seasonal influences on surface ozone variability in continental South Africa and implications for air quality', Atmospheric Chemistry and Physics 18:15491-15514. https://doi.org/10.5194/acp-18-15491-2018 [ Links ]
Lourens, A.S, Beukes, J.P., Van Zyl, P.G., Fourie, G.D., Burger, J.W., Pienaar, J.J., Read, C.E. and Jordaan, J.H.L. 2011, 'Spatial and Temporal assessment of Gaseous Pollutants in the Mpumalanga Highveld of South Africa', South African Journal of Science, 107(1/2), Art. #269, 8 pp, https://doi.org/10.4102/sajs.v107i1/2.269 [ Links ]
Lourens, A.S.M., Butler, T.M., Beukes, J.P., Van Zyl, P.G., Beirle, S., Wagner, T., Heue, K-P., Pienaar, J.J., Fourie, G.D., Lawrence, M.G. 2012, 'Re-evaluating the NO2 hotspot over the South African Highveld', South African Journal of Science, 108(11/12), Art. #1146, 6 pp. https://doi.org/10.4102/sajs.v108i11/12.1146 [ Links ]
Lourens, A.S.M., Butler, T.M., Beukes, J.P., Van Zyl, P.G., Fourie, G.D. and Lawrence, M.G. 2016, 'Investigating atmospheric photochemistry in the Johannesburg-Pretoria megacity using a box model', South African Journal of Science, 112(1/2), Art. #2015-0169, 11 pp. https://doi.org/10.17159/sajs.2016/2015-0169 [ Links ]
Martins, J.J., Dhammapala, R.S., Lachmann, G., Galy-Lacaux, C. and Pienaar, J.J. 2007, 'Long term measurements of sulphur dioxide, nitrogen dioxide, ammonia, nitric acid and ozone in Southern Africa using passive samplers', South African Journal of Science 103:336-342. [ Links ]
Moskalyk, R.R. and Alfantazi, A.M. 2003, 'Processing of vanadium: a review', Minerals Engineering 16:793-805. https://doi.org/10.1016/S0892-6875(03)00213-9 [ Links ]
Mucina, L., Rutherford, M.C. 2006, The Vegetation of South Africa, Lesotho and Swaziland, South African, Strelitzia 19. South African National Biodiversity Institute, Pretoria, 807 pp. ISBN: 1919976213, 9781919976211 [ Links ]
Pandey, J.K., Kumar. R. and Devotta, S. 2005, 'Health risks of NO2, SPM and SO2 in Delhi (India)'. Atmospheric Environment 39:6868-6874. https://doi.org/10.1016/j.atmosenv.2005.08.004 [ Links ]
Pienaar, J.J., Beukes, J.P., Van Zyl, P.G., Lehman, C.M.B. and Aherne, J., 2015, Chapter 2: Passive diffusion sampling devices for monitoring ambient air concentrations, In: Forbes, P. (ed.), Monitoring of air pollutants - Samling, sample, preparation and analytical techniques, 70:13-52, Elsevier. https://doi.org/10.1016/bs.coac.2015.09.002, ISBN: 978-0-444-63553-2. [ Links ]
Piketh, S., Van Nierop, M., Rautenbach, C., Walton, N., Ross, K., Holmes, S., Richards, T. 2005, Rustenburg Local Municipality Air Quality Management Plan, Gondwana Environmental Solutions (Pty) Ltd, 161 pp. [ Links ]
Roy, D.P., Boschetti, L., Justice, C.O., and Ju, J. 2008, 'The collection 5 MODIS burned area product - global evolution by comparison with the MODIS active fire product', Remote Sensing of Environment 112:3690-3707. https://doi.org/10.1016/j.rse.2008.05.013 [ Links ]
Seinfeld, J.H. and Pandis, S.N. 2016, Atmospheric Chemistry and Physics: From Air Pollution to Climate Change, John Wiley & Sons, 1152 pp. ISBN: 978-1-118-94740-1 [ Links ]
Swartz, J.-S., Van Zyl, P.G., Beukes, J.P., Labuschagne, C., Brunke, E.-G., Portafaix, T., Galy-Lacaux, C. and Pienaar, J.J., 2020, 'Twenty-one years of passive sampling monitoring of SO2, NO2 and O3 at the Cape Point GAW station, South Africa', Atmospheric Environment 222:117128. https://doi.org/10.1016/j.atmosenv.2019.117128 [ Links ]
Tyson, P. D. and Preston-Whyte, R. A. 2000, The Weather and Climate of Southern Africa, Oxford University Press, 408 pp, ISBN:0-19-571806-2. [ Links ]
Vakkari, V., Laakso, H., Kulmala, M., Laaksonen, A., Mabaso, D., Molefe, M., Kgabi, N. and Laakso, L. 2011, 'New particle formation events in semi-clean South African savannah', Atmospheric Chemistry and Physics, 11:3333-3346. https://doi.org/10.5194/acp-11-3333-2011 [ Links ]
Vakkari, V., Beukes, J.P., Laakso, H., Mabaso, D., Pienaar, J.J., Kulmala, M. and Laakso, L. 2013, 'Long-term observations of aerosol size distributions in semi-clean and polluted savannah in South Africa', Atmospheric Chemistry and Physics 13:17511770. https://doi.org/10.5194/acp-13-1751-2013 [ Links ]
Vakkari, V., Tiitta, P., Jaars, K., Croteau, P., Beukes, J.P., Josipovic, M., Kerminen, V-M., Kulmala, M., Venter, A.D., Van Zyl, P.G. Worsnop D.R. and Laakso, L. 2015, 'Reevaluating the contribution of sulfuric acid and the origin of organic compounds in atmospheric nanoparticle growth', Geophysical Research Letters, 42:10486-10493. https://doi.org/10.1002/2015GL066459 [ Links ]
Vakkari, V., Beukes, J. P., Josipovic, M. and van Zyl, P. G. 2020, 'Observations of ozone formation in southern African savanna and grassland fire plumes' Atmosphercv Environment 223:117256. https://doi.org/10.1016/j.atmosenv.2019.117256 [ Links ]
Van Zyl, P.G., Beukes, J.P., Du Toit, G., Mabaso, D., Hendriks, J., Vakkari, V., Tiitta, P., Pienaar, J.J., Kulmala, M. and Laakso, L. 2014, 'Assessment of atmospheric trace metals in the western Bushveld Igneous Complex, South Africa', South African Journal of Science, 110(3/4), Art. #2013-0280, 11 pp. https://doi.org/10.1590/sajs.2014/20130280 [ Links ]
Venter, A.D., Vakkari, V., Beukes, J.P., Van Zyl, P.G., Laakso, H., Mabaso, D., Tiitta, P., Josipovic, M., Kulmala, M., Pienaar J.J. and Laakso, L. 2012, 'An air quality assessment in the industrialised western Bushveld Igneous Complex, South Africa', South African Journal of Science, 108(9/10), Art. #1059, 10 pp. https://doi.org/10.4102/sajs.v108i9/10.1059 [ Links ]
Venter, A.D., Beukes, J.P., Van Zyl, P.G., Josipovic, M., Jaars, K. and Vakkari, V. 2016, 'Regional atmospheric Cr(VI) pollution from the Bushveld Complex, South Africa', Atmospheric Pollution Research 7:762-767. https://doi.org/10.1016/j.apr.2016.03.009 [ Links ]
Venter, A.D., Van Zyl, P.G., Beukes, J.P., Swartz, J-S, Josipovic, M., Vakkari, V., Laakso L. and Kulmala, M. 2018, 'Size resolved characterisation of inorganic ionic species in atmospheric aerosols at a regional background site on the South African Highveld Air Quality', Journal of Atmospheric Chemistry, 72:285304. https://doi.org/10.1007/s10874-018-9378-z [ Links ]
Venter, M., Beukes, J.P., Van Zyl, P.G., Vakkari, V., Virkkula, A., Josipovic, M., Kulmala, M. and Laakso, L. 2020, 'Six-year observations of aerosol optical properties at a southern African grassland savannah site', Atmospheric Environment 230:117477. https://doi.org/10.1016/j.atmosenv.2020.117477 [ Links ]
Xiao, Z., and Laplante, A.R. 2004, 'Characterizing and recovering the platinum group minerals - a review', Minerals Engineering 17:961-979. https://doi.org/10.1016/j.mineng.2004.04.001 [ Links ]
Received: 22 October 2020
Reviewed: 4 February 2021
Accepted: 1 June 2021
Appendix