


Servicios Personalizados
Articulo
 Inglés (pdf)
 Articulo en XML
 Referencias del artículo
Indicadores

Links relacionados
-
 Citado por Google
 -
 Similares en Google
Compartir

 Permalink
Clean Air Journal
versión On-line ISSN 2410-972X
versión impresa ISSN 1017-1703
Clean Air J. vol.31 no.1 Pretoria 2021
http://dx.doi.org/10.17159/caj/2021/31/1.8954
RESEARCH ARTICLE
Ambient air quality data reported at Sasol Secunda monitoring stations during COVID-19 lockdown - Mpumalanga, South Africa
Andrew D. VenterI; Alexandra S. M. LourensII
IEnvironmental air quality group, Sasol Secunda Operations, Mpumalanga, South Africa andrew.venter@sasol.com
IIEnvironmental air quality group, Sasol Secunda Operations, Mpumalanga, South Africa
ABSTRACT
Various local and international research has been published on the effects of COVID-19 lockdown on ambient air quality. In most cases, a reduction in ambient NOx and PM concentrations have been observed with varying changes in ambient SO2 levels. The Mpumalanga province of South Africa is known for its large industrial facilities utilising coal as primary feedstock and is located in the Highveld Priority Area. The ambient air quality in the Secunda region of Mpumalanga province was assessed. This region contains, amongst others, the towns of Secunda, Trichardt and eMbalenhle from which the majority of the Sasol Secunda workforce originates. This specific region was assessed due to the authors' familiarity with the Sasol facility and the strategic locations of ambient air quality stations, as well as the known changes in human behaviour during the lockdown period.
Results show decreases in ambient CO, NOx and PM concentrations, especially during the first two weeks of lockdown. Only smaller changes were observed for ambient H2S and SO2 concentrations at the ambient monitoring stations. An increasing trend in all ambient species was observed towards the end of- and post lockdown in addition to declining ambient temperatures with the onset of winter. This is in spite of the reduction in emissions from the factory that conducted annual maintenance in the month following lockdown (phase shutdown).
This article concludes that community behaviour has a material local ambient impact on CO, NOx and PM pollutant species, while H2S concentration profiles are more directly related to the local industrial complex's levels of activity. Ambient SO2 trends did not show a similar correlation with the facility's activities, but a stronger correlation was observed with diverse local and regional sources on the Highveld. The influence of effective stack emission heights for better dispersion, especially for SO2 and on a local scale, is considered material. Meteorological factors has been shown to be a substantial contributor to observed ambient air quality levels in the study domain.
Keywords: Ambient air quality, COVID-19, highveld priority area, nitrogen oxides, particulate matter, sulphur dioxide, hydrogen sulphide
Introduction
Sasol Secunda, a petrochemical industry, is located within the Highveld Priority Area, Mpumalanga provine. Sasol owns and operates nine ambient air quality measurement stations in close proximity to the facility. The results obtained from these stations are crucial in delivering accurate information on air quality in the Mpumalanga region and form part of the national data base.
On 15 March 2020 the president of South Africa declared a National State of Disaster due to the COVID-19 pandemic and introduced a total lockdown. The national Level 5 (L5) lockdown, the most severe form of lockdown, commenced on 27 March 2020 and was relaxed to level 4 (L4) on 1 May 2020. 1 June 2020 brought about further relaxations with the onset of Level 3 (L3) lockdown, each level allowing for more freedom of movement and economic activity.
These lockdown periods gave rise to unprecedented opportunities to study the impact of economic activity and social behavior on ambient air quality. This article describes the measurements and observations made during the lockdown at the towns of Secunda and eMbalenhle. The study period of 1 February 2020 - 30 June 2020 was chosen to ensure a pre- and post-lockdown baseline is included. Moreover, the influence of lower industrial activity at Sasol Secunda due to annual maintenance during the L4 period (May 2020), as well as human behavior recorded during the lockdown period will be elaborated on.
Ambient air quality monitoring stations
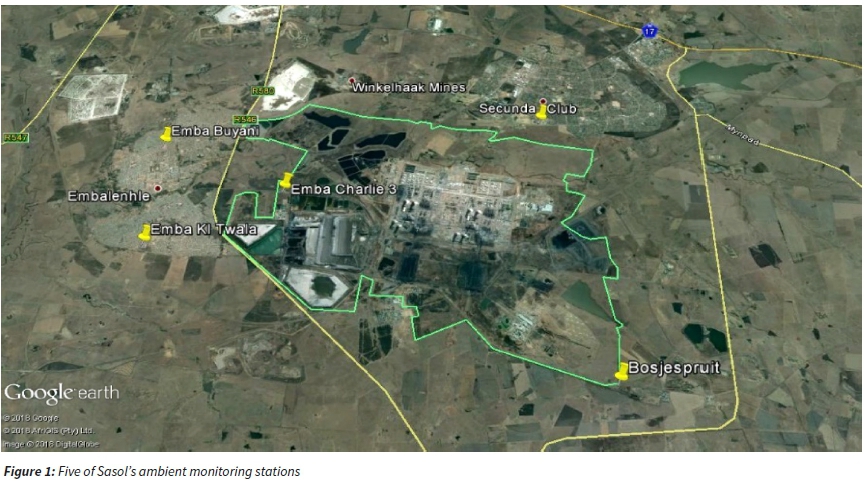
Sasol Secunda owns nine ambient air quality monitoring stations that are located within the Mpumalanga province and surround the Secunda facility. Three of the nine are located within the communites immediately adjacent to the facility as indicated in Figure 1. All monitoring stations measure basic metereological parameters i.e. temperatures, wind speed, wind direction, rainfall and humidity while six stations closest to Sasol Secunda measure atmospheric pollutants: O3, SO2, CO, PM25 and PM, H2S and NOx. Three background stations located in Amersfoort, Springs and Grootvlei measure only H2S. All the stations are accredicated under SANAS ISO/IEC 17025:2017. The measurement stations are visited regulary for maintenance and upkeep, these include bi-monthly zero and span verifications and quarterly indepent dynamic gas calibrations on all stations. The stations report realtime to the South African Air Quality Information System (SAAQIS), however, downloaded data is quality assured before reporting.
The data quality assurance excludes any periods of uncertainty, power failures and recovery, calibrations, checks and maintenance.
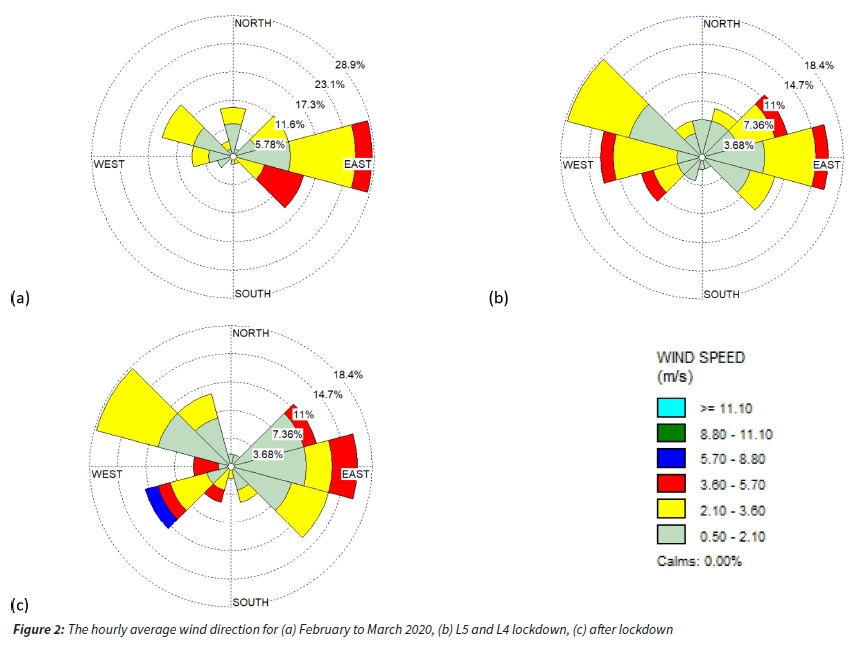
In Figure 2 the wind roses for Secunda (from Secunda Club monitoring station) for the period pre-, post- and during levels four and five of lockdown are shown (February to June 2020). The reported meteorological data from Secunda Club is in excellent agreement with measurements from the eMbalenhle station. Figure 2 shows the variation in wind speed by colour grouping and the frequency distribution is indicated by the percentage markers. For Figure 2(a) the wind rose prior to lockdown shows little wind from the South West with highest wind speeds from the Eastern regions. The frequency distribution shows that less than 30% of the time the wind direction would be directly West. Lower wind speeds (yellow and grey) are prevalent during the months of investigation. During April and May in Figure 2(b) a more even wind distribution is seen from the West North West (~30%) and from the East North East (~27%). After lockdown in Figure 2(c), the highest wind speeds (5.7 - 8.8 m/s) were recorded towards the North West (total of of the time) with wind blowing from the East accounting for ~39% of the total. The dominant wind direction was from the North West to the South East and from the East towards the West with some fluctuations to the North and South. While some West and Easterly winds are noted, directly North or South winds are near absent.
To further investigate the impacts of the factory and possible community behavioural changes during lockdown, the eMbalenhle station was selected since it is located due east of the factory and between the factory and the community, and is therefore expected to yield results from both industry and community. The graphs from Sasol club air quality monitoring station (Secunda) showed very similar trends and are therefore not presented in this paper.
Results
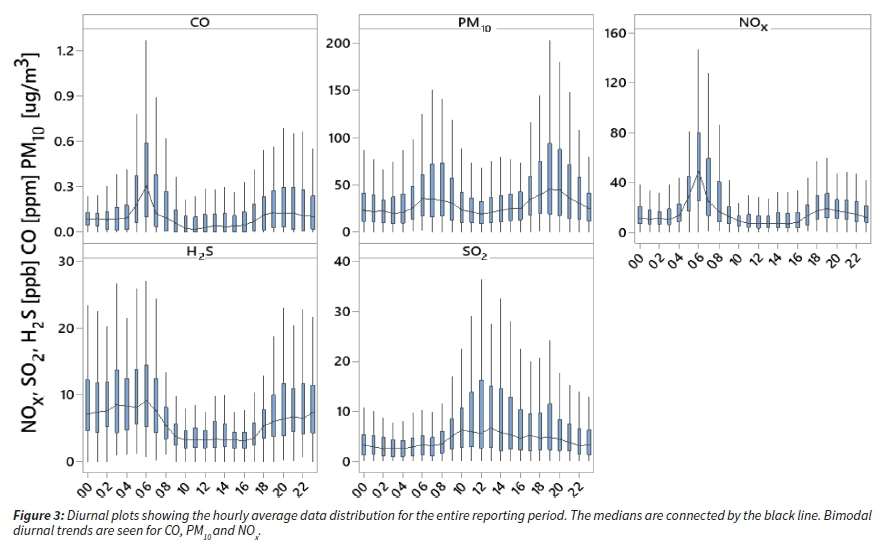
In Figure 3, diurnal plots showing the hourly average data distribution for the entire reporting period is presented. The medians are connected by the black line. Bimodal diurnal trends are seen for CO, PM10 and NOx. Bimodal peaks are typically associated with domestic activity since the peak times coincide with traffic, cooking, etc (Malaza 2017, Clerbaux et al. 2008, Venter et al. 2015). The H2S trend indicates an inverse relation between day and night and is typical the results of prevailing meteorological conditions. During the evenings stable atmospheric conditions are persistent in the region, thereby trapping local ground level emissions and only allowing proper dispersion during the daytime hours when the atmospheric turbulence increases with the heating of the earth's surface. Another trend influenced by the atmospheric turbulence during the day is SO2 , where peaks during mid-day. The design of the tall stacks is to emit above the surface inversion layer and only when the atmosphere is most unstable, plumes are forced to ground level. The surface inversion layer thereby acts as a buffer to local communities and promotes long range dispersion.
These average trends have been further unpacked in the individual time-series sections below to investigate any changes during lockdown and industry maintenance.
Carbon monoxide (CO)
Carbon monoxide (CO) is a typical marker pollutant of combustion (Clerbaux et al. 2008, Venter et al. 2015). In the natural environment, veld fires will also produce CO amongst other components. Mostly, CO links to human activities and incomplete combustion (Venter et al. 2012). Some activities include industrial combustion (like coal combustion for steam generation) and domestic cooking and space heating. CO (Figure 4) as measured at the ambient air quality station adjacent to the Secunda factory and eMbalenhle community (Sasol Secunda Operations Embalenhle air monitoring station) was investigated. In the months prior to lockdown CO shows some diurnal variation but on average remains stable with no discernible trend. The monthly average ambient CO concentrations from 2015 to 2019 are shown by the grey line while the monthly average temperatures are indicated by the green line. When L5 lockdown commenced, a slight decrease (orange) in ambient CO was observed, while an increase can be seen during L4 lockdown and thereafter (blue). Although Sasol Secunda did reduce production during L5 (in line with a decreased demand) and utilised the L4 lockdown to conduct annual maintenance, the ambient concentrations do not reflect this reduced industrial activity, showing rather an increase in ambient CO concentrations as winter approaches. An inverse relation can be seen between the average daily ambient temperature (yellow) and CO. A five year ambient temperature trend (green) was compiled. 2020 was on average ~2 °C cooler than 2016 for the reporting period but compared well with the average ambient temperatures in 2018. It can therefore not be concluded that 2020 was abnormally cold or different than preceding years.
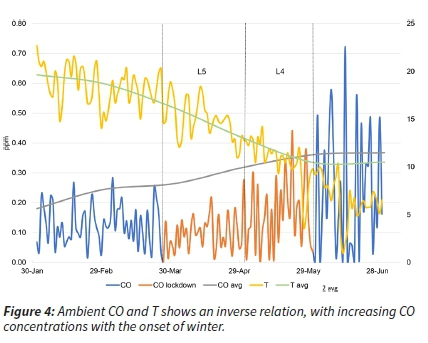

During lockdown domestic travel was forbidden, schools closed and families remained indoors and therefore more time was spent cooking, especially during the Easter long weekend of 10 -13 April 2020. A few local residents also reported increased local activity during L4. With the onset of winter, domestic heating also increased. Local residents also reported increased waste burning due to poor service delivery and veld fires towards the dry winter season. While industry operated at a constant rate (before and after lockdown), a strong diurnal pattern could be attributed to domestic heating during the colder night temperatures and the formation of stable atmospheric inversion layers towards the winter months.
Particulate matter (PM25 and PM10)
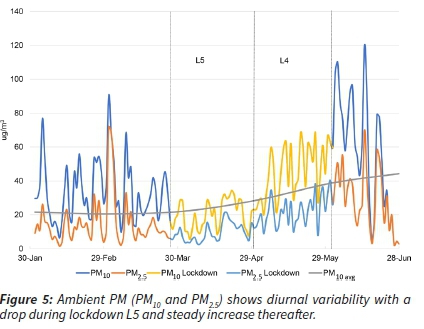
Ambient particulate matter (PM) concentrations are regulated by the national ambient air quality standards (NAAQS) for particles smaller than 10 micron (PM10) and 2.5 micron (PM2.5). PM is specifically regulated because it has been identified as a health concern on the Mpumalanga Highveld and elsewhere in South Africa - the Highveld itself being declared a priority area, viz. Highveld Priority Area (Lourens et al. 2011). Ambient PM originates from various sources including windblown dust (agriculture, roads, tailing dams, etc.) and as a product of combustion. PM is especially problematic during the dry season since rain not only scrubs the atmosphere, but also aids in supression. In addition to industrial sources of PM, during colder months domestic cooking and space heating as well as veld fires produce PM. (Venter et al. 2012). Therefore, an increase in PM is typically seen between May and September every year (Lourens et al. 2011). In Figure 5 the PM measurements before lockdown are low on average (PM10 ~33 μg/m3 and PM25 ~14 μg/m3) with some elevated days. During the first days of L5 lockdown, PM ambient concentrations are on average lower with less variability with PM10 values of 16 μg/m3 and PM25 of 6 μg/m3. This may be due to both lower domestic and industrial activity. However, the PM concentration increases with more variability in May, even though Sasol industrial activity is still limited due to the annual maintenance. Higher PM concentrations are observed after L4 lockdown, with industrial activity remaining stable. This trend follows the discussion on CO and the change in environmental conditions, i.e. the lower ambient temperatures with the onset of winter. A decrease in ambient PM is noted towards the end of June. Further investigation showed that the nights preceding the 26 June 2020 had prolonged hourly average temperatures below freezing with minima as low as -5.8 °C. Some rain events were also detected during this week. The first day with low ambient PM measurements, the 26 June 2020, only had two hours below freezing with a minimum of -1.8 °C. The increase in daily average temperatures likely resulted in less space heating that affected ambient PM concentrations. The daily average wind direction was mostly from the East and North East towards the factory. The grey line represents the average PM10 from 2015 to 2019. It can be noted that an increase in PM during the onset of winter is a reoccurring trend. Also the PM during lockdown was lower than the reported average but higher outside of the lockdown periods.
Nitrogen oxides (NO and NO2)
Ambient NOx is naturally produced by lightning and during veld fires. Anthropogenically NOx is produced during combustion such as industrial activities, cooking and space heating as well as vehicular emissions (Ross et al. 2007, Venter et al. 2012). High levels of NO2 have been observed over the highveld of South Africa using satellite-based proxies (Lourens et al. 2012) and these elevated levels are generally attributed to industrial activity (Josipovic et al, 2009, Laakso et al, 2012). This cannot be directly linked to ground based measurements considering industrial sources emit well above ground level at elevated heights as is supported by the design intent of tall stacks, to emit pollutants even above the surface inversion layer for adequate dispersion and to least impact ground based receptors such as communities. A limitation of satellite measurements is their overpass frequency and time, i.e. once a day and not capturing morning/evening peaks (Lourens et al. 2012). Investigating ambient NOx concentrations, utilising ground level measurement data, during the pandemic period gives a unique insight to the contributing sources. While Figure 6 indicates a similar trend to PM and CO, due to lockdown restrictions a data gap exists because essential instrument maintenance could not be performed. NOx concentrations differ before and after lockdown and increase during the onset of winter and fewer restrictions on mobility. The average NOx concentrations from 2015 to 2019 are indicated by the grey line. It can be noted that NO is always present and not completely converted to NO2 as it would be for an aged air mass or a background site (Malaza 2017), thereby indicating sources of NO in close proximity to the ambient measurement station. It is also noted that peak NO and NO2 events are not always related, thereby indicating long range transport of NO2 from distant sources. The NO concentration seldom exceeds the NO2 concentration, also indicating that large primary emission sources seldom contribute to the ambient measurements described here.
Hydrogen sulphide (H2S)
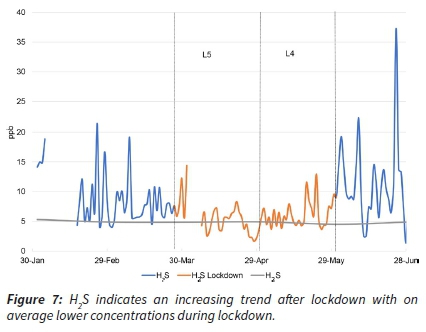
Ambient H2S is typically associated with sewerage plants, abattoirs and industrial emissions relating to sulphur (Rubright et al. 2017, Chou et al. 2016). Some H2S will also be emitted during domestic cooking and space heating when coal is used. From Figure 7, pre and post lockdown ambient averages of H2S are similar. Further more, the average (2015 - 2019), as indicated by the grey line, shows almost no variability irrespective of the season or known economic activity such as lockdown. This is expected from an industrial emissions point of view and is in contrast to PM, NOx and CO as discussed. Some high peaks were recorded after lockdown which could be an indication of the onset of winter with stronger inversion layers that trap low level pollution or result in peaks with the breakup of inversion layers. This is supported by the diurnal plots in Figure 3. The higher peaks during winter observed in this paper correlate with prominent peaks observed during winter months at Elandsfontein (Mpumalanga province) and attributed to inversion layers and possibly long range transport (Cogho 2019). A slightly lower average is observed during lockdown which can be ascribed to lower emissions emitted from an industrial point source. However, the nearby Elandsfontein ambient station reported an H2S source apportionment of 14,3% from the Secunda region, urban emissions contributed 41,3% in excess of the baseline H2S concentrations, the Johannesburg-Pretoria conurbation 15,3% and finally, pyrometallurgical smelters, coal-fired power stations and cattle feedlots contributed 11.2%, 5.9% and 1.0% respectively to the ambient H2S in excess of the baseline (Cogho 2019). These urban sources are expected to be heavily influenced by lockdown restrictions.
Sulphur dioxide (SO2)
Similarly to H2S, SO2 concentrations at ambient level differ only slightly before and after lockdown with averages mostly similar (Figure 8). A slight decrease in ambient SO2 is seen during lockdown. This may be attributed to lower anthropogenic emissions in general. The clear inverse trend with daily average ambient temperatures as was seen with CO, is not evident although variability increases. Further, the average (grey line) does show more variability than in Figure 7 but less than Figures 4 - 6. Ambient SO2, being a prominent industrial pollutant (Josipovic et al, 2009, Laakso et al 2012, Lourens et al, 2011, Venter et al. 2012), is expected to follow the trend of nearby point source emissions. The reduction in factory SO2 emissions is not clearly reflected in the ambient measurements. The weak correlation may suggest the co-contribution of other sources in the Highveld region other than the local Sasol Secunda influence. In addition, the influence of better dispersion especially on a local scale brought about by more effective emission heights of the industrial sources is considered material. SO2 is therefore considered a regional pollutant.

Contextualization
Comparison of Sasol Secunda measurements with other literature observations is presented in Table 1.
The results from this study are in agreement and show the impact of lockdown on ambient PM and NOx concentrations, especially during the first two weeks of L5 lockdown. The increase in ambient concentrations after L4 lockdown can be ascribed to both seasonal changes and the increase in socioeconomic activity.
Conclusion
During the period of assessment, ambient air quality changes could be seen relating to reduction of factory emissions, local community behaviour, Highveld sources in general as well as seasonal changes. The impact of lockdown 2020, was noticeable in the ambient air quality data, with a strong reduction (in all pollutants) during the first two weeks of lockdown and a strong increase after lockdown. Ambient PM and CO did not show a clear relationship to local factory shutdowns. A better correlation with seasonal changes was found. A decrease in ambient NO2 measurements agreed well with the lockdown periods, likely relating to lower vehicular emissions. Increased ambient NO in the late stages of lockdown and thereafter agree with the colder months, increased community based activities, waste burning and veld fires (dry season). H2S trends correlated well with local factory activities, however, some peaks remain unexplained and may be the result of long range transport. SO2 had some relation to local factory emissions while some anomalies could not be explained. The data suggest a significant contribution of sources outside the study domain.
References
Chou S., Ogden J.M., Phol H.R., Scinicariello F., Ingerman L., Barber, L. & Citra M. 2016, 'Toxicalogical profile for hydrogen sulphide and carbonyl sulphide', Agency for Toxic Substances and Disease Registry: Atlanta, GA [ Links ]
Clerbaux C., Edwards D.P., Deeter M., Emmons L., Lamarque J-F., Tie X.X., Massie ST. & Gille J. 2008, 'Carbon monoxide pollution from cities and urban areas observed by the Terra/ MOPITT mission' Geopysical research letters, 35(L03817) doi:10.1029/2007GL032300. [ Links ]
Cogho E. 2019, 'Source apportionment of hydrogen sulphide at Elandsfontein in Mpumalanga Highveld' Dissertation Masters. North- West University. [ Links ]
Josipovic M., Annegarn H.J., Pienaar J.J., Piketh S.J. 2009, 'Concentrations, distributions and critital level exceedance assessment of SO2, NO2 and O3', South Africa, Environmental monitoring assessment, DOI 10.1007/s10661-009-1270-5 [ Links ]
Garland R., Naidoo M. John J., Kwatala N., Naidoo S., Marais E. 2020, 'Impacts of COVID-19 lock-down measures on air quality over the Highveld: Initial assessment. Joint Online Seminar Department of Environment', Forestry and Fisheries and the National Association for Clean Air, COVID-19 and Air Quality in South Africa. [ Links ]
Laakso L., Vakkari V., Virkkula A., Laakso H., Backman J., Kulmala M., Beukes J. P., van Zyl P. G., Tiitta P., Josipovic M., Pienaar J. J., Chiloane K., Gilardoni S., Vignati E., Wiedensohler A., Tuch, T., Birmili W., Piketh S., Collett K., Fourie G. D., Komppula M., Lihavainen H., de Leeuw G. & Kerminen V.-M. 2012, 'South African EUCAARI measurements: seasonal variation of trace gases and aerosol optical properties', Atmosospheric Chemistry Physics, 12 -p1847-1864, https://doi.org/10.5194/acp-12-1847-2012 [ Links ]
Lourens A.S.M., Beukes J.P., Van Zyl P.G., Fourie G.D., Burger J.W., Pienaar J.J., Read C.E. & Jordaan J.H. 2011, 'Spatial and Temporal assessment of Gaseous Pollutants in the Mpumalanga Highveld of South Africa', South African Journal of Science, 107(1/2). p1-8. [ Links ]
Lourens A.S.M., Butler T.M., Beukes J.P., Van Zyl P.G., Beirle S. & Wagner T. 2012, 'Re-evaluating the NO2 hotspot over the South African Highveld', South African Journal of Science, 108(11/12). p1-6. [ Links ]
Malaza L.S. 2017, 'An assessment of spatial and temporal variations of nitrogen dioxide over Mpumalanga highveld'. MSc, Johannesburg, 2017 [ Links ]
Piketh S.J., Burger R.P., Havenga H., Mbatha N. 2020, 'Unpacking source contributions to air quality during COVID-19 lockdown', Joint Online Seminar Department of Environment, Forestry and Fisheries and the National Association for Clean Air, COVID-19 and Air Quality in South Africa. [ Links ]
Ross K., Broccardo S., Heue K-P., Ferguson K. & Piketh S. 2007, 'Nitrogen oxides on the South African Highveld', Clean Air Journal, 2 (16). [ Links ]
Venter A. D., Vakkari V., Beukes J.P., Van Zyl P.G., Laakso H., Mabaso D., Tiita P., Josipovic M., Kulmala M., Pienaar J.J., Laakso L. 2012, 'An air quality assessment in the industrialised western Bushveld Igneous Complex', South Africa, South African Journal of Science, 108(9-10). p1-10 [ Links ]
Venter A.D., Jaars K., Booyens W., Beukes J.P., Van Zyl P.G., Josipovic M., Hendriks J., Vakkari V., Hellen H., Hakola H., Aaltonen H., Ruiz-Jimenez J., Riekkola M.L. & Laakso L. 2015, 'Plume characterization of a typical South African braai', South African Journal of Chemistry, 68. p181-194 [ Links ]
Rubright, S.L.M., Pearce, L.L. & Peterson, J. 2017, 'Environmental toxicology of hydrogen sulfide', Nitric Oxide, 71, 1-13, doi:10.1016/j.niox.2017.09.011 [ Links ]
Received: 21 September 2020
Reviewed: 22 October 2020
Accepted: 4 March 2021

