


Services on Demand
Article
 English (pdf)
 Article in xml format
 Article references
Indicators

Related links
-
 Cited by Google
 -
 Similars in Google
Share

 Permalink
Clean Air Journal
On-line version ISSN 2410-972X
Print version ISSN 1017-1703
Clean Air J. vol.31 n.1 Pretoria 2021
http://dx.doi.org/10.17159/caj/2020/31/1.9413
RESEARCH ARTICLE
Intra-urban variability of PM2.5 in a dense, low-income settlement on the South African Highveld
Simon D. MoletsaneI; Farina. LindequeI, II; Brigitte. LanguageI; Ncobile C. NkosiI; Joseph A. AdesinaI; Roelof P. BurgerI; Gabi. MkhatshwaIII; Stuart J. PikethI
IUnit for Environmental Sciences and Management, North-West University, Potchefstroom, 2520, simonmoletsane47@gmail.com https://orcid.org/0000-0001-9164-9910, https://orcid.org/0000-0002-2221-8225, https://orcid.org/0000-0002-0123-1498, https://orcid.org/0000-0003-3469-4242, https://orcid.org/0000-0002-4359-4588, https://orcid.org/0000-0002-2804-879X
IIGeography and Environmental Studies, University of Limpopo, Sovenga, 0727, farina.lindeque@ul.ac.za, https://orcid.org/0000-0002-2221-8225
IIIEskom Research, Testing and Development (RT&D), Rosherville Cleveland, Johannesburg, 2022, gabi.mkhatshwa@eskom.co.za, https://orcid.org/0000-0002-3047-5344
ABSTRACT
High concentrations of the ambient particulate matter remain a concern on the South African Highveld, particularly in densely populated low-income settlements. These areas have several local emission sources that contribute to poor air quality and are often located close to industrial and other urban areas. The local sources vary in magnitude, space, and time. In South Africa, little has been done to assess the impacts of spatiotemporal variability on the credibility of using isolated ambient observations for regulatory purposes. This study aims to evaluate the intra-urban variability of ambient PM25 concentrations in a dense, low-income community. Ambient fine particulate matter (PM25) in distinct microenvironments of KwaZamokuhle were simultaneously measured at 4 sites between March and June 2018. These measurements were collected using one permanent ambient monitoring station (AMS) and a temporary network of three E-BAM monitors (Site 2, Site 3, and Site 4). Moreover, the 2011 Census spatial data was used to assess socioeconomic conditions impacting PM25 concentrations in areas surrounding each monitoring station. The daily PM25 concentrations at AMS, Site 2, Site 3, and Site 4 varied from 10 to 86 μg.m-3, 10 to 103 μg.m-3, 11 to 101 μg.m-3, and 9 to 113 μg.m-3, respectively. Extreme PM25 concentrations which exceeded the 24h PM25 NAAQS of 40 μg.m-3 were seen during the cold period (May and June); meanwhile, the warm period (March and April) recorded relatively lower PM25 episodes across different sections of KwaZamokuhle. During May-June, the highest diurnal concentrations of hourly averaged ambient PM25 were recorded at Site 4, in a downward sequence, followed by Site 3, Site 2, and AMS. It was further found that informal dwellings and solid fuel reliant houses are widely concentrated at Site 4 thus, indicating exposure inequalities across the community. This study, therefore, highlights the complexity of quantifying ambient air quality in an area where several local emission sources vary in space and time. Attempts to use monitoring data from a single station to assess ambient air quality, quantify human exposure, or evaluate the potential impacts of mitigation strategies in dense, low-income settlements should be done with care.
Keywords: fine particulate matter, household air pollution, low-income settlements, South African Highveld, air quality management
Introduction
Exposure to ambient fine particulate matter (PM2.5) pollution was the fourth leading global risk factor for premature mortality in 2019, contributing to 6.7 million early deaths (12% of total deaths globally) (Murray et al., 2020). Exposure to household air pollution (HAP) from the use of solid fuels for cooking and heating, contributed to 2.31 million deaths in the same year, with the majority of these deaths occurring in sub-Saharan Africa and Asia (HEI, 2020).
At the national scale, residential solid fuel use in South Africa is low compared to other countries in the region. However, it remains prominent in many low-income urban and peri-urban settlements around the coalfields on the South African Highveld (StatsSA, 2019). It is estimated that household and ambient air pollution exposure contributed to 4 590 and 24 800 premature deaths of South Africans in 2019, respectively (HEI, 2020).
The main drivers of household emissions globally and nationally are poverty and limited access to resources such as good quality housing and clean energy sources (Buthelezi et al., 2019; HEI, 2020). Previous studies have shown that, of all the environments in South Africa, ambient concentrations of particulate matter are highest in solid fuel using areas (Hersey et al., 2015). Residential solid fuel burning, in low-income settlements, has been estimated to contribute to over 60% of the particulate pollution (Engelbrecht et al., 2002). Coalfields, industrial activities and coal-powered electricity generation are also concentrated in the Highveld region. These activities contribute to poor air quality which often exceeds National Ambient Air Quality Standards (NAAQS) aimed at protecting public health (DOE, 2012). As an economic hub, large parts of the region are densely populated, and air quality management remains a challenge due to the high concentration of industrial and residential sources in the region (Matandirotya et al., 2019). Air quality is expected to decline even more as urban areas on the Highveld become more populated.
In South Africa, 85% of households have access to electricity. However, due to financial constraints, many households are still unable to afford electricity as their only source of energy, using the fuel stacking approach for more energy-intensive practices such as cooking and heating (Langerman and Pauw, 2018; Israel-Akinbo, Snowball and Fraser, 2018). Solid fuels remain a cost-effective alternative energy source, especially during colder winter months. Solid fuels are not only more cost-effective but also more convenient, as the same appliance is used for cooking and space heating simultaneously (Balmer, 2007).
The low socio-economic status of residents in solid fuel burning communities also increases vulnerability to the adverse health impacts of air pollution. Living in areas with high air pollution levels has been linked with increased risk of respiratory, cardio- and cerebrovascular morbidity and mortality, all-cause mortality, as well as acute effects like asthma exacerbation, skin and eye irritation (Pope and Dockery, 2006; Brook et al., 2010; Lelieveld, 2020).
The burden of disease is also not distributed evenly in these communities, women, children, and the elderly are the most affected (HEI, 2020). Several studies conducted in solid fuel burning communities have measured significant differences in indoor and ambient PM concentrations in and around solid fuel burning and non-solid fuel burning households in the same communities (Adesina et al., 2019; Language et al., 2016). Better air quality management on the Highveld is important in order to rectify the disproportionate distribution of the burden of air pollution and address environmental injustice at both the regional and community scales.
Understanding PM25 sources, ambient concentrations, their trends and spatio-temporal variability inside urban settlements are essential for designing strategies aimed at assessing and managing environmental and health impacts related to poor ambient air quality on the Highveld. An understanding of the socio-economic drivers of solid fuel use is also essential in order to identify at-risk areas and design community-specific interventions. Location-specific variables such as the amount of informal housing, number of households using "dirty" fuels and population density of an area have been shown to have positive correlations to particulate matter concentrations in an area (Lindeque et al., 2018).
Monitoring stations were installed within some of the low-income settlements on the South African Highveld to measure the state of air quality (Gwaze and Mashele 2018). Due to the high costs associated with purchasing and operating these stations, community airsheds are frequently monitored by only one such station (DEAT, 2006). However, studies have shown that residential ambient air concentrations are highly variable in time and space (Petit et al., 2015; Krasnov et al., 2016; Wernecke, 2018; Kumar et al., 2018). This study aims to evaluate how ambient PM25 varies in space and time inside a solid fuel burning community, in order to better understand the intraurban variability of air quality in a low-income settlement. It further explores the socio-economic drivers known to influence particulate matter concentrations in low-income settlements, as a means to describe the observed spatio-temporal variability of concentrations. The results could inform the design of future monitoring strategies, mitigation attempts and management approaches in low-income settlements in order to address exposure inequities on the Highveld.
Data and methodology
Study area
KwaZamokuhle is a low-income residential area that is situated in the Mpumalanga Highveld Priority Area (DEAT, 2007) (Figure 1). It is situated in the Nkangala local municipality and has over 20 000 permanent residents (StatsSA, 2012b). The settlement is located near three Eskom coal operated power stations: Hendrina, Arnot, and Komati. Chidhindi et al. (2019) modelled the impacts of these coal-fired power plants and found that they contributed little to ambient PM2.5 in comparison to the local sources in KwaZamokuhle. However, their model did not include secondary particulate matter formed due to industrial emissions.

The average household size in the settlement is 3.5 people per household with a mean annual household income of 1 965 (ZAR), and an unemployment rate of 45% (StatsSA, 2012b). Typically, electricity is used for lighting (89.2% of households) whereas, for cooking and space heating, coal and wood are the more commonly used energy sources (34% and 31.2% of households respectively) (StatsSA, 2012b).
Sampling strategy
The study was conducted during a sampling campaign of four months, from 1 March to 30 June 2018. Ambient PM2.5 concentrations measurements were recorded at four sites in KwaZamokuhle.
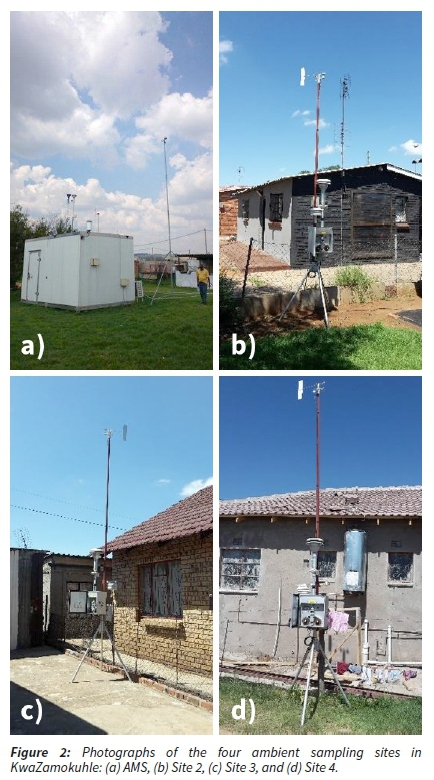
The first site being a long-term ambient air quality monitoring station (AMS), situated in the eastern part of the community at 26°8'17.64"S and 29°44'20.41"E. The AMS (Figure 2a) is directly surrounded by grass and unvegetated soil. There are buildings 13m to the north, 12m west-south-west, and 10m south-east of the AMS. There is an unpaved road 8m north-east, running parallel to the AMS. The second site (Site 2) was situated ~1.07 km north-west of the AMS at 26°8'0.74"S and 29°43'46.48"E (Figure 2b). Site 2 was surrounded by grass and unvegetated soil, with a paved road 8m to the east of the instrument. There was an open field to the south-east (across the paved road), besides that, households surround the site. The third site (Site 3) (26°8'12.16"S, 29°43'38.67"E) was located ~1.18km west and ~0.41km south-west of the AMS and Site 1 respectively. The site was placed on a concrete surface (driveway) between two houses with a paved road ~14m west-north-west of the site (Figure 2c). The last site (Site 4) was positioned at 26°8'36.39"S, 29°44'3.92"E which was ~0.74km south-west, ~1.0km south-south-east, and ~1.02km south-east of the AMS, Site 2, and Site 3 respectively (Figure 2d).
Sites 2, 3, and 4 were selected based on several factors which included i) the relative distance from each other and the AMS; ii) the availability of electricity, iii) security, and iii) general coverage of different areas of the community. The factor mentioned last was important to determine the differences in the ambient PM25 concentrations across distinct sections of the community.
Instrumentation
The instruments used for data collection operated by beta-attenuation technology. A Thermo Scientific FH62 C-14 particulate monitor continuously measured ambient PM25 at the AMS. A temporary network of E-BAM particulate monitors from MetOne Instruments was deployed at Site2, 3, and 4. Detailed information and discussion on the specifications and theory of operation for both the FH62 C-14 (Thermo Scientific, 2010) and E-BAM (MetOne Instruments, 2008; Schweizer et al., 2016) can be found in the literature. Beta-attenuation instruments are often used to measure and explore the spatial and temporal variability of ambient particulate matter (Schweizer et al., 2016; Kumar et al., 2018).
A notable difference was the measurement heights for PM25 at the static and temporary sampling sites. At the AMS, PM2.5 was measured at ~3m while at Sites 2, 3, and 4 was ~1.6m. The data were recorded at a resolution of one minute for the duration of the sampling campaign.
Data quality control and quality assurance
The sites were visited biweekly for general maintenance and data collection activities.
The data gaps displayed in Figure 3 reflect the technical problems encountered during the sampling campaign. These included power cuts, systematic failures due to PM2.5 overload, and changing of filter tape. Data were flagged based on the limit of detection, ranges, the sensitivity of the individual instruments and general errors identified during sampling. The flagged data were excluded and not considered for further analysis.

Only days with at least 90% of valid data points for all sites were included in the analysis. The combined data recovery for March, April, May and June were 48%, 47%, 32% and 27%, respectively. There was a total of 47 valid days (39%) from the 122 days sampled. The valid data were averaged into hourly and daily concentrations.
Data analysis
The distribution of the data was investigated through descriptive statistics as well as box-plots. The spatial and temporal variations were examined by using both the hourly- and daily averaged PM25 concentration.
Identification of possible socio-economic drivers of the observed variability
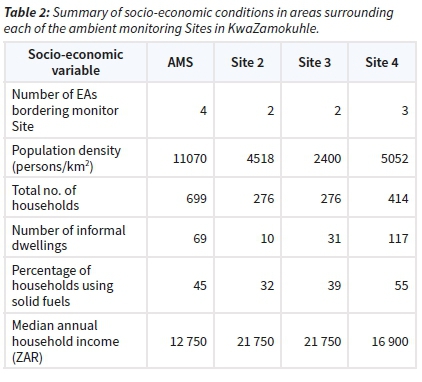
Data from the 2011 Census spatial dataset was used for this part of the analysis. Enumeration Areas (EAs) (also called small area levels) were chosen for the scale of analysis as they are the smallest geographical areas, where detailed housing and household-related statistics are recorded during a census. The underlying philosophy of this approach is very similar to that of Wright and Diab (2011), who also used census data to better represent the socio-economic factors that play such an important role not only as drivers of poor air quality but also in exposure and vulnerability to the adverse health impacts of HAP. Relevant data for every EA bordering each of the monitoring sites were extracted and aggregated in order to understand better the socio-economic conditions that are known to drive solid fuel use around each monitoring station. The following variables were included for each EA: 1) the number of households; 2) the percentage of informal dwellings; 3) population density; 4) median annual household income; and 5) the percentage of households using solid fuels for cooking and heating. After aggregation for each monitoring site, data were compared to the observed measurements to explore whether the socio-economic conditions in areas surrounding each monitoring station could have influenced observed spatio-temporal variability.
Results and discussion
The results related to the spatial and temporal variability of ambient PM25 concentrations in KwaZamokuhle are represented and discussed below.
Variability of ambient PM25
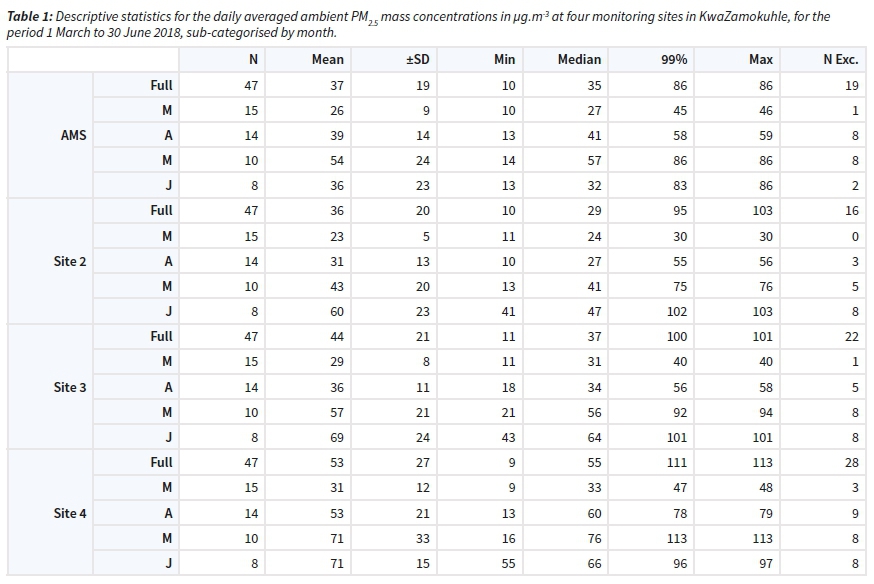
The spatial distribution of the daily mean ambient PM2.5 levels across distinct sections of KwaZamokuhle is shown in Figure 4. The daily PM2.5 concentrations at AMS, Site 2, Site 3, and Site 4 ranged from 10 to 86 μg.m-3, 10 to 103 μg.m-3, 11 to 101 μg.m-3, and 9 to 113 μg.m-3, respectively.

Across KwaZamokuhle, the lowest daily mean PM25 concentration was recorded at Site 2 (36 ±20 μg.m-3), situated farthest north, while the highest mean was measured at Site 4 (53 ± 27 μg.m" 3) located farthest south. The AMS site experienced similar PM25 loadings (37 ± 19 μg.m-3) as Site 2. The PM25 mass concentrations at Site 3 (44 ± 21 μg.m-3) were midway between that of Site 4 and Site 2. This indicates that the ambient PM25 loadings tend to increase from north to south over the community. The 99% of the daily averaged measurements for the AMS, Site 2, Site 3, and Site 4 were 86 μg.m-3, 95 μg.m-3, 100 μg.m-3, and 111 μg.m-3, respectively.
Larger variability in the daily averaged PM25 loadings were observed for Site 4, and to a lesser degree at Site 3. The AMS and Site 2 showed the lowest variability in the daily mean values. The daily averaged mean PM25 loadings at the AMS, Site 2, Site 3, and Site 4 exceed the 24-h PM25 NAAQS of 40 μg.m-3 for 19 (40%), 16 (34%), 22 (46%), and 28 (60%) of the 47 days (Table 1).
Considerable spatial variability of the monthly daily mean PM25 concentrations was recorded across KwaZamokuhle (Figure 4). Throughout all the sampled months, the daily average PM25 concentrations measured at AMS, Site 2, Site 3, and Site 4 ranged from 26 to 36 μg.m-3, 23 to 60 μg.m-3, 29 to 69 μg.m-3, and 31 to 71 μg.m-3, respectively. Extreme PM25 concentrations were seen during the cold period (May and June); meanwhile, the warm period (March and April) represented relatively lower PM25 episodes across different sections of KwaZamokuhle. These results agree with previous observations that were made in KwaZamokuhle (Langerman et al., 2018; Yahia and Langerman 2018; Wernecke 2018; Adesina et al., 2019).
The studies mentioned above attributed substantial winter increments of PM25 concentrations to domestic fuel combustion. As mentioned earlier, there is considerable residential reliance on coal and wood for space heating and cooking in KwaZamokuhle (StatsSA, 2012b). A significant portion of these fuels is burned during the winter period to keep households warm from cold ambient temperatures (Langerman et al., 2015; Yahia and Langerman, 2018). Poor air quality over the Highveld is further exacerbated by prevailing wintertime anticyclonic circulation that leads to the formation of inversion layers causing poor vertical dispersion of pollutants (Langerman et al., 2018).
During March, the highest daily mean PM25 concentration of 31 μg.m-3 was observed in Site 4. This was 1.4 and 1.2 times greater than the daily average PM2.5 concentration measured at Site 2 and AMS, respectively. However, Site 3 and Site 4 showed less variation. At AMS, Site 2, Site 3, and Site 4, 99% of the daily particulate concentrations were 45 μg.m-3, 30 μg.m-3, 40 μg.m-3, and 48 μg.m-3, respectively (Figure 4). The maximum daily readings at Site 2 were below the 24-h PM25 NAAQS of 40 μg.m-3, while those at AMS, Site 3, and Site 4 were beyond. However, the number of exceedances measured at AMS (1), Site 3 (1), and Site 4 (3) were below the allowed annual exceedances of 4 (Table 1). Therefore, more than 80% of the 15 days, which were sampled across KwaZamokuhle during March had cleaner air quality.
The daily concentrations measured in April ranged from 13 to 59 μg.m-3, 10 to 56 μg.m-3, 18 to 58 μg.m-3, and 13 to 79 μg.m-3, at AMS, Site 2, Site 3, and Site 4, respectively. Across all sites, Site 4 (53 ± 21 μg.m-3) recorded the highest daily averaged PM25 concentration. This was 35%, 70%, and 47% higher than the mean daily concentrations measured at AMS, Site 2, and Site 3, respectively. It is noticeable that 99% of the daily average concentrations measured in different sections of KwaZamokuhle were higher than the 24-h PM25 NAAQS of 40 μg.m-3. However, the frequency of these exceedances was different for most of the sites. This is indicative of a heterogeneous spatial distribution of local emission sources within KwaZamokuhle.
The highest monthly daily mean PM2.5 concentrations were recorded in June at all sites, except for AMS. At AMS, Site 2, Site 3, and Site 4, 99% of the daily PM2.5 concentrations were 36 μg.m-3, 60 μg.m-3, 69 μg.m-3, and 71 μg.m-3, respectively. These PM2.5 concentrations exceeded the 24-h PM2.5 NAAQS at all sites except the AMS. The observed exceedances at Site 2, Site 3, and Site 4 are attributable to the direct exposure to emissions from dirty solid fuel combustion. Meanwhile, the compliance at AMS is likely due to less exposure to emissions from domestic fuel combustion. Therefore, these results suggest that the compliance status of a single point monitoring station in a particular microenvironment does not confirm that air quality is similar across the entire township.
Diurnal distribution
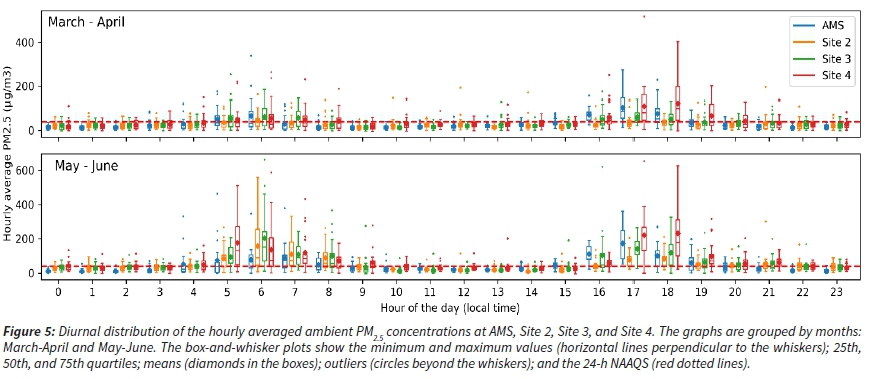
Figure 5 depicts the diurnal distribution of the hourly averaged ambient PM2.5 mass concentrations for AMS, Site 2, Site 3 and Site 4 in KwaZamokuhle. The data were grouped into two periods, namely, March-April and May-June. The first period mentioned is typical of a transitional period between summer and winter conditions, whereas the latter moves toward typical winter conditions.
All four sites showed the typical diurnal pattern, which includes bimodal morning and evening peaks, typical of low-income communities in South Africa. These periods usually occur within the periods of increased community- and household activities. The 24-h PM25 NAAQS limits are typically exceeded during these peak concentration periods. The higher the extreme concentrations on any given day, the more likely it is that the daily averages will exceed the NAAQS limit value of 40 μg.m-3.
Morning peak PM25 concentrations are observed from 05h00 to 07h00 lasting 3 hours from March-April while from May-June peak concentrations are observed from 05h00 to 08h00 lasting for 4 hours. During May-June, the highest mean concentrations were observed at Site 4 followed by Site 3, and Site 2. The AMS had the lowest ambient PM25 levels. A possible explanation could be that the AMS is situated on church/community grounds, whereas the other three sites were all located between residences.
Evening PM25 concentrations typically peaked between 16h00-20h00 in March-April and 16h00-21h00 for May-June. Upon closer investigation, it is clear that there are specific activities/sources which contribute to increased particulate loadings at individual sites. For example, in March-April, Site 3 experienced the highest peak concentrations during the morning, followed by Site 4, AMS, and Site 2. At all four sites, the morning peak gradually increases and then decreases. However, this is somewhat different during the evening. The PM25 concentrations at the AMS rapidly increase at 16h00, significantly higher than other sites, and then stabilise again by 19h00. Thus, the AMS morning and evening peaks are similar. Site 4 had the highest particulate loadings starting at 17h00, approximately two times higher than the remaining sites. This indicates that there is a definite/specific source contributing to increased concentrations at Site 4. This is likely due to the duration of domestic fuel burning events and the frequency of emissions produced, which are different for each section in the community, therefore, suggesting that air quality in KwaZamokuhle is not polluted by industrial emissions (Collett et al., 2010). Site 3 had the third-highest concentrations during the evening with Site 2 experiencing the lowest particulate loadings. These trends were also observed for May-June. Note, the mean evening concentrations during May-June were a factor of one to two higher than during March-April.
The microenvironments of this township showed significantly different concentration distributions; thus, indicating that PM25 sources are local by origin. A further ANOVA analysis of hourly data for the full monitoring period (1 March 2018 - 30 June 2018) rejected the null hypothesis that the means of the four sites are from the same population (p-value 1.2e-14).
Socio-economic drivers of observed PM25 variability
Data from Census 2011 was extracted at the EA level for each EA bordering every monitoring Site. Data were aggregated, and a summary of the socio-economic conditions that could influence HAP emissions is given in Table 2.
Observed PM25 concentrations show the daily and seasonal peaks typically in solid-fuel burning communities on the Highveld (Language et al., 2016; Nkosi et al., 2018; Wernecke, 2018).
The highest daily and seasonal mean PM25 concentrations were measured at Site 4. The areas surrounding Site 4 have the highest percentage of households using solid fuels for cooking and heating (Figure 6a). These areas also have the highest number of informal dwellings (117), where cold indoor temperatures often cause residents to burn solid fuels for space heating (Figure 6b).

These findings concur with the findings of Lindeque et al. (2018), which found the number of informal dwellings in an area to be the most significant socio-economic predictor of high household emissions, followed by the percentage of households using solid fuels as the second predictor, and population density as the third.
One of the three EAs included for the analysis of areas surrounding Site 4 (SAL code 8690100), had the highest number of informal dwellings (60% of all households) and the lowest median annual household income (ZAR 7200) of all EAs in KwaZamokuhle (Figure 6c). Ninety-three percent of households in this EA use solid fuels for cooking and heating, and this could be a contributing factor to the high concentrations (min, max and mean) measured at Site 4 for all seasons. This finding also reiterates the importance of using spatially refined data when assessing the drivers of HAP in low-income communities, as averaging at even this small scale could conceal areas of concern for air quality management. It furthermore supports the evidence that poverty and poor quality housing contribute significantly to poor air quality over the South African Highveld.
Population density does not seem to have a significant influence on concentrations in areas around the monitoring sites, as the lowest concentrations were observed at AMS, the section of the township with the highest surrounding population density. Site 3, where high concentrations were observed, has the lowest surrounding population density of all Sites (Figure 6d).
It is important to note that this part of the analysis is purely descriptive, and does not imply a direct correlation between the discussed socio-economic factors and ambient particulate matter concentrations. The last complete census was conducted in 2011, and significant demographic changes could have occurred between then and the time of sampling in 2018.
Conclusions
Ambient PM25 concentrations were monitored in four different sections of KwaZamokuhle to evaluate how they vary in space and time. This was done using a permanent ambient monitoring station and a network of three temporary monitoring stations in various sections of the township. Moreover, a characterisation of ambient PM2.5 was done and showed poor quality with varying frequencies across the entire settlement.
The diurnal variability suggested that the duration of domestic combustion of solid fuel events is different across KwaZamokuhle and has a significant effect on ambient PM25. The daily ambient PM25 concentrations at AMS, Site 2, Site 3, and Site 4 were found to be significantly different.
A descriptive analysis of the socio-economic conditions in the areas surrounding each monitoring site was conducted. This part of the study highlighted the importance of using spatially refined data when assessing the drivers of HAP in low-income communities and supported the evidence that poverty is a driver of poor air quality in low-income settlements on the Highveld.
The results of this study highlight the complexity of quantifying ambient air quality in an area where there are several local pollution sources. Therefore, care should be taken when data from one site is used to assess air quality, human exposure, or the potential impacts of mitigation strategies in dense, low-income settlements.
Acknowledgements
Warm acknowledgements are directed to the National Research Foundation for funding this study as well as Eskom for the data provided.
References
Adesina J.A., Piketh S.J., Qhekwana M., Burger R., Language B. and Mkhatshwa G. 2019, 'Contrasting indoor and ambient particulate matter concentrations and thermal comfort in coal and non-coal burning households at South Africa Highveld.' Science of the Total Environment.134403. https://doi.org/10.1016/j.scitotenv.2019.134403 [ Links ]
Balmer, M. 2007. Household coal use in an urban township in South Africa. Journal of Energy in Southern Africa, 18(3):27-32. https://doi.org/10.17159/2413-3051/2007/v18i3a3382 [ Links ]
Brook, R.D., Rajagopalan, S., Pope, C.A., Brook, J.R., Bhatnagar, A., Diez-Roux, A.V., Holguin, F., Hong, Y., Luepker, R.V., Mittleman, M.A., Peters, A., Siscovick, D., Smith, S.C., Whitsel, L., Kaufman, J.D. 2010. Particulate matter air pollution and cardiovascular disease: an update to the scientific statement from the American Heart Association. Circulation, 121(21):2331-2378. Research and Public Health, 16(4):550. https://doi.org/10.1161/CIR.0b013e3181dbece1 [ Links ]
Buthelezi S.A., Kapwata T., Wernecke B., Webster C., Mathee A. and Wright C.Y. 2019, 'Household fuel use for heating and cooking and respiratory health in a low-income, South African coastal community.' International Journal of Environmental Research and Public Health, 16(4):550. https://doi.org/10.3390/ijerph16040550 [ Links ]
Chidhindi P., Belelie M.D., Burger R.P., Piketh S.J. and Mkhatshwa G. 2019, 'Assessing the impact of Eskom power plant emissions on ambient air quality over KwaZamokuhle.' Clean Air Journal, 29(1):29-37. https://doi.org/10.17159/2410-972X/2019/v29n1a2 [ Links ]
Collett K.S., Piketh S.J. and Ross K.E. 2010, 'An assessment of the atmospheric nitrogen budget on the South African Highveld.' South African Journal of Science, 106(5-6):35-43. https://doi.org/10.4102/sajs.v106i5/6.220 [ Links ]
DOE. 2012. 'A survey of energy-related behaviour and perceptions in South Africa'. Pretoria: Department of Energy. [ Links ]
Engelbrecht, J.P., Swanepoel, L., Chow, J.C., Watson, J.G. & Egami, R.T. 2002. The comparison of source contributions from residential coal and low-smoke fuels, using CMB modelling, in South Africa. Environmental Science & Policy, 5(2002):157-167. https://doi.org/10.1016/S1462-9011(02)00029-1 [ Links ]
Gwaze P. and Mashele S.H. 2018, 'South African Air Quality Information System (SAAQS) mobile application tool: bringing real time state of air quality to South Africa.' Clean Air Journal, 28(1):1-4. https://doi.org/10.17159/2410-972X/2018/v28n1a1 [ Links ]
Health Effects Institute. 2020. State of Global Air 2020. Special Report. Boston: MA: Health Effects Institute. [ Links ]
Hersey S., Garland R.M., Crosbie E., Shingler T., Piketh S. and Burger R. 2015, 'An overview of regional and local characteristics of aerosols in South Africa using satellite, ground, and modeling data.' Atmospheric Chemistry and Physics, 15:4259. https://doi.org/10.5194/acp-15-4259-2015 [ Links ]
Israel-Akinbo, S. O., Snowball, J. and Fraser, G. 2018. 'The energy transition patterns of low-income households in South Africa: An evaluation of energy programme and policy', Journal of Energy in Southern Africa, 29(3):75-85. https://doi.org/10.17159/2413-3051/2018/v29i3a3310 [ Links ]
Krasnov H., Kloog I., Friger M. and Katra I. 2016, 'The spatio-temporal distribution of particulate matter during natural dust episodes at an urban scale.' PlOS ONE, 11(8). https://doi.org/10.1371/journal.pone.0160800 [ Links ]
Kumar M.K., Sreekanth V., Salmon M., Tonne C. and Marshall J.D. 2018, 'Use of spatiotemporal characteristics of ambient PM25 in rural South India to infer local versus regional contributions.' Environmental Pollution, 239:803-811. https://doi.org/10.1016/j.envpol.2018.04.057 [ Links ]
Langerman K., Wernecke B., Mkhatshwa G., Herbst D., Piketh S., Burger R., Pauw C., Snyman H., Murray H., Fischer T. and Weston M. 2015, 'Domestic fuel burning emission reduction: Eskom's KwaZamokuhle pilot study.' In: NACA Conference. Bloemfontein, South Africa, October 2015. [ Links ]
Langerman K.E. and Pauw C.J. 2018, 'A critical review of health risk assessments of exposure to emissions from coal-fired power stations in South Africa.' Clean Air Journal, 28(2):68-79. https://doi.org/10.17159/2410-972x/2018/v28n2a19 [ Links ]
Langerman K.E., Pauw C.J., Smith H.J. and Piketh S.J. 2018, 'Moving households to cleaner energy through air quality offsets.' In: 2018 International Conference on the Domestic Use of Energy (DUE). https://doi.org/10.23919/DUE.2018.8384405 [ Links ]
Language B., Piketh S.J., Wernecke B. and Burger R. 2016, 'Household air pollution in South African low-income settlements: a case study.' WIT Transactions on Ecology and the Environment, 207:227-236. https://doi.org/10.2495/AIR160211 [ Links ]
Lindeque, L.F., Van Schalkwyk, E.V., Burger, R.P., and Piketh, S.J. 2018. Land Use Regression as a Tool to Quantify PM2.5 Concentrations and Identify Suitable Offset Sites on the Highveld. Paper in: National Association for Clean Air. Vanderbijlpark, South Africa, 30 October - 1 November 2018. ISBN: 978-0-62081025-8 [ Links ]
Matandirotya N.R., Cilliers D.P., Burger R.P., Pauw C. and Piketh S.J. 2019, 'The potential for domestic thermal insulation retrofits on the South African Highveld.' Clean Air Journal, 29(1):21-28. https://doi.org/10.17159/2410-972X/2019/v29n1a1 [ Links ]
Met One Instruments, Inc. 2008, 'E-bam particulate matter monitor operation manual E-bam 9800 Rev L. [ Links ]'
Murray, C. J. et al. 2020. 'Global burden of 87 risk factors in 204 countries and territories, 1990-2019: a systematic analysis for the Global Burden of Disease Study 2019', The Lancet, 396(10258):1223-1247. [ Links ]
Nkosi N.C., Piketh S.J. and Burger R.P. 2018. 'Fine PM emission factors from residential burning of the solid fuels using traditional cast-iron coal stoves.' Clean Air Journal, 28(1):35-41. https://doi.org/10.17159/2410-972X/2018/v28n1a10 [ Links ]
Petit J.E., Amodeo T., Meleux F., Bessagnet, Menut L., Grenier D., Pellan Y., Ockler A., Rocq B., Gros V., Sciare J. and Favez O. 2015, 'Characterising an intense PM pollution episode in March 2015 in France from multi-Site approach and near realtime data.' Climatology, variabilities, geographical origins and model evaluation, 155:68-84. https://doi.org/10.1016/j.atmosenv.2017.02.012 [ Links ]
Pope, C.A. and Dockery, D.W. 2006. Health effects of fine particulate air pollution: lines that connect. Journal of the Air and Waste Management Association, 56(2006):709-742. https://doi.org/10.1080/10473289.2006.10464485 [ Links ]
Schweizer D., Cineros R., and Shwan G. 2015, 'A comparative analysis of temporary and permanent beta attenuation monitors: The importance of understanding data and equipment limitations.' Atmospheric Pollution Research, 7:865-875. https://doi.org/10.1016/j.apr.2016.02.003 [ Links ]
South Africa. Department of Environmental Affairs and Tourism. 2007, 'Declaration of the Highveld as priority area in terms of section 18(1) of the national environmental management: Air quality Act, 2004 (ACT NO. 39 OF 2004).' Government Gazette, No.30518:3-4. [ Links ]
South Africa. Department of Environmental Affairs and Tourism. 2006, 'Environmental quality and protection.' Pretoria. [ Links ]
Statistics South Africa (StatsSA). 2012b, 'Census 2011. Statistical Release.' Pretoria: Statistics South Africa. [ Links ]
Thermo Scientific. 2010. Instruction Manual: Continuous Ambient Particulate Monitor Part Number 100230-00. [ Links ]
Wernecke B. 2018, 'Ambient and indoor particulate matter concentrations on the Mpumalanga Highveld.' Potchefstroom: North-West University. (Dissertation- MSc). [ Links ]
Wright, C. Y. and Diab, R. 2011. 'Air pollution and vulnerability: solving the puzzle of prioritisation.', Journal of Environmental Health, 73(6):56-64. [ Links ]
Yahia Z. and Langerman K. 2018, 'Assessing the implication of South Africa's integrated national electricity supply connections.' In: 2018 Proceedings of the International Conference on the Industrial Engineering and Operations Management. [ Links ]
Received: 16 January 2021
Reviewed: 27 February 2021
Accepted: 18 March 2021

