


Services on Demand
Article
 English (pdf)
 Article in xml format
 Article references
Indicators

Related links
-
 Cited by Google
 -
 Similars in Google
Share

 Permalink
Clean Air Journal
On-line version ISSN 2410-972X
Print version ISSN 1017-1703
Clean Air J. vol.30 n.2 Pretoria 2020
http://dx.doi.org/10.17159/caj/2020/30/2.8833
RESEARCH ARTICLE
The impacts of commissioning coal-fired power stations on air quality in South Africa: insights from ambient monitoring stations
Itumeleng P. Morosele; Kristy E. Langerman*
Department of Geography, Environmental Management and Energy Studies, University of Johannesburg, Auckland Park, Johannesburg, South Africa
ABSTRACT
The South African electricity sector is known for its heavy reliance on coal. The aim of this study is to assess the impacts of increasing SO2 and PM emissions from the three return-to-service power stations (Komati, Camden and Grootvlei), and the newly constructed Medupi power station on ambient air quality measured in the vicinities of these power stations. Trends in ambient pollution concentrations were determined using Theil-Sen analysis. The correlation between the emissions and ambient pollution concentrations at nearby monitoring stations was determined with the Spearman partial rank correlation coefficient. Lastly, compliance of ambient pollution concentrations with the South Africa National Ambient Air Quality Standards was assessed. Few statistically significant trends in ambient SO2 and PM10 concentrations are found, and there is little correlation between increasing power station emissions and ambient pollutant concentrations in the vicinity. It is only at Camden monitoring station where there are increases in PM10 concentrations from the direction of Camden power station, and at Grootvlei monitoring station where increasing SO2 concentrations are from the directions of Grootvlei and Lethabo power stations. A strong, positive correlation between power station emissions and ambient concentrations exists only for SO2 at Grootvlei monitoring station and PM10 at Medupi monitoring station (although it is likely that the correlation at Medupi is related to construction and vehicle activity, and not emissions from Medupi power station stacks). It is concluded that the establishment of monitoring stations in the vicinities of power stations is necessary but not sufficient to monitor their impact on air quality in the surrounds.
Keywords: Coal-fired power stations, ambient air quality, SO2, PM, trends, correlation, compliance, Theil-Sen analysis
Introduction
Coal is the major source of electricity in South Africa, generating 85.7% of the country's power in 2016 (StatsSA, 2018). Eskom Holdings SOC Ltd (hereafter referred to as Eskom) generates more than 90% of South Africa's electricity and approximately 40% of Africa's electricity (Eskom, 2019). Coal-fired power station emissions have been flagged for their impact on ambient air quality and associated health issues (Xue et al., 2005; Keen and Altieri, 2016a; Keen and Altieri, 2016b; Holland, 2017; Mannucci and Franchini, 2017; Wright et al., 2017; Langerman and Pauw, 2018; Gray, 2019).
There is a global trend of decreasing emissions from coal-fired power stations, as power stations are decommissioned, converted to natural gas, or fitted with emission abatement technologies (Gouw et al., 2014; Wang et al., 2020; IEA, 2020). Reducing emissions from such large point sources is expected to result in improvements in ambient air quality. Indeed, such improvements have been observed in many regions including south-eastern Australia (Crawford et al., 2018), north-eastern United States (Russell et al., 2017) and China (Ma et al., 2019). In the developing world, new power stations are still being commissioned. New coal-fired power stations are planned and/ or under construction in Turkey (Akyuz and Kaynak, 2019) and India, for example. In South Africa, three previously mothballed power stations - Camden, Grootvlei and Komati - were returned to service between 2005 and 2013, and two large new power stations, Medupi and Kusile, are currently being commissioned (since 2015 for Medupi and 2016 for Kusile).
The threat posed by coal-fired power station emissions to ambient air quality in South Africa is only in small part due to the direct emissions of particulate matter (ash), since more than 99% of it is removed from the flue gas stream before release to the atmosphere. The concern is rather the large quantities of sulphur dioxide (SO2), which is of concern when inhaled at high concentrations in the close vicinity of power stations. SO2 oxidises to form secondary sulphate aerosols which elevate fine particulate matter (PM25) levels across the region and cause acid deposition. PM25 negatively affects human health by increasing the risk of cardiovascular and cerebrovascular disease, cancer, diabetes and several other illnesses (Xue et al., 2005; Keen and Altieri, 2016a; Keen and Altieri, 2016b; Mannucci and Franchini, 2017; Wright et al., 2017), and altering local climate (by reflecting shortwave radiation) (Coakley et al., 1983; Kaufman et al., 2002).
Surface ambient air quality monitoring stations are commonly used to observe the impact of the commissioning and decommissioning of large point sources on ambient pollution levels (as was done by Russell et al., 2017 and Crawford et al., 2018). However, Akyuz and Kaynak (2019) contend that ambient monitoring stations are not sufficient to detect the impact on ambient air quality because the concentrations measured at the monitoring stations are highly dependent on the siting of the monitoring station. In South Africa, the establishment of at least one ambient monitoring station is usually a condition of the environmental authorization granted for the construction of a power station (or other polluting facility).
The aim of this study is to assess the impact of changing emission levels from three return-to-service power stations, Komati, Camden and Grootvlei, and the newly constructed Medupi power station on ambient air quality in the vicinities of these power stations, using measurements from ambient monitoring stations. Two criteria pollutants, SO2 and PM10, are selected for analysis. Three research objectives were formulated: to identify and quantify trends in power station emissions and ambient air pollution concentrations; to determine whether there is a statistically significant correlation between power station emissions and ambient air pollution concentrations; and to assess compliance of ambient SO2 and PM10 concentrations with the National Ambient Air Quality Standards. We also evaluate the value of surface monitoring stations in detecting the effect of emissions from large point sources on ambient air quality levels.
To the authors' knowledge, this is the first research paper to investigate how the commissioning of the new Medupi power station has affected ambient air quality. It is also the only study seeking to establish a direct correlation between emissions from power stations and the ambient air quality in the immediate vicinities of these power stations. The study sheds light on the trends of pollutants identified in the Highveld and Waterberg-Bojanala Priority Areas. The findings should influence legislation and policies that have been created to regulate ambient air quality, especially in the event of non-compliance.
Methods
Study Sites
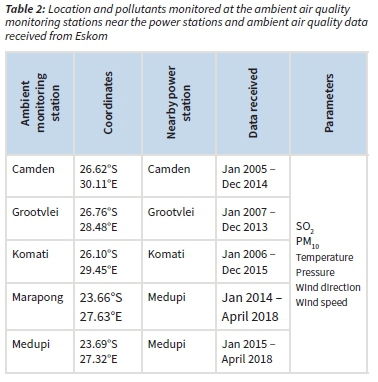
Komati, Camden and Grootvlei power stations are located in Mpumalanga, in the Highveld Priority Area (HPA), and Medupi power station in Limpopo, in the Waterberg-Bojanala Priority Area (WBPA) (Figure 1). The three return-to-service power stations (Camden, Grootvlei and Komati) were recommissioned between 2005 and 2013, while commissioning of Medupi power station commenced in 2015 (Table 1).


Komati monitoring station is located 2 km southwest of Komati power station, Camden monitoring station is 1.6 km east-southeast of Camden power station, Grootvlei monitoring station is 1.7 km northwest of Grootvlei power station in Grootvlei town. Marapong monitoring station is 8 km northeast of Medupi and 2 km northeast of Matimba power station, and Medupi monitoring station is 4.8 km south-southwest of Medupi power station (Figure 1 and Table 2).
Data and analysis
Monthly emissions of SO2 and PM (ash) (tons) from the four power stations were obtained from Eskom for the years indicated in Table 1. The SO2 emissions are calculated using mass balance, based on the amount of coal burnt and the sulphur content of the coal, which is sampled twice a day. The PM emissions are continuously monitored with opacity monitors that are correlated with isokinetic samples every two years.
10-minute and hourly ambient SO2 and PM10 concentration data, from the five monitoring stations were provided by Eskom for the dates indicated in Table 2. Temperature, pressure, wind direction and wind speed data were also provided. SO2 and PM10 concentrations were converted from 10-minute or hourly values into monthly averages to reflect the same time interval as the emissions data. All zero and error values were deleted. Monthly concentrations with data availability below 50% were excluded from the analyses as they do not adequately represent the months.
To identify trends in power station emissions, a linear trend line was fitted to the monthly power station emissions using the method of least squares. For the ambient air pollution concentrations, Theil-Sen analysis was performed using the Openair package in R. The option to de-seasonalize the data was selected because some of the datasets are fairly short and include partial years. The trends were also calculated for each of the eight cardinal wind directions. The analysis produces an overall trend, the 95 % confidence intervals in the slope, and the statistical significance of each trend estimate (p-value). A p-value of less than 0.001 indicates a highly statistically significant trend, while a p-value of less than 0.05 indicates a statistically significant trend. When p > 0.1, there is no statistically significant trend. The following symbols are used to indicate the statistical significance on the plots: *** denotes p < 0.001, ** denotes p < 0.01, * denotes p < 0.05 and + denotes p < 0.1 (Carslaw and Ropkins, 2012; Carslaw, 2015).
The Spearman partial rank correlation (SPRC) test was adopted to determine the relationship between trends in monthly SO2 and PM (ash) emissions and trends in ambient SO2 and PM10 concentrations, since the emissions and ambient data is not normally distributed. IBM SPSS Statistics Version 25 ('SPSS') package was employed to perform the correlation analysis.
Compliance with the 1-hour SO2 and 24-hour PM10 National Ambient Air Quality Standards was determined by calculating the 99th percentile of the hourly SO2 concentrations and 24hour PM10 concentrations for all years and comparing the 99th percentile values with the limit values. Compliance with the annual National Ambient Air Quality Standards was also determined for SO2 and PM10.
Results
Trend Analysis
Power station emissions
There is an increasing trend in unabated power station SO2 emissions as power station units are commissioned (in 20052008 for Camden, 2008-2011 for Grootvlei and 2009-2013 for Komati) and as load is ramped up after commissioning at the return-to-service stations (Figure 2). A decline in SO2 emissions is evident at the return-to-service stations from around 2016 as the load factor is decreased again. As of 2019, three of Grootvlei's six units and five of Komati's nine units have been placed in cold storage. Between March 2015 and March 2018, three of Medupi's six units were commissioned.
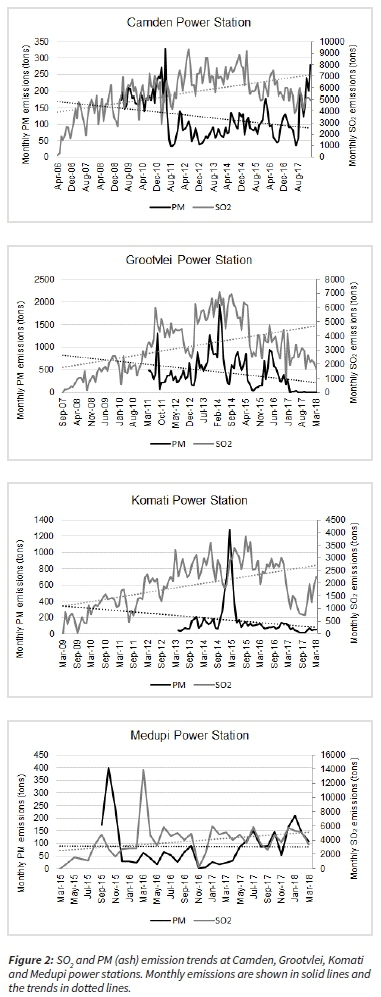
The decreasing trends in PM emissions (Figure 2) reflect the improving removal efficiency of the PM abatement technology (electrostatic precipitators and flue gas conditioning plants at Komati and 3 units at Grootvlei initially, and fabric filter plants at Medupi, Camden and 3 units at Grootvlei) as defects are rectified and performance is optimised. The extremely low PM emissions at Grootvlei from 2017 are due to the fabric filter plant retrofits on units 2, 3 and 4.
Ambient air pollution concentrations
Despite the increase in SO2 emissions from the power stations, there are no statistically significant increasing trends in SO2 concentrations at most monitoring stations during the period when the power stations were commissioned (Table 3). There is only a statistically significant increase of 1.64 μg/m3/year (p<0.001) at Grootvlei monitoring station. The increase occurs in association with airflow from all directions (Figure 3). Highest annual increases in SO2 concentrations occur in association with easterly (3.15 μg/m3/year) and south-easterly (2.82 μg/m3/year) flow, from the direction of Grootvlei power station.
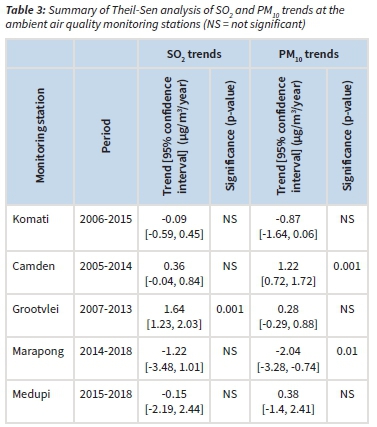
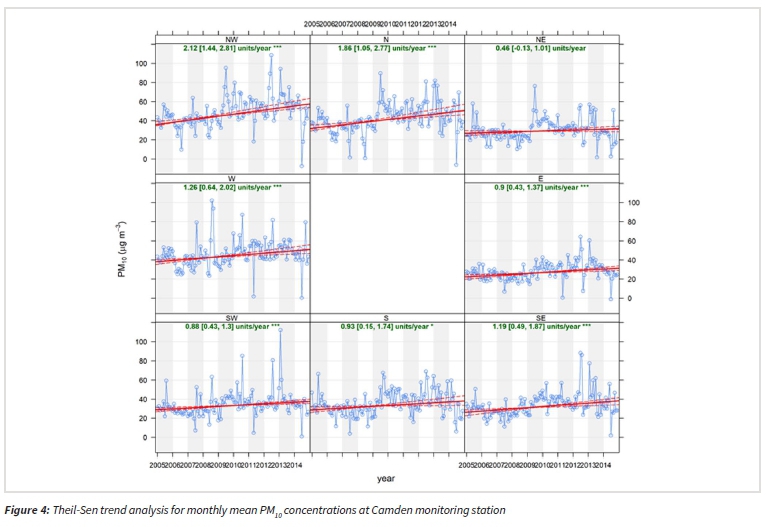
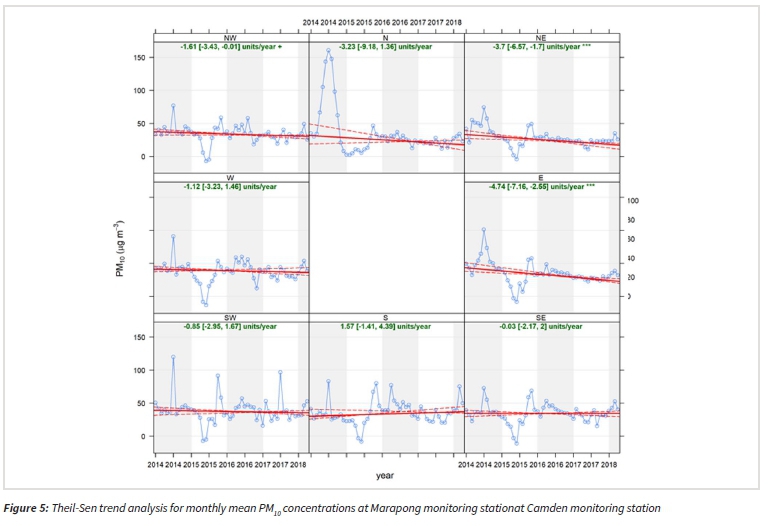
There is a statistically significant increasing trend in PM10 concentrations of 1.22 μg/m3/year (p<0.001) at Camden monitoring station, and a statistically decreasing trend of 2.04 μg/m3/year (p<0.1) at Marapong monitoring station. The most significant increases in PM10 concentrations at Camden monitoring station occur in association with NW (2.12 μg/ m3/year) and N (1.86 μg/m3/year) flow, and also with W flow (1.26 |g/m3/year) from the direction of Camden power station (Figure 4). The decrease in PM10 concentrations at Marapong is presumably due to the reduction in emissions from local sources in Marapong to the E and NE of the monitoring station (Figure 5). Average diurnal variations in PM10 concentrations at the monitoring stations show that PM is mainly from surface sources like vehicle activity. These surface sources typically emit more in the early morning and evening, and the pollutants are trapped by stable conditions at these times.
Correlation Analysis
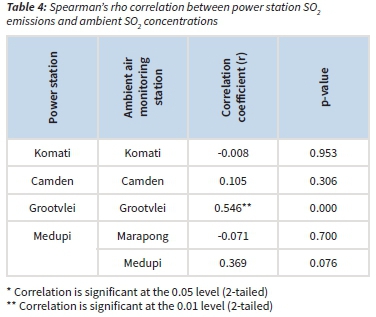
There is no strong positive correlation between SO2 emissions from Komati, Camden and Medupi power station and the ambient SO2 concentrations at the nearby Komati, Camden, Marapong and Medupi monitoring stations. A strong positive correlation exists only between SO2 emissions from Grootvlei power station and ambient SO2 concentrations detected at the Grootvlei monitoring station (r = 0.546 and p-value = 0.000) (Table 4). The pollution roses and diurnal variations provide insight into potential sources of SO2 measured at the monitoring stations. Ambient SO2 levels at the Komati monitoring station are affected by emissions from Duvha (NNW) and Hendrina (NE) power stations. SO2 concentrations at Phola monitoring station are affected by emissions from Duvha (ENE) and Kendal (SSW) power stations and low-level sources, presumably the domestic burning of coal (Thomas and Scorgie, 2006). Ambient SO2 concentrations at the Medupi monitoring station are affected also by emissions from Matimba power station (NE).
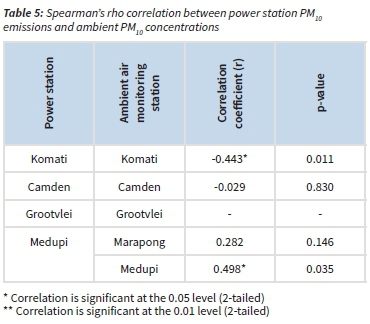
A strong positive correlation exists between PM emissions from Medupi power station and the ambient PM10 concentrations at the Medupi monitoring station (r = 0.498 and p-value = 0.035; Table 5). This correlation is probably due to the construction activities at Medupi. There is a negative correlation between PM emissions from Komati power station and ambient PM10 concentrations. PM emissions from Komati's stacks decrease between 2013 and 2018 as the efficiency of the electrostatic precipitators increased (Figure 2). Presumably the negative correlation is due to changes in other sources affecting Komati monitoring station. The average diurnal ambient PM10 profiles confirm that PM10 is mainly derived from surface sources at all monitoring stations. At the Medupi monitoring station, an ash dump located to the ENE is a potential source of PM10. The correlation between PM emissions and ambient PM10 concentrations at Grootvlei could not be analysed due low emissions data availability.
Compliance with the National Ambient Air Quality Standards
Compliance with the 1-hour and annual SO2 standards
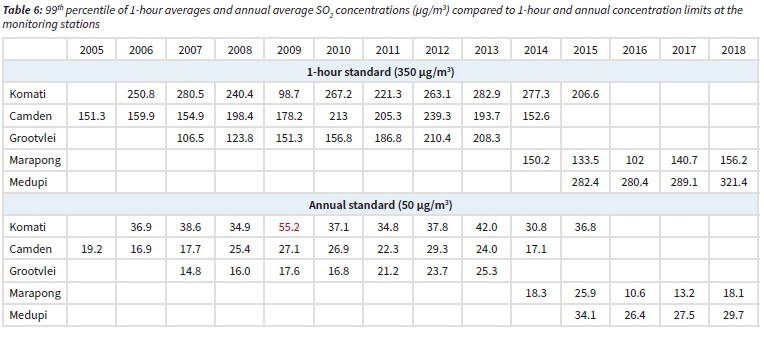
99th percentile 1-hour SO2 concentrations at all the monitoring stations did not exceed the 1-hour limit value of 350 |g/m3. Annual average SO2 concentrations exceeded the annual SO2 standard of 50 μg/m3 only at Komati monitoring station in 2009 (Table 6).
Compliance with the 24-hour and annual PM10 standards
99th percentile 24-hour average PM10 concentrations exceeded the 24-hour standard of 75 μg/m3 at all the monitoring stations, with compliance achieved only at Marapong monitoring station in 2017 and 2018. Compliance with the annual PM10 standard of 40 μg/m3 is also a challenge at all monitoring stations except at Grootvlei, Marapong and Medupi monitoring stations (Table 7).
Discussion
Relationship between power station emissions and ambient air quality
Overall, there is not a strong correlation between the ambient air pollution concentrations detected by the five ambient air quality monitoring stations and the increasing emissions from the four coal-fired power stations near them. Strong positive correlations are only recorded for SO2 concentrations at Grootvlei and PM10 concentrations at Medupi monitoring station. There is a weak positive correlation between emissions at Medupi power station and ambient PM10 concentrations at Marapong monitoring station. It is likely that the correlation between PM emissions from Medupi and ambient PM10 concentrations in the vicinity is due to construction activity at Medupi, increased vehicle activity and an increase in the population of Marapong due to Medupi's construction, and not PM emissions from Medupi's stacks.
Within the HPA, this study found a statistically significant increasing trend in SO2 concentrations at Grootvlei monitoring station. A statistically significant increasing trend in PM10 concentrations was found at Camden monitoring station. The increase in PM10 levels at Camden contrasts with the decreasing trend observed by Feig et al. (2019) in Ermelo, which suggests that activities at Camden may be affecting PM10 concentrations downwind. In terms of compliance, this study indicates compliance with the annual SO2 National Ambient Air Quality Standard at all monitoring stations except at Komati monitoring station in 2009. Furthermore, compliance with the annual ambient PM10 standard was not achieved at all the monitoring stations except at Grootvlei monitoring station from 2007 to 2013. Feig et al. (2019) found similar results in the HPA with the only exceedance of the annual ambient SO2 standard at the Witbank monitoring station between 2008 and 2014, and an exceedance of the annual ambient PM10 standard at all monitoring stations expect at the Hendrina and Middelburg stations.
This study attributes PM10 ambient concentrations at the Marapong monitoring station to local domestic combustion and/or traffic sources, as indicated by early morning and evening diurnal peaks. Feig et al. (2016) found similar results for PM10 concentrations in the WBPA. The association between high SO2 concentrations at Matimba Power Station and Grootegeluk Coal Mine was also found by Feig et al. (2016). In terms of trends, this study found a statistically significant decreasing trend in PM10 concentrations of 2.04 μg/m3/year (p < 0.01) at Marapong monitoring station between 2014 and 2018. Feig et al. (2016) also found a statistically significant decreasing trend of 6.5 μg/ m3/year (p < 0.01) in Lephalale between 2012 and 2015. This study found there to be compliance with the annual ambient SO2 standard at the Marapong (between 2014 and 2018) and Medupi (between 2015 and 2018) monitoring stations, as was found by Feig et al. (2016) elsewhere in the WBPA. There was also compliance with the annual ambient PM10 standard at the Marapong and Medupi monitoring stations, although Feig et al. (2016) found that the annual ambient PM10 standard was exceeded elsewhere in the WBPA.
Coal combustion industries are one of the biggest atmospheric polluters globally (Pretorius et al., 2015; Rohde and Muller, 2015, Lourens et al., 2011, SOGA, 2018), however the contribution of other industries to air pollution is well documented. These include mines (Ekosse, 2005, Banza, 2009, Wright et al., 2017); road traffic (Khedo et al., 2010, Shirinde et al., 2014, SOGA, 2018); domestic burning and open burning (Balashov et al., 2014, Shirinde et al., 2014, Wright et al., 2017, SOGA, 2018). In the HPA, Lourens et al. (2011) found SO2 and NO2 concentrations were highest near industrial areas such as metallurgical operations, coal-based industries, mines, petrochemical industries, and steel smelters. In the WBPA, SO2 concentrations are linked mostly to industries, and a small percentage to residential burning and vehicle emissions. PM10 concentrations were linked to mining activities (WBPA Air Quality Management Plan, 2015).
Non-compliance and human health
Compliance with the 24-hour PM10 standard of 75 μg/m3 was achieved only at Camden monitoring station in 2006, Grootvlei monitoring station in 2007, and Marapong monitoring station in 2017 and 2018. Compliance with the annual PM10 standard was not achieved, with exceptions at the Marapong and Medupi monitoring stations. Compliance with the SO2 1-hour standard of 350 μg/m3 was achieved at all the monitoring stations except at Komati monitoring station in 2009. The annual SO2 standard of 50 μg/m3 was exceeded only at Komati monitoring station in 2009.
These findings indicate that PM10 pollution is a bigger problem than SO2 pollution in the HPA and the WBPA. Research findings have shown that exposure to air pollution is one of the major causes of poor health globally (Silva et al., 2016; Wright et al., 2017; Martinez et al., 2018; SOGA, 2019), and 4.9 million global deaths (SOGA, 2019). As a result, it is important to put measures in place to ensure that people are not impacted by poor ambient air quality. In South Africa, 1800 premature deaths in 2012 were attributed to the exposure to fine PM (Keen and Altieri, 2016b). In addition, Balashov et al. (2014) found that the concentrations of NOX, SO2, PM, CO and O3 over the HPA exceeded the WHO guidelines, and contributed to respiratory infections. PM2.5 provides a better indication of exposure to human than PM10, and should therefore be monitored more widely.
The effectiveness of ambient air monitoring stations
From the results obtained, it is inferred that the establishment of monitoring stations in the vicinities of coal-fired power stations is necessary but not sufficient to measure the impact of the power stations on ambient air quality. The main limitation of an ambient monitoring station is that it only provides a measurement at one point in a large domain (Akyuz and Kaynak, 2019). Monitoring ideally needs to be supplemented with other forms of impact assessments, like dispersion modelling, that covers the entire domain of influence.
The value of monitoring stations is particularly evident when monitoring stations are sited in residential areas, where the measurements give a fairly accurate reflection of levels of pollution that people are exposed to monitoring stations also detect the cumulative impacts of a multitude of sources related to the power station of interest. For example, at Marapong, impacts of construction vehicles, domestic emissions by people who are temporarily residing in Marapong while they work on Medupi's construction, ash and coal handling at Matimba, and tall stack emissions from Medupi and Matimba are detected. Many smaller and fugitive emission sources are very difficult to accurately model and cannot be observed from satellites, and so are best measured at ambient monitoring stations.
Conclusion
In this paper, we identified trends in air pollution concentrations monitored at the ambient monitoring stations intended to measure impacts of new and recommissioned coal-fired power stations in South Africa. We also attempted to use statistical techniques to determine the extent to which these trends can be statistically related to changing emission levels.
The only potential observed instance where pollutant emissions, emitted from a power station had an impact on ambient pollutant levels was observed for SO2 emissions from Grootvlei Power Station, detected at the Grootvlei ambient monitoring station. The increasing trend in SO2 concentrations was highest in association with airflow from the direction of the power station. Ambient PM10 concentrations at the Medupi monitoring station downwind of Medupi power station are also significantly correlated with the commissioning of Medupi; however, the correlation is likely due to construction activity at Medupi, and not ash emissions from the stacks. The diurnal profile of PM10 concentrations at Medupi confirms that surface sources are the main contributor to ambient PM10 levels in the area.
No other significant correlations were found between increasing emissions of SO2 and PM from the power stations, and ambient air quality levels. This is probably due to the fact that ambient pollution levels reflect the accumulation of pollutants from a large number of sources, both local and regional. Also, ash emissions from power station stacks are a fairly small source of PM in comparison to other sources in the priority areas.
We conclude that ambient monitoring stations are a useful way of determining impacts from coal-fired power stations on ambient air quality. They should be preferentially sited in residential areas where they measure exposure levels. They are particularly valuable in showing the cumulative impacts of a number of other activities directly and indirectly associated with the construction and operation of a coal-fired power station. However, ambient measurements should be supplemented with dispersion modelling, both during impact assessment before construction, and also during and after construction, to estimate the impact of the power station throughout its domain of influence.
Acknowledgements
Itumeleng Morosele's Masters studies were funded by the National Research Foundation (NRF). We would like to thank Eskom SOC Ltd (Bontle Monametsi) for the timeous provision of data, Mr Anesu Khuhudzai at UJ STATKON for his assistance with performing statistical analyses, and Kgomotso Langa, Ratanang Rantho, Masonwabe Gatyeni and Nhlanhla Zondo for their assistance with data preparation and results analyses. Gratitude is also extended to Ms Bianca Wernecke for reviewing a draft of this paper.
Author contributions
Itumeleng Morosele analysed most of the data and compiled the first draft of this paper. Kristy Langerman conceived of the study and revised the manuscript.
References
Akyuz, E. and Kaynak, B. 2019, Use of dispersion model and satellite SO2 retrievals for environmental impact assessment of coal-fired power plants. Science of the Total Environment, 689: 808-819. https://doi.org/10.1016/jJ.scitotenv.2019.06.464. [ Links ]
Balashov, N.V., Thompson, A.M., Piketh, S.J. and Langerman, K.E. 2014, Surface ozone variability and trends over the South African Highveld from 1990 to 2007. Journal of Geophysical Research, 119(7): 4323 - 4342. https://doi.org/10.1002/2013JD020555. [ Links ]
Banza, C.L., Nawrot, T.S., Haufroid, V., Decree, S., De Putter, T., Smolders, E., Kabyla, B.I., Luboya, O.N., Ilunga, A.N., Mutombo, A.M. & Nemery, B. 2009, High human exposure to cobalt and other metals in Katanga, a mining area of the Democratic Republic of Congo. Environmental Research, 109(6): 745-752. https://doi.org/10.1016/jJ.envres.2009.04.012. [ Links ]
Carslaw, D.C. and Ropkins, K. 2012, Openair - an R package for air quality data analysis. Environmental Modelling & Software, 27-28: 52-61. https://doi.org/10.1016/jJ.envsoft.2011.09.008. [ Links ]
Carslaw, D.C. 2015, The openair manual - open-source tools for analysing air pollution data. Manual for version 1.1-4, King's College London. [ Links ]
Coakley, J.A., Cess, R.D. and Yurevich, F.B. 1983, The effect of tropospheric aerosols on the earths radiation budget: a parameterization for climate models. Journal of the Atmospheric Sciences, 40:116-138. https://doi.org/10.1175/1520-0469(1983)040<0116:TEOTAO>2.0.CO;2. [ Links ]
Crawford, J., Cohen, D.D. and Atanacio, A. 2018, The impact of closure of coal-fired power stations on aerosol concentrations in the Sydney Basin. Atmospheric Pollution Research, 9: 1167-1176. https://doi.org/10.1016/j.apr.2018.05.002. [ Links ]
Ekosse, G.E. 2008, Environmental Effects of Nickel-Copper Exploitation on Workers Health Status at Selebi Phikwe Area, Botswana. Journal of Applied Sciences, 8(13): 2344-2356. https://doi.org/10.3923/jas.2008.2344.2356. [ Links ]
Eskom 2016, Research, Testing and Development (RT&D): Ambient Air Quality Annual Report (January - December 2016). Eskom Holdings Limited. [ Links ]
Eskom 2017, Medium-term System Adequacy Outlook 2017 to 2021. Eskom Holdings Limited. https://www.eskom.co.za/Whatweredoing/SupplyStatus/cuments/2017to2021MedTermSysAdequacyOutlook31Jul2017.pdf. [ Links ]
Eskom 2019, Applications for suspension, alternative limits and/or postponement of the minimum emission standards (MES) compliance timeframes for Eskom's coal and liquid fuel fired power stations: summary document. Eskom ENV18-R245 rev 2.1. https://www.eskom.co.za/MESapplications/Documents/Annexure%203%20-%20ESKOMs%20MES%20Applications%20-%20Summary%2020%20March%202019%20rev%202.1.pdf. [ Links ]
Feig, G.T., Naidoo, S. & Ncgukana, N. 2016, Assessment of ambient air pollution in the Waterberg Priority Area 2012-2015, Clean Air Journal, 26(1): 21-28. https://doi.org/10.17159/2410-972X/2016/v26n1a9. [ Links ]
Feig, G., Garland, R.M., Naidoo, S., Maluleke, A. and van der Merwe, M. 2019, Assessment of changes in concentrations of selected criteria pollutants in the Vaal and Highveld Priority areas. Clean Air Journal, 29(2): 1-13. https://doi.org/10.17159/caj/2019/29/2.7464. [ Links ]
Gouw, J., Parrish, D., Frost, G., Trainer, M. 2014, Reduced emissions of CO2, NOx, and SO2 from U.S. power plants owing to switch from coal to natural gas with combined cycle technology. Earths Future, 2: 75-82. https://doi.org/10.1002/2013EF000196 [ Links ]
Gray, H.A. 2019, Air quality impacts and health effects due to large stationary source emissions in and around South Africa's Mpumalanga Highveld Priority Area (HPA). https://cer.org.za/wp-content/uploads/2019/06/Andy-Gray-Report.pdf. [ Links ]
Hirsikko, A., Vakkari, V., Tiita, P., Manninen, H.E., Gagne, S., Laakso, H., Kulmala, M., Mirme, A., Mirme, S., Mabaso, D., Beukes, J.P. & Laakso, L. 2012, Characterisation of sub-micron particle number concentrations and formation events in the western Bushveld Igneous Complex, South Africa. Atmospheric Chemistry and Physics, 12: 3951-3967. https://doi.org/10.5194/acp-12-3951-2012. [ Links ]
Holland, M. 2017, Health impacts of coal fired power plants in South Africa, report for Groundwork (South Africa) and Health Care without Harm. https://cer.org.za/wp-content/uploads/2017/04/Annexure-Health-impacts-of-coal-fired-generation-in-South-Africa-310317.pdf. [ Links ]
International Energy Agency (IEA) 2020, Energy policy review. Germany, https://www.iea.org/reports/germany-2020. [ Links ]
Kaufman, Y.J., Tanré, D. and Boucher, O. 2002, A satellite view of aerosols in the climate system. Nature 419:215-223. https://doi.org/10.1038/nature01091. [ Links ]
Keen, S. and Altieri, K. 2016a, The health benefits of attaining and strengthening air quality standards in Cape Town. Clean Air Journal, 26(2): 22-27. https://doi.org/10.17159/2410-972X/2016/v26n2a9. [ Links ]
Keen, S. & Altieri, K. 2016b, The cost of air pollution in South Africa. International Growth Centre (IGC). http://eprints.lse.ac.uk/81698/. [ Links ]
Khedo, K.K., Perseedoss, R. and Mungur, A. (2010). A wireless sensor network air pollution 797 monitoring system. International Journal of Wireless & Mobile Networks, 2(2): 31-45. https://doi.org/10.5121/ijwmn.2010.2203. [ Links ]
Langerman, K.E. and Pauw, C.J. 2018, A critical review of health risk assessments of exposure to emissions from coal-fired power stations in South Africa. Clean Air Journal, 28(2): 1-12. https://doi.org/10.17159/2410-972x/2018/v28n2a19. [ Links ]
Lourens, A.S., Beukes, J.P., van Zyl, P.G., Fourie, G.D., Burger, J.W., Pienaar, J.J., Read, C.E. & Jordaan, J.H. 2011, Spatial and temporal assessment of gaseous pollutants in the Highveld of South Africa. South African Journal of Science, 107(1/2): 1-8. https://doi.org/10.4102/sajs.v107i1/2.269. [ Links ]
Ma, Z., Liu, R., Liu, Y., Bi, J. 2019, Effects of air pollution control policies on PM2.5 pollution improvement in China from 2005 to 2017: a satellite-based perspective. Atmos. Chem. Phys. 19: 6861-6877. https://doi.org/10.5194/acp-19-6861-2019. [ Links ]
Mannucci, P.M. & Franchini, M. 2017, Health Effects of Ambient Air Pollution in Developing Countries. International Journal of Environmental Research and Public Health, 14: 2-8. https://doi.org/10.3390/ijerph14091048. [ Links ]
Martinez, G.S., Spadaro, J.V., Chapizanis, D., Kendrovski, V., Kochubovski, M. and Mudu, P. 2018, Health Impacts and Economic Costs of Air Pollution in the Metropolitan Area of Skopje. International Journal of Environmental Research and Public Health, 15(626): 1-11. https://doi.org/10.3390/ijerph15040626. [ Links ]
Pretorius, I., Piketh, S., Burger, R. & Neomagus, H. 2015, A perspective on South African coal fired power station emissions. Journal of Energy in Southern Africa, 26(3): 27-40. https://doi.org/10.17159/2413-3051/2015/v26i3a2127. [ Links ]
Rohde, R.A. & Muller, R.A. 2015, Air Pollution in China: Mapping of concentrations and Sources. PLOS ONE, 10(8): 1-14. https://doi.org/10.1371/journal.pone.0135749. [ Links ]
Russell, M.C., Belle, J.H. and Liu, Y. 2017, The impact of three recent coal-fired power plant closings on Pittsburgh air quality: A natural experiment. Journal of the Air & Waste Management Association, 67(1): 3-16. https://doi.org/10.1080/10962247.2016.1170738. [ Links ]
Shirinde, J., Wichmann, J. and Voyi, K. 2014, Association between wheeze and selected air pollution sources in an air pollution priority area in South Africa: a cross-sectional study. Environmental Health, 13(32): 1-12. https://doi.org/10.1186/1476-069X-13-32. [ Links ]
Silva, R.A., Adelman, Z., Fry, M.M. & West, J.J. 2016, The Impact of Individual Anthropogenic Emissions Sectors on the Global Burden of Human Mortality due to Ambient Air Pollution. Environmental Health Perspectives, 124(11): 1776-1784. https://doi.org/10.1289/EHP177. [ Links ]
SOGA (State of Global Air) 2018, A specialist report on global exposure to air pollution and its disease burden. [ Links ]
SOGA (State of Global Air) 2019, A specialist report on global exposure to air pollution and its disease burden. [ Links ]
StatsSA (Statistics South Africa) 2018, Electricity, gas and water supply industry, 2016, Report No. 41-01-02 (2016), Statistics South Africa. [ Links ]
Thomas, R. and Scorgie, Y. 2006, Air quality impact assessment for the proposed new coal-fired power station (Kendal North) in the Witbank area, APP/06/NMS-01 Rev 0.2, Airshed Planning Professionals, https://www.eskom.co.za/OurCompany/SustainableDevelopment/EnvironmentalImpactAssessments/Documents/Air_quality_part_1.pdf. [ Links ]
Venter, A.D., Vakkari, V., Beukes, J.P., van Zyl, P.G., Laakso, H., Mabaso, D., Tiita, P., Josipovic, M., Kulmala, M., Pienaar, J.J. & Laakso, L. 2012, An air quality assessment in the industrialised western Bushveld Igneous Complex. South Africa. South African Journal of Science, 108(9/10): 1-10. https://doi.org/10.4102/sajs.v108i9/10.1059. [ Links ]
Wang, G., Deng, J., Zhang, Y., Zhang, Q., Duan, L., Hao, J. and Jiang, J. 2020, Air pollutant emissions from coal-fired power plants in China over the past two decades. Science of the Total Environment, 741: 140326. https://doi.org/10.1016/j.scitotenv.2020.140326. [ Links ]
WHO (World Health Organization) 2016, Ambient air pollution: A global assessment of exposure and burden of disease. World Health Organization, Geneva. [ Links ]
Wright, C.Y., Garland, R.M., Thambiran, T., Forbes, P., Diab, R. & Oosthuizen, M.A. 2017, Air quality and human health impacts in southern Africa. Available from: https://www.researchgate.net/publication/320181172_Air_quality_and_human_health_impacts_in_southern_Africa. [ Links ]
Xue, Z., Hao, J., Chai, F., Duan, N., Chen, Y., Li, J., Chen, F., Liu, S. & Pu, W. 2005, Air Quality Impact of the Coal-Fired Power Plants in the Northern Passageway of the China West-East Power Transmission Project. Journal of the Air & Waste Management Association, 55(12): 1816-1826. https://doi.org/10.1080/10473289.2005.10464781. [ Links ]
Received: 26 August 2020
Reviewed: 23 September 2020
Accepted: 22 October 2020

