


Services on Demand
Article
 English (pdf)
 Article in xml format
 Article references
Indicators

Related links
-
 Cited by Google
 -
 Similars in Google
Share

 Permalink
Clean Air Journal
On-line version ISSN 2410-972X
Print version ISSN 1017-1703
Clean Air J. vol.30 n.1 Pretoria 2020
http://dx.doi.org/10.17159/caj/2020/30/1.7512
TECHNICAL ARTICLE
Using Microsoft© Power BI© to visualise Rustenburg Local Municipality's Air Quality Data
Caradee Y. WrightI, II; Bianca WerneckeIII, IV
ISouth African Medical Research Council, Environment and Health Research Unit, Pretoria, South Africa, 0001, cwright@mrc.ac.za
IIDepartment of Geography, Geoinformatics and Meteorology, University of Pretoria, Pretoria, South Africa, 0001
IIIEnvironmental and Health Research Unit, South African Medical Research Council, Johannesburg, South Africa, 2094, bianca.wernecke@mrc.ac.za
IVDepartment of Environmental Health, University of Johannesburg, Johannesburg, South Africa, 2094
ABSTRACT
Microsoft© Power BI© is a business analytics tool that visualises data in an accessible manner. It creates visual data reports quickly in a series of panels to give an overview of data while still offering access to more sophisticated visualisation methods too. While statistical tools, like R and MatLab, remain the 'gold standard' for analysing air quality data, simple methods to visualise data are also helpful. Here, we explored the use of Power BI Desktop© to visualise and interpret air quality data for the Rustenburg Local Municipality. Rustenburg is in the Waterberg-Bojanala Priority Area - the third air pollution priority area for air quality management. Ambient PM10 data for three towns, namely, Thlabane, Marikana and Boiketlong, were obtained for six years (2013-2018) in South Africa. Data underwent quality control before being imported into Power BI©. A four-panel dashboard was generated to show (in) compliance with the daily and annual average South African National Ambient Air Quality Standard for PM, annual and average concentrations, frequency of exceedances and a summary of data availability by site. Generally, PM10 data quantity and quality were poor and where data were available, concentrations were high. This type of data visualisation tool can be applied with relative ease by Air Quality Officers and Environmental Health Practitioners for a snapshot overview of the air quality in their area of jurisdiction. The interactive dashboard is also useful for making graphics for policy documents and reports.
Keywords: air pollution, environmental health, South Africa, Waterberg Priority Area
Introduction
Air quality in the Waterberg-Bojanala Priority Area
The Waterberg-Bojanala Priority Area was declared as such on the 15 June 2012 (DEA, 2012). It is in the north-west of South Africa and covers about 68 000 km2, lying on the Bushveld Igneous Complex, characterised by significant mining and metallurgical activities (Venter et al. 2012). It includes the Waterberg District Municipality in Limpopo and parts of the Bojanala Platinum District Municipality in North West Province. Nine Local Municipalities are located within the Priority Area one of which is Rustenburg.
The Priority Area was identified as a potential air pollution hotspot at a time when several developments in the area were being planned. A precautionary approach was taken to manage and control air quality simultaneously to the planning of these developments.
Local sources which influence the air pollution in this region include traffic along the N4 platinum highway, mining and industrial sources as well as, to a large degree, domestic fuel burning practices (Hirsikko et al. 2012, Venter et al. 2012, C&M Consulting 2019). Sources contributing to the particulate matter (PM) concentrations in the region have been shown to stem from domestic burning for heating and cooking in the early mornings and the late afternoons / early evenings. During the day, PM has been found to originate from industrial, residential and natural sources (Hirsikko et al. 2012).
Power BI
Local and provincial-level Air Quality Officers, Environmental Managers and Environmental Health Practitioners are tasked to monitor and manage air quality in the Waterberg-Bojanala Priority Area. This work is demanding as it is part of a large scope of work, usually covering a wide spatial area of jurisdiction, and with insufficient resources and capacity, and so finding relatively easy and simple tools to interrogate and present air quality data, in a way that is easy to understand, is useful.
Microsoft© Power BI© (BI, Business Informatics) is a business analytics tool that visualises data in an accessible manner. It transforms data into visuals which one can readily share on any device. It compiles single view, multi-panel displays for quick decision-making and interrogation of data (Power BI© is available at the following website https://powerbi.microsoft.com/en-us/). Other tools to analyse air quality data do exist, such as OpenAir, R, Statistica, MatLab, or Python. Advantages of using Power BI© however, are the integration with other Microsoft© products such as Excel© in which air quality data is often made available. It also presents the data in a dashboard format that is 'less scientific' and possibly useful for display in a policy document or report.
In this report, we explored the use of Power BI© to visualise and interpret air quality data for PM10 from 2013-2018 for the Rustenburg Local Municipality. We illustrate the dashboard and the nature of the graphics that the software can present and, in so doing, attempt to interrogate the trends in PM10 for the Municipality.
Methods
Data
Six years (2013-2018, inclusively) of PM10 data were available from three stations, namely, Thlabane, Marikana and Boiketlong, which form part of the of the Rustenburg Local Municipality Air Quality Monitoring Network. Data were provided at 1-hour intervals as well as daily averages. Analyses were made using the daily average datasheets.
PM10 data were analysed (using the 99th percentile) to determine annual average and annual maximum concentrations in μg/m3 between 2013 and 2018. Annual and daily compliance to the South African National Ambient Air Quality Standards (NAAQS) was also assessed. Exceedances above the daily limit value (defined in the NAAQS) were also calculated, together with the percentage of time that the concentrations were above these limits (based on data availability).
Application
Data were prepared and checked for availability as well as other quality control measures in Microsoft© Excel© using pivot tables and then by importing structured sheets into Power BI© using their user-friendly dashboard interface. Bing is integrated into the application for the manufacturing of maps to plot air quality monitoring station location information, for example, whether the station complies with the NAAQS for PM10 in a particular year.
Results
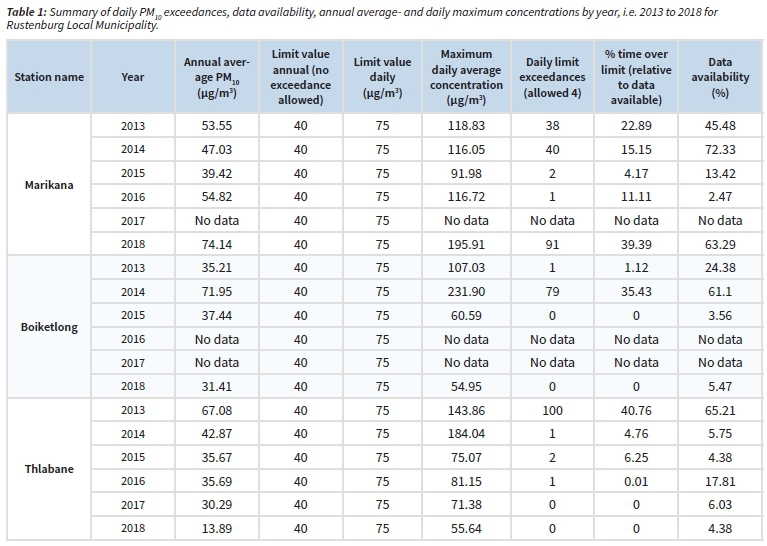
Table 1 gives a summary of the PM10 data that were provided by Rustenburg Local Municipality between 2013 and 2018. Data availability was a challenge for all three ambient stations. No data were available from Boiketlong station from 2016 to 2017 (inclusively), and from Marikana in 2017. Marikana station had the best data availability in 2014 at 72%.
The annual average maximum PM10 concentrations, between 2013 and 2018, were 74, 72 and 67 μg/m3, for Marikana, Boiketlong and Thlabane, respectively. During the six year-period assessed, Marikana showed exceedances of the annual NAAQS (40 μg/m3) four times, Thlabane twice and Boiketlong once. The daily NAAQS for PM10 is 75 μg/m3 and in some places this limit was exceeded multiple times during a year. For example, in Thlabane, this limit was exceeded 100 times in 2013. Moreover, in some years, the percentage of time that the PM10 concentrations were above the daily limit value (depending on data availability) was up to 40% at some stations.
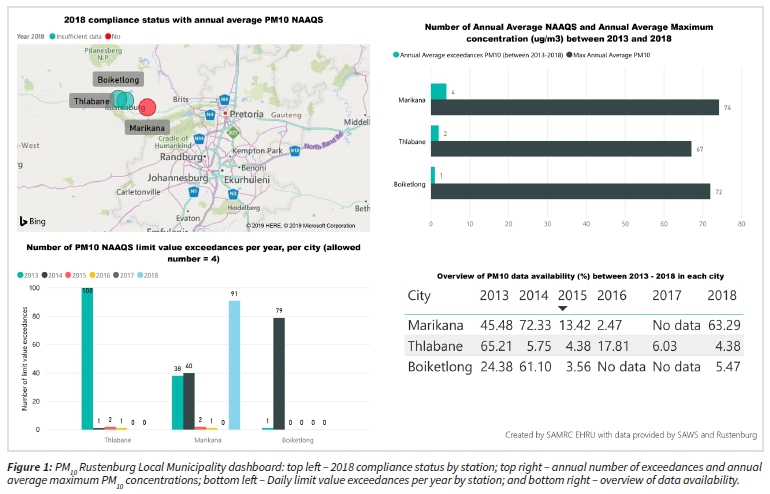
These data and results were then visualised in a dashboard using Power BI©. Figure 1 shows the panel-type display and it indicates that two out of the three stations did not provide enough data to draw a conclusion about compliance with the PM10 annual average limit for 2018. The plot on the top-right hand-side of the dashboard succinctly shows the maximum annual average concentrations for PM10, as well as the number of times a respective station showed non-compliance with the annual NAAQS within the time under review. The bottom left-hand-side plots shows the number of daily limit value exceedances while the table on the bottom right emphasises the problem of data availability.
Discussion
From the evidence available for PM10 concentrations in the Rustenburg Local Municipality at three monitoring stations, it is apparent that air PM10 concentrations often exceed levels considered by the NAAQS as "safe to breathe". The NAAQS annual and daily limits are not being met most of the time. There is some variability in the data reported by different studies. Data collected in August 2008 showed that daily PM10 concentrations at Marikana ranged between 3 - 9 μg/m3 (Kaonga and Kgabi, 2011). Venter et al (2012) monitored PM10 concentrations just half a kilometre south-east of the monitoring station set up by the Rustenburg Local Municipality in Marikana and reported a maximum 24-hr average PM10 concentration of 222 μg/m3. Similarly, the 2019 August report of the Rustenburg Local Municipality's Ambient Monitoring Network, for the time period January - August 2019 reported 125 and 51 daily limit exceedances in Marikana and Boiketlong, respectively (C&M Consulting 2019), supporting evidence that the air quality measured in these towns exceeds legislated limits. More research and higher quality data are needed to confirm whether these data suggest a worsening in air quality in the area. Indeed, data quality and reliability needs attention given that these stations fall within the Waterberg-Bojanala Priority Area where air quality management is deemed a priority of national importance. The 2019 ambient monitoring reports indicate that steps have been taken in Marikana and Boiketlong to increase data availability, reporting 84% and 97% data coverage for the month of August 2019 in both communities (C&M Consulting). Reasons for low data availability are not clear, however, gaps in data could be due to a range of reasons such as power failures, lack of maintenance or calibration leading to, for instance, instrument drift. Even theft / vandalization of instruments is possible. Some monitors are taken out of operation for periods of time to ensure they are fixed when broken, leaving gaps in the data if the monitors are not replaced.
Though the results of this study do add to the available evidence that air quality is poor in these areas, these findings should be interpreted in the context of low data availability. Low data availability can introduce bias into the analysis, if, for example, the available data are representative of a specific season or time of year.
Moving from a simple table (as provided in Table 1) to the visualised dashboard (shown in Figure 1) highlights some of the benefits of using an interactive and easy to understand platform such as Power BI©. The data become visual in 'telling a story'. The dashboard can be created by authorities such as local municipalities or industry to zoom into air quality in a specific space. In some respects, this functionality is similar to that provided by the South African Air Quality Information System but through the use of Power BI© one can change all aspects of data presentation to zoom into more local contexts with more specific analytics.
Power BI© has been used by Worcestershire County Council in the United Kingdom to create an Air Quality Dashboard online (WCC, 2019). Their dashboard goes beyond air quality data and includes number of hospital admissions too. Similarly, the Lancashire City Council considers emissions, asthma prevalence, chronic obstructive pulmonary disease prevalence, and maps for respiratory conditions and emissions on their dashboard for air quality management in Lancashire (LCC, 2019). The Power BI© dashboard could be used by local authorities to analyse and display their data in a similar interactive way to assess air quality in an area. This type of visual can be powerful and may also prompt action to prevent adverse impacts on human health.
Conclusion
The application of Power BI© to PM10 data from the Rustenburg Local Municipality helped transform the data into insights and has the potential to consequently trigger actionable efforts with relative ease. Preparation of graphs and tables was simple and these could be inserted into annual progress reports for review and decision-making.
Despite the relatively poor quantity and quality of the available data, some useful information could be extracted about PM10 concentrations at the three sites in Rustenburg. Evidence available suggests that more needs to be done to monitor PM10 concentrations in the area and ensure compliance with NAAQS.
While we did not conduct any complex or novel analyses for this technical report, we believe we have shown that Power BI© can add value to a "policy / compliance / management" context for quick, easy visualisation of data. Power BI© is user-friendly, easy to understand and to interpret and takes the shape of a dashboard which is currently a tool used globally to help in decision-making.
Acknowledgements
The South African Weather Service and the Rustenburg Local Municipality are acknowledged for the provision of air quality data. CYW receives research funding from the South African Medical Research Council and the National Research Foundation (South Africa).
References
C&M Consulting Engineers. 2019. The Rustenburg Local Municipality Air Quality Monitoring Summary Report - for August 2019. Available at: https://saaqis.environment.gov.za/Pagesfiles/RLM%20August%202019.pdf [ Links ]
Department of Environmental Affairs (DEA), 2012. Declaration of the Waterberg Priority Area Notice 494 of 2012, 15 June 2012, Government Gazette, 35435. https://www.environment.gov.za/sites/default/files/gazetted_notices/nemaqa_waterberg_declaration_g35435gen495_0.pdf [ Links ]
Department of Environmental Affairs (DEA). 2014. The Waterberg-Bojanala Priority Area AQMP: Problem Analysis and Intervention Description, November 2014. http://www.saaqis.org.za/filedownload.aspx?fileid=820. [ Links ]
Feig, G.T., Naidoo, S. and Ncgukana, N., 2016. Assessment of ambient air pollution in the Waterberg Priority Area 20122015. The Clean Air Journal. 26(1): 21-28. http://dx.doi.org/10.17159/2410-972X/2016/v26n1a9. [ Links ]
Hirsikko, A., Vakkari, V., Tiitta, P., Manninen, H.E., Gange, S., Laakso, H., Kulmala, M., Mirme, A., Mirme, S., Mabaso, D., Beukes, J.P. and Laakso, L.,2012. Characterisation of sub-micron particle number concentrations and formation events in the western Bushveld Igneous Complex, South Africa. Atmospheric Chemistry and Physics, 122:3951-3967. DOI: 10.5194/acp-12-3951-2012. [ Links ]
Kaonga B. and Kgabi NA. 2011. Investigation into presence of atmospheric particulate matter in Marikana, mining area in Rustenburg Town, South Africa. Environ Monitor Assessment, 178 (1-4), 213-220. DOI: https://doi.org/10.1007/s10661-010-1683-1 [ Links ]
Lancashire City Council (LCC), 2019. Air quality and Health. Dashboard available at: https://app.powerbi.com/ [ Links ]
Kaonga B. and Kgabi NA. 2011. Investigation into presence of atmospheric particulate matter in Marikana, mining area in Rustenburg Town, South Africa. Environ Monitor Assessment, 178 (1-4), 213-220. DOI: https://doi.org/10.1007/s10661-010-1683-1 [ Links ]
Lancashire City Council (LCC), 2019. Air quality and Health. Dashboard available at: https://app.powerbi.com [ Links ]
South African Department of Environmental Affairs (DEA). National ambient air quality standards. 2009 Republic of South Africa. https://www.environment.gov.za/sites/default/files/legislations/nemaqa_airquality_g32816gon1210.pdf [ Links ]
Venter, A.D., Vakkari, V., Beukes, J.P., van Zyl, P.G., Laakso, H., Mabaso, D., Tiitta, P., Josipovic, M., Kulmala, M., Pienaar, J.J and Laakso, L. 2012. An air quality assessment in the industrialised western Bushveld Igneous Complex, South Africa. South African Journal of Science. 108(9/10): 3-10. DOI: 10.4102/sajs.v108i9/10.1059 [ Links ]
Worcestershire County Council (WCC), 2019. Air Quality Dashboard. Dashboard available at: https://app.powerbi.com [ Links ]
Received: 23 October 2019
Reviewed: 4 February 2020
Accepted: 27 April 2020

