


Services on Demand
Article
 English (pdf)
 Article in xml format
 Article references
Indicators

Related links
-
 Cited by Google
 -
 Similars in Google
Share

 Permalink
Clean Air Journal
On-line version ISSN 2410-972X
Print version ISSN 1017-1703
Clean Air J. vol.30 n.1 Pretoria 2020
http://dx.doi.org/10.17159/caj/2020/30/1.8001
RESEARCH ARTICLE
Public perceptions of air quality status and suggestions for improvement: The case of Richards Bay and its surroundings, uMhlathuze Local Municipality, South Africa
Nick O. OkelloI; Tom W. OkelloI; Mark ZunckelII
IUniversity of Free State, Private Bag X13, Kestell Rd, Phuthaditjhaba, 9866, Free State, South Africa, 2017515335@ufs4life.ac.za and OkelloTW@ufs.ac.za
IIuMoya-NILU Consulting, Durban, KwaZulu-Natal, South Africa, mark@umoya-nilu.co.za
ABSTRACT
Whereas industrial growth is instrumental in unlocking poverty and advancing development, often, the effect of pollution on the environment, particularly air quality, is seldom accurately predicted. The effects, which include mortality, morbidity, and loss of productive time, are demonstrated later after the damage is done. The views of the pollution-exposed public in industrialised centres is important to ascertain if policy intervention is enhancing environmental protection for all and justice by extension. Through an online survey, 215 residents of the rapidly industrialising Richards Bay and surrounding areas in South Africa responded to the questions about their perceptions of air quality and recommendations to improve air quality management. Results indicate a concern over air quality with most residents perceiving the air quality as fair or poor. Industrial emission was cited as the leading cause of pollution followed by sugar cane and agrarian burning. Irritation of the ear, nose and throat, as well as sneezing and coughing, were the health effects experienced by residents for which air pollution can be partly attributed. The public recommends an improvement in air quality monitoring, consequence management, technology and public transport system. In addition, they recommended the introduction of air quality offsets, incentives schemes, more public involvement, coordinated planning and better collaboration as a recipe for success in air quality management.
Keywords: Air quality, public perception, Richards Bay, South Africa
Introduction
Air pollution is a growing concern with an increasing number of acute air pollution events in many cities worldwide (WHO 2016). Both short and long-term exposure to air pollutants has been associated with health impacts with more severe respiratory impacts on the susceptible ill, children, the elderly, and poor people (Chiu 2013).
This is also the case in South Africa (DEA 2012) and by extension Richards Bay, where air quality has been a subject of discussion for some time due to previous pollution events in the area (Jaggernath 2013). With its known effect of aggravating lower respiratory tract infections, chronic obstructive pulmonary disease (COPD), ischemic heart disease (IHD), and cancers of the trachea and lung, air pollution is a concern for many people, particularly those living in and close to heavily industrialised areas (Jaggernath 2013).
To understand the extent of impact and to examine the question of environmental justice due to air pollution, whether inherent or implicit, it is crucial to obtain the views and gauge perceptions of the public.
This paper presents the results of a survey conducted in uMhlathuze Local Municipality, South Africa, and the surrounding areas. Respondents were asked whether they considered air quality to be good, bad, or fair and what impact it had on them. The respondents were also asked to suggest management actions that could enhance air quality.
Study rational
The knowledge of pollution perception and how best stakeholders can be adequately involved is essential to ensuring a progressive policy and in promoting environmental justice. This would support South Africa's imperative to protect public health as required in Section 24 of Chapter 2 of the Constitution of the RSA of 1996 which states that:
"Everyone has a right-(a) to an environment that is not harmful to their health or wellbeing: and (b) to have the environment protected, the benefit of present and future generations..."
Study area
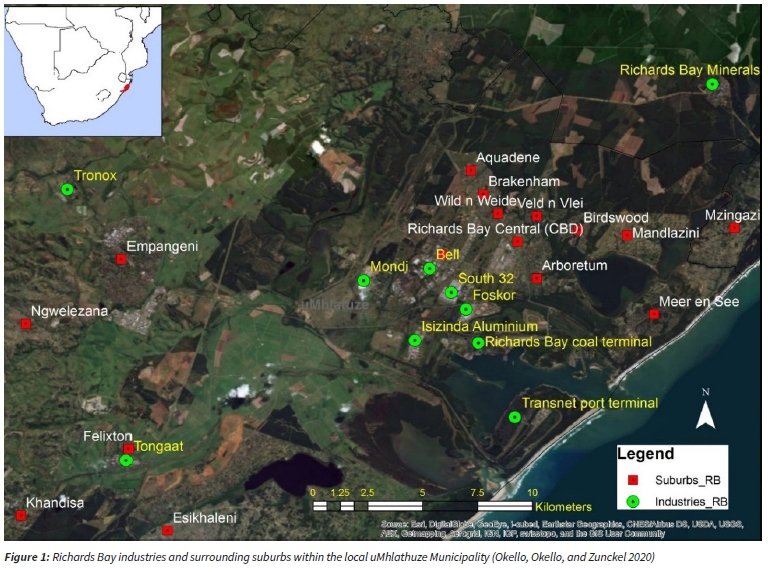
Richards Bay, located within the uMhlathuze Municipality, is a growing metropolitan with several industries in relative proximity to residential areas (Okello and Allan 2015). The town is an economic centre and one of the country's strategic commercial hubs designated as an 'Area of National Economic Significance' (uMhlathuze Municipality 2016). In addition to the largest coal export terminal in the world and the second-largest port in South Africa, Richards Bay hosts several commercial, light, and heavy industrial activities such as paper, fertiliser and sugar production. With the Central Business District (CBD) as the main centre, the surrounding suburbs include Esikhaleni, Empangeni, Arboretum, Felixton, Mtunzini, Veld n Vlei and Enseleni. Figure 1 shows the local uMhlathuze Municipality, its industries and surrounding suburbs.
As of 2016, the area had a population of 410 465 (Stats SA 2016) and covers an area of 1233.3 km2 (Cogta 2017).
An overview of air pollution in Richards Bay
The highlight in terms of air pollution was in 1994 when an emission incident at the Indian Ocean Fertilizers (now Foskor) led to the evacuation of the central business district and resulted in a fatality. This incident spurred public pressure and led to a petition and consequently the formation of the Richards Bay Clean Air Association (RBCAA), which was spearheaded by ordinary concerned residents (Okello and Allan 2015; Savides 2011).
The RBCAA has played a vital role in documenting the history of air quality in Richards Bay through monitoring and reporting. The most important history comprises data collected from its network of stations for over 20 years. This has enabled trends to be established; most recently in 2018 where ambient Particulate Matter (PM10) and Sulphur Dioxide (SO2) have shown a decreasing trend although not significant (Okello et al. 2018). Industry plays a significant role in the air quality makeup of the area: for example, a sharp decrease in SO2 post-2014 coincides with the closure of Bayside Aluminium and Tata steel (Okello et al. 2018).
Aside from the ambient concentration data, trends in complaints recorded by the RBCAA over the last two decades was critical in assessing the historical changes of air emissions. The association recorded a total of 3,638 complaints between the years 2000 to 2017, most of which were attributed to industries around the CBD (RBCAA 2018). The maximum number of complaints received in a single year was 397 in 2004, this reduced to approximately 200 between 2010 and 2015, and decreased gradually to 100 in 2017 (RBCAA 2018). The reducing trend of complaints can provide a view of pollution incidents over the years.
Legal and policy context of air pollution
The National Environmental Management: Air Quality Act (NEM: AQA) was partially enacted on September 9, 2005, and fully enacted on April 1, 2010. NEM: AQA repealed the Atmospheric Pollution Prevention Act (APPA) which had been enacted in 1965. Subsequently, the National Ambient Air Quality Standards (NAAQS) covering priority pollutants such as particulate matter, sulphur dioxide, nitrogen dioxide, carbon monoxide, lead, ozone and benzene were formalised on December 24, 2009. Similarly, Minimum Emission Standards (MES) for Listed Activities, i.e., significant industrial facilities, were developed and were first gazetted on March 31, 2010. These were then amended both in 2013 and 2015 and more recently in 2018 for selected activities. The influence of these policy instruments and their reduction of risks associated with air pollution is a subject that is slowly but receiving attention, and more studies on this subject are required.
Methodology
Overview of methodology / data collection
The study utilised Evasys online survey system to gather data. Evasys was selected because of its relative ease in formulating questions and disseminating surveys. Over recent decades, electronic surveys have become increasingly common due to the strong advantages of speedy distribution and response cycles (de Bernardo and Curtis 2013; Koitsalu et al. 2018; McMaster et al. 2017). The other benefit is that costs per response decrease significantly as sample size increases (Scott et al. 2011). Moreover, an online survey is dynamic and can provide statistical results on an immediate basis (Yun and Trumbo 2000).
Although the use of the internet is growing very rapidly, it is not universal (Phokeer et al. 2016). Many citizens still do not possess internet facilities, especially older people and those in lower-income and education groups. Therefore, online surveys may not fully reflect the views of the entire population, which poses a challenge in generalising results (de Bernardo and Curtis 2013). According to Statistics SA, about 61,8% of South African mostly in urban area households had at least one member who had access to or used the Internet either at home, work, place of study, or internet cafés (Stats SA 2018).
Further, respondents may dislike unsolicited e-mails or too many emails perceiving this as an invasion of their privacy and thus may decline to respond (de Bernardo and Curtis 2013; Marra and Bogue 2006).
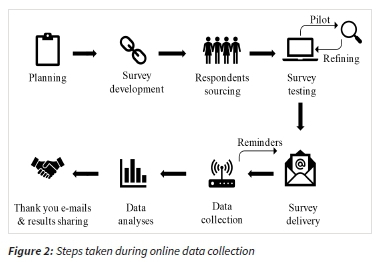
The eight critical steps taken from planning to survey delivery and, eventually, data collection to ensure that the survey process yielded the desired results are shown in Figure 2. These steps are described in detail in the following sections.
Planning (sample size determination, selection criteria) and respondents sourcing
Sample sizing in qualitative research is a matter involving judgment against the quality of information required, the sampling strategy and the research product intended (Sandelowski 2000). There is no 'magic number' (Neuman 2014). Nevertheless, the sample size was determined using equation 1 below adopted from the University Hospital Bristol (University Hospital Bristol 2018).

n is the sample size required
N is the whole target population in question
p is the average proportion of records expected to meet
the various criteria (1-p) is the average proportion of records not expected to meet the criteria
A is the margin of error deemed to be acceptable (calculated as a proportion), e.g., for 5% error, either way, A = 0.05
C is a mathematical constant defined by the Confidence Interval chosen, i.e. (confidence level). At 95% confidence level c = 1.96; at 90% c = 1.645; and at 80% c = 1.28
For this study, the following parameters were used:
N 410 465 population (Stats SA 2016)
p 70% expected incidence
A 0.05 accuracy
c 1.645 (90% confidence). The confidence level was chosen as opposed to 95% to cater to the uncertainty of sampling method (online survey) but also a high level of the population not represented in the sample due to age groups omitted.
Based on the above, the sample size (n) was determined to be 228. The survey was sent out to 325 individuals (higher than the calculated sample size). In general, the larger the sampling population, the smaller the bias that would normally come from a single group (Iarossi 2006).
The respondents were sourced using a combination of non-random purposive sampling and chain or snowball sampling approach (Neuman 2014; Patton 1990). In purposive sampling, the target sample population is selected based on some criteria and specific purpose in mind. For this research, a respondent had to be an adult of 18 years or older, current or previous resident of the uMhlathuze Local Municipality, and have an e-mail address to access the online survey. According to Neuman (2014), a researcher may use purposive non-random sampling in 3 cases which include: to select unique cases that are specifically informative, to select members of a difficult-to-reach population, and where the researcher wants to identify types of cases for in-depth investigation.
Chain sampling, on the other hand, is a multistage technique that begins with one or a few people or cases and spreads out based on links to the initial cases (Neuman 2014). Respondents were initially identified from neighbourhood and sports groups, databases of the RBCAA, and groups that had previously requested to be included in various environmental impact assessment studies within the local uMhlathuze Municipality. More respondents were then identified by the initial group who provided additional contacts and spread the request to be involved, a method referred to as snowballing (Neuman 2014).
Precautions to improve response rate and quality of results
As part of survey preparation, ethics approval was obtained from the University of Free State Faculty of Agricultural and Natural Sciences. Besides protecting the respondents and the researcher, ethical review demonstrates adherence to accepted ethical standards of a good research study. This has been shown to increase recruitment potential (Newson and Lipworth 2015).
Care was taken to assure the respondents of anonymity and confidentiality of their responses. The number of questions was minimised, and their complexity reduced to simplify the response. According to Iarossi (2006), sensible questions and sensitivity in administering surveys improved the quality of results dramatically.
Also, an estimate of the time to complete the survey was provided to prepare respondents and avoid any premature opt-outs. To prevent multiple responses on one survey link, the survey was set up to be used only once. As such, a new survey had to be sent to a new respondent.
The questions in the survey were both closed and open-ended to maximise on comments from the respondents.
Pre-testing and calibration of the survey instrument (pilot survey)
The online survey instrument was first checked for internal coherency, proper wording, proper answer sets, and logistical clarity and duration of the survey.
A small group of respondents was selected and asked to test the survey. Comments received from the group related to spelling and grammatical errors, difficulty in understanding some questions, and suggestions on additional questions that could add value to the survey. These comments were incorporated into the survey to improve it before it was distributed to respondents.
Survey delivery and data collection of results
Survey invitations containing the survey link was sent to selected respondents via e-mail. An introduction explaining the purpose of the survey and confidentiality preceded the questions. A period of one month was given for response collection.
Responses were then monitored for two weeks, after which a first survey reminder was sent to the respondents. To increase the response rate, a second survey reminder was sent a week later. The second reminder was sent only to respondents who had not completed the survey as determined by the Evasys online survey system.
The responses downloaded from the Evasys survey system was checked to determine their validity after which analysis was done. The response rate was calculated using equation 2 below:

Rr is Rate of response
R i s the number of the actual responding population
n is the number of the sampled population
As a qualitative study which deals more with people's perceptions and behaviour as opposed to quantities, descriptive analysis was used to examine the results. (Ashley, Boyd, and Boyd 2006; Neuman 2014).
Results and discussion
In this section, the respondent's characteristics and their perception of the status of air quality, the sources ofpollution and impacts thereof as well as involvement in decision making are examined. Importantly, the suggestions and recommendations for improving air quality management are also presented and discussed.
Respondents characteristics
Two hundred fifteen respondents (215) out of 325 who were sampled completed the questionnaire. This represented 13 respondents less than the determined sample size considered adequate to generalise the results. However, this equates to a response rate of 66.2%, which is very high for a survey (de Bernardo and Curtis 2013; Marra and Bogue 2006). The respondents comprised 64% male and 36% female. All respondents were above 18 years, with the majority older than 30. Respondents were drawn from different occupations and sectors of the Richards Bay economy, with close to 65% from the private sector.
Spatially, the respondents were distributed throughout the uMhlathuze Local Municipality with the majority coming from Merensee (35.3%), Arboretum (15.3%), Birdswood (6.5%), Veld n vlei (5.1%), Empangeni (7.4%), Esikhaleni (4.7%) and Brakenham (4.7%) constituting the majority.
Public perceptions of air quality status in uMhlathuze Local Municipality
Most of the respondents ranked air quality in uMhlathuze Local Municipality and surrounding as either fair (40%) and poor (just over 30%) (Figure 3). Thirty percent of the respondents thought that the air quality was either good or very good (Figure 3).
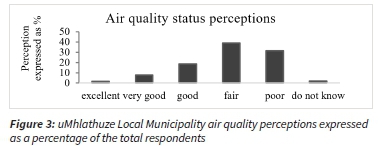
When asked if they considered air pollution as a problem within the Local Municipality, close to 80% agreed, of which 30% strongly agreed. The main manifestation of pollution was reported as dust deposit and smell in residential areas close to industrial sources such as Arboretum and CBD. These results mirror the trends of PM10 and SO2 where areas such as the CBD, Arboretum, Brakenham, and areas around the Richards Bay Harbour were deemed to be most impacted by air pollution (Okello et al., 2018).
Sources of pollution and impacts thereof
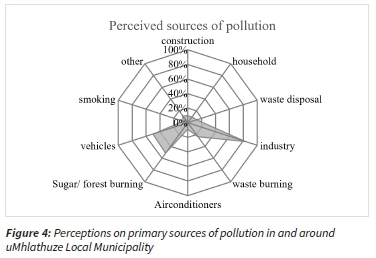
When asked about their perceived top three air pollution sources in the area, over 80% of the respondents pointed to the industry as their number one source. This was followed by the burning of forests and sugarcane (51% of respondents). Motor vehicle emissions were selected as the third biggest cause of pollution (Figure 4).
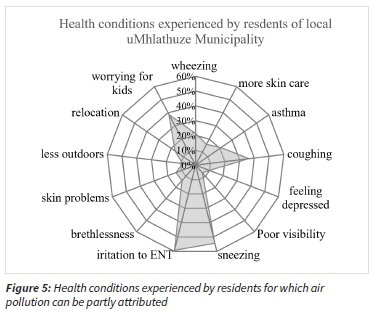
Regarding the actual impacts of air quality, seventy percent (70%) of the respondents indicated that they were impacted negatively in one way or another by pollution. Twenty percent (20%) did not know whether pollution had any effects on them or not, potentially indicating a resigned or just an unaware part of the population. The impact was only a little to about 50% of the respondents impacted, while 15% were strongly impacted. The specific impact that was felt by most respondents (close to 60%) was the irritation of the eyes, nose, and throat (ENT). Respondents also highlighted sneezing (55%) coughing (36%), wheezing, and asthma incidents (20% each). About 48% of the respondents indicated that they worried about their children (Figure 5).
These results are similar to those of a previous study in Richards Bay (Jaggernath 2013). Other impacts identified included nuisance dust or ash, which often resulted in increased cost of clean-up of swimming pools, cars, and household items including clothes. It was indicated that the effects occurred mostly during the evening, the night and morning hours. Often, the economic cost of clean-up of pollution is not quantified but is vital in determining the real pollution effects to those impacted (Stoerk 2018).
Concerns over frequent wind-blown coal dust and odorous emission that cause the burning of eyes and irritation of the throat were reported in the Arboretum and Alton areas. Suburbs such as Merensee were less polluted due to their distance away from industrial sources and probably due to the shielding effect of wind blowing from the sea. More so, several respondents indicated that they have on several occasions, had to visit the hospital due to breathing difficulty. Some pointed out that they had more respiratory issues during their stay in Richards Bay, compared to previous less polluted areas.
Public participation in air quality management
A set of questions was aimed to ascertain the level of knowledge and extent of participation in air quality-related matters, including management thereof.
Knowledge of legislation, particularly by impacted parties, is important in ensuring effective policy implementation (Craig et al., 2008). When asked whether they understood the legal requirements for air quality management in terms of the National Environmental Management Air Quality Act, over 60% of the respondents indicated that their knowledge of legislation (pollution control framework) was either good or very good although 30% did not know or had little knowledge of the legal framework. A respondent contended that while the relevant air quality guidelines and laws are useful, enforcement is weak, and no meaningful action is taken when offences are identified.
Regarding knowledge of where to channel their complaints, 73% of respondents indicated that they knew they could complain about bad or poor air quality through the uMhlathuze Local Municipality or through the RBCAA, which they said was instrumental in monitoring pollution levels in the area.
Over 50% of the respondents disagreed with the notion that pollution was out of their control and that they cannot do anything about it. Twenty-three percent of the respondents strongly disagreed that they were powerless. This indicates a society willing to engage. Over 90% of respondents believed that they would act in one way or another if they knew how best to contribute to cleaner air and that improving the environment is the responsibility of all citizens.
This thread of public knowledge, particularly in highly polluted areas, is somehow common, probably due to the felt impact.
Interestingly, over 75% of the respondents either agreed or strongly agreed that the government should do more to promote and encourage a better environment, even if taxes go up slightly. The 25% who strongly disagreed that their taxes should not be increased indicated that the government had more than enough resources.
Practical suggestions/ options for improving air quality management and policy
During the survey, respondents were asked to state their opinion on how air quality management could be improved. The improvement options have been grouped into eight main categories that include:
1. Air quality monitoring;
2. Law enforcement, consequence management;
3. Technology and research development;
4. Air quality offsets and incentives schemes;
5. Environmental taxes;
6. Improvement in public transport;
7. Public participation; and
8. Coordinated planning and collaboration.
Air quality monitoring
Data from continuous monitoring of air pollution is one of the most essential parameters in ascertaining the efficacy of policy intervention. This enhances the implementation and enforcement of environmental (Jin, Andersson, and Zhang 2016)). To store data and make it available for use, a single data repository system similar or same as the RBCAA or the South African Air Quality Information System (SAAQIS) was suggested. About 10% of respondents indicated that independent air quality monitoring by organisations such as the RBCAA plays a critical role in data provision, publishing complaints, their sources, and resolution.
Also, it was recommended that both human and technical capacity at the local uMhlathuze Municipality and RBCAA should be supported with funding and enhanced to accelerate and expand monitoring.
The local uMhlathuze Municipality was commended for ambient air quality monitoring but urged to share data and extend monitoring to other forms of pollution nuisance pollution such as public smoking in restricted areas, smoking vehicles, and agricultural burning (sugar and forestry).
Law enforcement and consequence management
Law enforcement and monitoring of compliance with standards and legislation featured prominently on the responses. Broadly, a well-managed, visible, and frequent enforcement regime is crucial to ensuring success in policy implementation (Craig et al. 2008; Stoerk 2018). In Taiwan, for example, an inspection and enforcement program expanded to cover more than 10,000 factories resulted in significant emission reduction (Shu-Hwei Fang and Hsiung-Wen Chen 1996).
Stringent penalties should be applied with caution to polluters as a way of enforcing the legal requirement. Examples of penalties provided from the survey included: directives to immediately remedy pollution, appropriate fines where negligence is determined, and at the worst withdrawal of license to operate and prosecution.
These measures have been applied elsewhere (Bondy, Roth, and Sager 2020; Kondrat 2000) and are provided for in the legal framework of South Africa. For example, Section 28 of the National Environmental Act (Act 107 of 1998) (NEMA) (Republic of South Africa, 1998) bestows on the polluter the duty to take reasonable measures to prevent significant pollution or degradation of the environment from occurring continuing or recurring (Xiaobo and Jianwei 2015). While legislation is considered adequate for industrial pollution control, the burning of sugarcane is not regulated in terms of the NEM: AQA.
Nevertheless, the Provincial Department of Environmental Affairs (DEA) has developed guidelines for the burning of sugarcane in KwaZulu-Natal (uMoya-NILU 2014). According to uMoya-NILU (2014), within this guideline document is the Sustainable Sugarcane Farm Management System (SuSFarMS), a voluntary self-audit tool aimed at municipalities and sugarcane farms to minimise the air pollution impacts of sugar cane burning. These guidelines should perhaps be legalised.
Technology and research development
Prevention of pollution from the source was far much desired than remedying the effects. Comments were made for industries to embrace new technology in pollution prevention, monitoring, detecting pollution leak sources and predicting potential failure of equipment. A wide range of air pollution control devices can be used to reduced air pollution and in turn, prevent their adverse effects on the environment and human health (Kalender 2019).
Additionally, inadequate and non-timeous maintenance was cited as a cause of low equipment reliability, availability, and unnecessary failures with possible pollution effects.
It is worth noting that post-2010, it was a mandatory requirement in most of the industrial Air Emission Licences (AEL) to undertake point source emissions measurements either continuously or periodically. This alongside the requirement to have leakage detection on pollution prevention equipment is good practice in reducing potential sources of pollution.
More so, it was recommended that technology sourced should consider appropriate waste disposal mechanisms commensurate to local legislative requirements. This is in order not to create another environmental problem.
Air quality offsets and incentives schemes
Respondents in the survey encouraged industries to show active investment to offset their contribution to any form of pollution and to meet and exceed the regulated standard. Relatively inexpensive and easy to implement methods such as planting trees around factory premises to reduce wind-blown dust was suggested. Offsets have been used to encourage 'good deeds' where abatement to the desired standard is a challenge to achieve (Langerman et al., 2018). This has been the case in South Africa where the air quality offsets guidelines in terms of the NEMA: AQA (DEA, 2016b) gives credence to offsets. The guidelines define offsets as:
"An intervention, or interventions, specifically implemented to counterbalance the adverse and residual environmental impact of atmospheric emissions to deliver a net ambient air quality benefit within, but not limited to, the affected airshed where ambient air quality standards are being or have the potential to be exceeded and whereby opportunities and need for offsetting exist"
Examples include investments in switching households to cleaner energy sources, low emission appliances, and insulation; reducing domestic waste burning and emissions from landfills (ESKOM, 2016). In this context, offsets can be used to deliver a positive net improvement in air quality (Langerman et al., 2018). While this may be an opportunity for improvement, care should be taken to ensure that abatement precedes the offsetting of pollution.
Regarding incentives, to encourage companies to perform better and to recognise cleaner practice, it was suggested that an incentive scheme for good air quality should be established for the region. This can include air quality awards, best abatement practice engineering prize, best air quality initiative award, etc. This would not only encourage the sharing of good practice but would also promote awareness and focus on investment to tackle adverse emissions and promote the implementation of new technology by industry (Di Falco 2012; Gerhardt 2006; Levin 1990).
Environmental Taxes
Application of environmental taxes for pollution prevention is a way to internalise pollution costs, thus shifting the burden to the pollutant and reducing the cost to society (Di Falco 2012). In South Africa, industries pay a prescribed fee for their Air Emission Licences (AEL) as required in terms of the NEMA: Air Quality Act (Act No39 of 2004). However, this is paid once-off during application and renewal after five years and thus does not constitute a pollution tax. Nevertheless, the fuel levy and the proposed carbon tax aimed at reducing carbon footprint are examples (Alton et al. 2014; National Treasury 2018). These, in time, might and should probably be considered among other remedies to reduce priority pollutants such as SO2, NO2 and PM. This sort of taxation will require an improved and stringent monitoring accuracy and should be balanced not to be an economic growth burden (Chen and Liu 2009; Di Falco 2012).
Improvement in public transport
Vehicular emission within the uMhlathuze Local Municipality cannot be ignored and is considered the third-largest source of emissions by the residents. This will become even more pronounced given the projected industrial as well as population growth. In just over five years between 2011 and 2016, the population increased by over 22% ((uMhlathuze Municipality 2018). To this end, suggestions were made to design a public transport system that encourages commuters to use public transport rather than private vehicles. A good example is to integrate safe bicycle routes to encourage cycling. A study determined that by cycling, one would gain 3-14 months of life compared to the risk dying from road traffic accidents (5-9 days lost) and exposure to pollutants (0.8-40 days lost) (de Hartog et al., 2010; Rojas-Rueda et al., 2011). In Stockholm, Sweden, cycling saves 449 years of life annually by reducing vehicle emission and thereby limiting population exposure (Almström et al., 2017).
In addition to enhancing the design of public transport, it was also suggested that more vigorous enforcement against unroadworthy vehicles and compromised older vehicles would improve ambient air quality.
Public participation
To improve air quality management, it was suggested that more public awareness of the effects of pollution and how to identify pollution was necessary. This is obvious (Bdour et al., 2008; Chompunth, 2013) and should also include awareness on the impacts of household and outdoor air pollution particularly in the low-income areas. A suggestion was made to have a section on print media where an indication of the air quality status and details of people to contact can be published. In this section, it was also suggested that complaints and resolutions thereof could also be published.
On this, the public was encouraged to complain whenever they experienced air pollution events or whenever they saw it. The government, on the other hand, should have a portal/ application where air quality complaints can be lodged. These complaints should be followed up with prompt feedback to encourage more public participation. The RBCAA has shown that proper complaints handling system works and encourages more public participation (Okello and Allan 2015). Transparency in terms of emission data provision, accountability for pollution sources, and collaboration between different role players are cited as pillars for success and promotion of justice (Li et al. 2018).
Being a process that facilitates decision making, the public was encouraged to take part in the Environmental Impact Assessment of new projects and specifically ask about air quality impacts. Comments made during the environmental authorization processes in other jurisdictions have been shown to provide desired emission reduction by incorporating and improving monitoring requirements and ensuring that pollution abatement is in place (Chompunth, 2013; Jin et al., 2016). Relevant officials of the local and district municipalities were encouraged to continue taking part in, and comment on environmental authorisation applications as the municipality plays a key role in planning development.
Coordinated planning and collaboration
Town planning considerations can mitigate air quality impacts on people and the environment (Zhou, Li, and Wang 2018). It was suggested that as much as possible, industries and residential areas should be separated. This would limit exposure. Another measure suggested was to limit approvals of industries with high potential for air pollution. This should be implemented if it is determined that air quality has reached health thresholds in terms of national ambient air standards and specifically where a proposed industry does not have or show adequate pollution prevention measures.
On collaboration, it was suggested that the government should consider working with the well-established NGO associations such as RBCAA to conduct ambient air quality monitoring. The RBCAA works on a polluter pays model with the involvement of industry and other stakeholders. The forum would be an already available channel for the law enforcer to work hand in hand with the industrial sources of pollution for the benefit of all and the improvement of the affected airshed. Potential areas of collaboration may include offering financial support to cater for the cost of monitoring or joint monitoring and database and information management. This would save not only money but also time and will ensure efficient use of personnel and resources.
Conclusion and recommendations
The results of the survey indicate a concern over air quality. Although progress has been made in reducing pollution, much is still required to achieve the desired state of protection contemplated in Section 24 of the RSA constitution.
Most of the public perceive the air quality as fair or poor. The fair rating is likely to be as a result of a downward trend in pollution, particularly PM10 and SO2 (Okello et al., 2018). Nonetheless, widespread sporadic pollution events over the airshed continue to occur. Residential areas closer to main pollution sources such as CBD and Arboretum seem to experience more pollution effects.
The leading cause of pollution impacting the area residents was industrial sources followed by agricultural (sugar cane and agrarian burning) and then general waste burning. These results are similar to previous studies and reports in the area (Jaggernath 2013; uMoya-NILU 2014) and point out to where the focus should be if further pollution reduction is to be achieved.
Perhaps because of the exposure to pollution, and probably awareness campaigns, one would say the public appear to be very knowledgeable of air quality issues and particularly the air quality legislation. This knowledge may be a result of most of the population sampled being educated. A survey of the more rural, less formal sectors of the population may reveal a different result.
Nonetheless, the myriad of views expressed by the public in uMhlathuze Local Municipality regarding possible improvement is an important step in providing input to air quality management in the Municipality, in South Africa and other countries facing similar challenges. More specifically, an improvement in air quality monitoring, consequence management, use of environmental taxes, appropriate technology, and the public transport system is key for air quality management. More so, the introduction of air quality offsets and incentive scheme would encourage good practice. The public wants to be involved and have cited coordinated planning with better collaboration as a recipe for success in air quality management.
In terms of future research, a similar survey of the perceptions of the population living in more rural areas and could be conducted. This could be expanded to the whole country given that an online survey is relatively easy to distribute. Lastly, health impacts studies are key to test the reliability of implemented intervention and could form future research areas.
Acknowledgement
We would like to thank the residents of the City of uMhlathuze for taking the time to respond to the survey and expressing their opinion on how air quality management in the area could be improved. Your responses form the fabric of this paper. We would also like to thank the Richards Bay Clean Air Association, particularly Sandy Camminga, for sharing the RBCAA's database for the survey distribution. This database greatly enhanced the response received.
References
Alton, Theresa, Channing Arndt, Rob Davies, Faaiqa Hartley, Konstantin Makrelov, James Thurlow, and Dumebi Ubogu. 2014. "Introducing Carbon Taxes in South Africa." Applied Energy 116:344-54. [ Links ]
Amegah, A. Kofi and Samuel Agyei-Mensah. 2017. "Urban Air Pollution in Sub-Saharan Africa: Time for Action." Environmental Pollution 220. [ Links ]
Ashley, Peter, William E. Boyd, and Bill Boyd. 2006. "Quantitative and Qualitative Approaches to Research in Environmental Management." Australasian Journal of Environmental Management 13(2):70-78. [ Links ]
de Bernardo, Dana Huyser and Anna Curtis. 2013. "Using Online and Paper Surveys: The Effectiveness of Mixed-Mode Methodology for Populations Over 50." Research on Aging 35(2):220-40. [ Links ]
Bondy, Malvina, Sefi Roth, and Lutz Sager. 2020. "Crime Is in the Air: The Contemporaneous Relationship between Air Pollution and Crime." Journal of the Association of Environmental and Resource Economists 7(3):555-85. [ Links ]
Chen, Hsiao-Chi and Shi-Miin Liu. 2009. "An Emission Tax Pollution Control System with Imperfect Monitoring." Environmental Economics and Policy Studies 10(1):21-40. [ Links ]
Chiu, Hui-Fen. 2013. "Short-Term Effects of Fine Particulate Air Pollution on Ischemic Heart Disease Hospitalizations in Taipei: A Case-Crossover Study." Aerosol and Air Quality Research 10:1563-69. [ Links ]
Cogta. 2017. "KZN Administrative Boundaries." (Ref:KZN 8.1):31. Craig, Lorraine, Dan Krewski, Jonathan Samet, John Shortreed, Leendert van Bree, and Alan J. Krupnick. 2008. "International Perspectives on Air Quality: Risk Management Principles for Policy Development - Conference Statement." Journal of Toxicology and Environmental Health, Part A 71(1):4-8. [ Links ]
DEA. 2012. 2nd South Africa Environment Outlook. A Report on the State of the Environment. [ Links ]
Di Falco, Salvatore. 2012. "Economic Incentives for Pollution Control in Developing Countries: What Can We Learn from the Empirical Literature?" Pagri 1(2):7-24. [ Links ]
Gerhardt, Paul H. 2006. "Incentives to Air Pollution Control." Law and Contemporary Problems 33(2):358. [ Links ]
Guerreiro, Cristina, Valentin Foltescu, and Frank deLeeuw. 2014. "Air Quality Status and Trends in Europe." Atmospheric Environment 98:376-84. [ Links ]
Larossi, Giuseppe. 2006. The Power of Survey Design: A User's Guide for Managing Surveys, Interpreting Results, and Influencing Respondents. World Bank, Washington DC. [ Links ]
Jaggernath, Jyotikumarie. 2013. "A Socio-Economic and Spatial Investigation into the Health Implications of Air Pollution in Richards Bay, Kwazulu-Natal, South Africa." University of KwaZulu-Natal. [ Links ]
Jin, Yana, Henrik Andersson, and Shiqiu Zhang. 2016. "Air Pollution Control Policies in China: A Retrospective and Prospects." International Journal of Environmental Research and Public Health 13(12). [ Links ]
Kalender, Saliha Saadet. 2019. "Air Pollution Prevention Technologies." Pp. 2871-88 in Handbook of Environmental Materials Management, edited by C. M. Hussain. Cham: Springer International Publishing. [ Links ]
Koitsalu, Marie, Martin Eklund, Jan Adolfsson, Henrik Grönberg, and Yvonne Brandberg. 2018. "Effects of Pre-Notification, Invitation Length, Questionnaire Length and Reminder on Participation Rate: A Quasi-Randomised Controlled Trial." BMC Medical Research Methodology 18(1):3. [ Links ]
Kondrat, Robert. 2000. "Punishing and Preventing Pollution in Japan: Is American-Style Criminal Enforcement the Solution?" Pacific Rim Law & Policy Journal 9(2):380-414. [ Links ]
Langerman, K. E., C. J. Pauw, H. J. Smith, and S. J. Piketh. 2018. "Moving Households to Cleaner Energy through Air Quality Offsets" Pp. 1-8 in 2018 International Conference on the Domestic Use of Energy (DUE). [ Links ]
Levin, Michael H. 1990. "Implementing Pollution Prevention: Incentives and Irrationalities." Journal of the Air and Waste Management Association 40(9):1227-31. [ Links ]
Li, Victor OK, Yang Han, Jacqueline CK Lam, Yixuan Zhu, and John Bacon-Shone. 2018. "Air Pollution and Environmental Injustice: Are the Socially Deprived Exposed to More PM25 Pollution in Hong Kong?" Environmental Science and Policy 80(October 2017):53-61. [ Links ]
Marra, Rm and Barbara Bogue. 2006. "A Critical Assessment of Online Survey Tools" Proceedings of the 2006 WEPAN Conference 1-11. [ Links ]
McMaster, Hope Seib, Cynthia A. LeardMann, Steven Speigle, Don A. Dillman, Valerie Stander, Jackie Pflieger, Carlos Carballo, Teresa Powell, Kelly Woodall, Evelyn Sun, Lauren Bauer, William Lee, Nida Corry, Christianna Williams, John Fairbank, Robert Murphy, Ernestine Briggs-King, Ellen Gerrity, and Robert Lee. 2017. "An Experimental Comparison of Web-Push vs. Paper-Only Survey Procedures for Conducting an in-Depth Health Survey of Military Spouses." BMC Medical Research Methodology 17(1):1-9. [ Links ]
National Treasury. 2018. Carbon Tax Bill 2018. [ Links ]
Neuman, Lawrence. 2014. Social Research Methods: Qualitative and Quantitative Approaches. Vol. 30. 7th ed. Pearson Education Limited. [ Links ]
Newson, Ainsley J. and Wendy Lipworth. 2015. "Why Should Ethics Approval Be Required Prior to Publication of Health Promotion Research?" Health Promotion Journal of Australia 26(3):170-75. [ Links ]
Okello, Nick and Candice Allan. 2015. "The Richards Bay Clean Air Association: A Case Study for Success in Participatory Air Quality Management." Clean Air Journal 25(1):34-39. [ Links ]
Okello, Nick, Sandy Camminga, Tom Okello, and Mark Zunckel. 2018. "Spatial and Temporal Trends of PM10 and SO2 in The." Clean Air Journal 28(2):80-89. [ Links ]
Okello, Nick, Tom Okello, and Mark Zunckel. 2020. "Changes in Health Risk Associated with Air Pollution and Policy Response Effectiveness, Richards Bay, South Africa. (in Review)." Clean Air Journal. [ Links ]
Patton, Michael Quinn. 1990. "Qualitative Evaluation and Research Methods" Qualitative Evaluation and Research Methods 169-86. [ Links ]
Phokeer, Amreesh, Melissa Densmore, David Johnson, and Nick Feamster. 2016. "A First Look at Mobile Internet Use in Township Communities in South Africa." Proceedings of the 7th Annual Symposium on Computing for Development, ACM DEV-7 2016. RBCAA. 2018. Annual Air Quality Report - 2018. Richards Bay. [ Links ]
Sandelowski, Margarete. 2000. "Whatever Happened to Qualitative Description?" Research in Nursing & Health. [ Links ]
Savides, Dave. 2011. "Celebrating 14 Years of Monitoring Air Quality and Supporting Responsible Industrial Development." Zululand Observer, May 27, 4. [ Links ]
Scott, Anthony, Sung Hee Jeon, Catherine M. Joyce, John S. Humphreys, Guyonne Kalb, Julia Witt, and Anne Leahy. 2011. "A Randomised Trial and Economic Evaluation of the Effect of Response Mode on Response Rate, Response Bias and Item Non-Response in a Survey of Doctors." BMC Medical Research Methodology 11. [ Links ]
Shu-Hwei Fang and Hsiung-Wen Chen. 1996. "Air Quality and Pollution Control in Taiwan." Atmospheric Environment 30(5):735-41. [ Links ]
Stats SA. 2016. Community Survey 2016. [ Links ]
Stats SA. 2018. General Household Survey 2017. [ Links ]
Stoerk, Thomas. 2018. "Effectiveness and Cost of Air Pollution Control in China." 5717(273). [ Links ]
uMhlathuze Municipality. 2016. "UMhlathuze Municipality Annual Report 2015-2016. [ Links ]"
uMhlathuze Municipality. 2018. Integrated Development Plan. [ Links ]
uMoya-NILU. 2014. "Air Quality Management Plan for the UThungulu District Municipality: Output B:Status Quo Assessment of Air Quality in the UThungulu District Municipality, Report No. UMN028-2013. [ Links ]"
University Hospital Bristol. 2018. "UHB-NHS Foundation Trust, Sample Size Calculator." Retrieved July 1, 2018 (http://www.uhbristol.nhs.uk/about-us/who-we-are/). [ Links ]
WHO. 2016. "Ambient Air Pollution: A Global Assessment of Exposure and Burden of Disease." World Health Organization 1-131. [ Links ]
Xiaobo, Zhao and Zhang Jianwei. 2015. "Environmental Liability." Research Handbook on Chinese Environmental Law 1998:320-41. [ Links ]
Yun, Gi Woong and Craig W. Trumbo. 2000. "Comparative Response to a Survey Executed by Post, e-Mail, & Web Form." Journal of Computer-Mediated Communication 6(1):0. [ Links ]
Zhou, Chunshan, Shijie Li, and Shaojian Wang. 2018. "Examining the Impacts of Urban Form on Air Pollution in Developing Countries: A Case Study of China's Megacities." International Journal of Environmental Research and Public Health 15(8). [ Links ]
Received: 28 February 2020
Reviewed: 8 April 2020
Accepted: 2 June 2020

