


Services on Demand
Article
 English (pdf)
 Article in xml format
 Article references
Indicators

Related links
-
 Cited by Google
 -
 Similars in Google
Share

 Permalink
Clean Air Journal
On-line version ISSN 2410-972X
Print version ISSN 1017-1703
Clean Air J. vol.30 n.1 Pretoria 2020
http://dx.doi.org/10.17159/caj/2020/30/1.8012
RESEARCH ARTICLE
Changes in health risk associated with air pollution and policy response effectiveness, Richards Bay, South Africa
Nick O. OkelloI; Tom W. OkelloI; Mark ZunckelII
IUniversity of Free State, Private Bag X13, Kestell Rd, Phuthaditjhaba, 9866, Free State, South Africa, 2017515335@ufs4life.ac.za and OkelloTW@ufs.ac.za
IIuMoya-NILU Consulting, Durban, KwaZulu-Natal, South Africa, mark@umoya-nilu.co.za
ABSTRACT
Research shows that more than 5.5 million people die prematurely every year due to household and outdoor air pollution placing it as the fourth highest-ranking risk factor for mortality globally. In South Africa, air pollution is a key concern in urban areas with high population density, but also in rurl areas where electricity is not the main source of energy. Approximately 10% of total mortalities in 2015 were attributed to respiratory diseases. With this, pollution policy intervention, both national and international, has become not only a necessary but a vital tool for the protection of air quality. The National Ambient Air Quality Standards and Minimum Emission Standards were introduced in 2009 and 2012, respectively. To ascertain the effectiveness of these interventions, this study used the case of Richards Bay, a highly industrialised town, to determine changes in health risk associated with air quality pollution exposure. Twenty years' data of air pollution-related mortality causes between 1997 and 2016 were analysed to determine the changes in trends, ranking and the Years of Life Lost as a result of pollution exposure. Results indicate a slight improvement in air quality and related health benefits. There was a 24% decrease in the Years of Life Lost due to air quality-related diseases post 2009. Cases of cerebrovascular diseases, which is the main cause of pollution-related mortality, remains an issue that requires continuous attention. The study concludes that air quality policy and its implementation is working to a reasonable extent. However, the increase in mortality due to certain disease cases such as bronchus and lung cancer could signify that the pollution control efforts need to continue and be enhanced. The increase in acute lower respiratory infections, which adversely affects children, is also of concern.
Keywords: Air pollution health effects, pollution management, air quality policy, Richards Bay, South Africa
Introduction
Lung and bronchus cancer, asthma, acute lower respiratory infections (ALRI), ischemic heart diseases (IHD), cerebrovascular diseases (CEV) and chronic obstructive pulmonary disease (COPD) are disorders that have been widely associated with air pollution and mortalities as a result (Ghanbari Ghozikali et al., 2016; Lelieveldwt al., 2015; WHO, 2016). Research shows that more than 5.5 million people die prematurely every year due to household and outdoor air pollution, placing air pollution as the fourth highest-ranking risk factor for death globally (Brauer et al., 2015; Forouzanfar et al., 2015). It is estimated that approximately 85% of the world's population lives in areas where the World Health Organization (WHO) air quality guidelines are exceeded (Brauer et al., 2015).
In South Africa, where approximately 10% of total mortalities in 2015 is attributed to respiratory diseases (Stats SA, 2016), air pollution is a key concern. This is intensified in urban areas with high population density, extensive industrial set up and traffic; but also, in rural areas where electricity is not the main source of energy (Bradshaw et al., 2003; Langerman et al., 2018; Norman et al., 2007). High ambient sulphur dioxide (SO2), nitrogen dioxide (NO2) and fine particulate matter (PM10) concentrations are common in many areas, primarily due to fossil fuel burning (Scorgie, 2012).
The Richards Bay area, which is the focus of this study, is faced with similar air quality pollution challenges (Okello et al., 2018).
Study aim
The study aimed to determine if air pollution policy interventions have been effective in reducing air pollution levels and thereby improving health. This was achieved by analysing changes in health risk (mortalities) associated with air quality pollution exposure in Richards Bay for twenty years between 1997 and 2016. The study analysed significance in trends of mortalities, Years of Life Lost (YLL) and changes in the ranking of mortality causes before and after the introduction of National Ambient Air Quality Standard (NAAQS) and Minimum Emission Standards (MES) for industrial facilities. NAAQS and MES were introduced in 2009 and 2012 respectively. Also analysed were the perceptions and number of air quality-related complaints recorded through the Richards Bay Clean Air Association (RBCAA) complaints handling mechanism.
This study supports South Africa's desire for development that protects public health through health-based air quality standards as envisioned in Chapter 2, Section 24 of The Constitution of the RSA of 1996 which states that:
"Everyone has the right- (a) to an environment that is not harmful to their health or well-being; and (b) to have the environment protected, for the benefit of present and future generations..."
Study area and air quality concerns
Richards Bay, a growing metropolitan, has several industries close to residential areas (Okello & Allan, 2015). The town, located in the local uMhlathuze Municipality, which is part of the wider King Cetshwayo District Municipality (KCDM), is a major industrial hub of the KwaZulu-Natal (KZN) Province of South Africa. It is one of the country's strategic economic zones designated as an 'Area of National Economic Significance' (uMhlathuze Municipality, 2018). It hosts the largest coal export terminal in the world and the second-largest port in South Africa. Additionally, there are several commercial, light and heavy industrial activities such as paper, fertilizer, sugar production and heavy mineral mines. Sugarcane and forestry burning, pesticide usage and dust associated with agricultural processes is common, especially during harvesting time (Jaggernath, 2013). These can be considered to jointly contribute to air quality concerns in the Municipality and surrounding areas (Jaggernath, 2013; Okello et al., 2018). The surrounding urban areas include the town of Empangeni, Felixton, Mtunzini and Enseleni. Figure 1 shows the location of the local uMhlathuze Municipality and the suburbs relative to major industries.
In terms of exposure, the year 1994 triggered major air pollution concerns in Richards Bay (Savides, 2011). During this time, an emission incident at the fertilizer manufacturing company, Foskor, forced the evacuation of the central business district and resulted in a fatality and multiple cases of hospitalization. This incident resulted in a public petition that subsequently led to the formation of the RBCAA (Okello & Allan, 2015; Savides, 2011). Before this incident, air emissions had been a concern, with minimal research conducted, recorded or published.
Through its network of air quality stations, the RBCAA has documented ambient air quality data collected over 20 years. This has enabled pollution trends and the significance thereof to be established (Okello et al., 2018).
Legislation and policy instruments for air emissions reduction
Several studies have qualified air quality legislation, limits and thresholds as essential to effective air quality management (Amegah & Agyei-Mensah, 2017; Turnock et al., 2016). These, if well implemented and complied with, serve to indicate what levels of exposure to pollution are generally safe for most people of all age groups over their lifetime (Yamineva & Romppanen, 2017). The WHO global emission standards have been used extensively to evaluate ambient and indoor air pollution levels (WHO, 2005).
In South Africa, policy and legal frameworks for protecting air quality exist (DEA, 2009). The Atmospheric Pollution Prevention Act (APPA) was enacted in 1965 and was repealed on April 1, 2010, with the National Environmental Management: Air Quality Act (NEM: AQA) which was partially enacted on September 9, 2005, and fully enacted on April 1, 2010. Additionally, to protect human health and the integrity of the environment, the NAAQS covering priority pollutants including particulate matter, sulphur dioxide, nitrogen dioxide, carbon monoxide, lead, ozone and benzene were formalized on December 24, 2009 (Table 1). Similarly, MES were developed and formally introduced on November 22, 2012, for Listed Activities, i.e., significant industrial facilities. These were amended in 2015, and more recently in 2018 and 2019 for selected activities.
Until now, the influence of NAAQS and MES as air quality control policy instruments in South Africa has not been widely studied. The answer to whether these instruments have been adequate, or whether their implementation is producing the desired effect is important to shape policy. The few studies undertaken have indicated improvement with benefits to human health (Keen & Altieri, 2016). Tshehla and Wright (2019a) concluded that several legislative strategic objectives of the National Air Quality Act are yet to be met. Richards Bay presents an ideal case study for such a study, given the previous air quality pollution trends, industrial makeup, and proximity of residential areas to pollution sources (Okello et al., 2018).
Health effects, and burden associated with air pollution studies
Emissions from industrial activities, different transport modes, the burning of fossil fuels, biomass fires, aerosol use, and radiation comprise some of the main sources of air pollution (WHO, 2016). Such sources of emissions release gases and substances that are toxic for human beings, the most harmful of which include particulate matter (PM), carbon monoxide (CO), ozone (O3), NO2 and SO2 (Guerreiro, Foltescu, & deLeeuw, 2014; Mohammadi, Azhdarpoor, Shahsavani, & Tabatabaee, 2016). These pollutants have been declared as priority pollutants in South Africa (DEA, 2009).
Health impacts result from either short-term or long-term exposure to air pollution (Haagsma et al, 2014). Short term effects include irritation of the eyes (Goudarzi et al., 2016), the inflammation of the respiratory tract, which causes coughing, mucus secretion, aggravation of asthma and chronic bronchitis. (WHO, 2016). The long term effects, which result from an extended period of exposure, include lung and bronchus cancer, asthma, ALRI, IHD, COPD and CEV (Ghanbari Ghozikali et al., 2016; Lelieveld et al., 2015; WHO, 2016).
Several studies have demonstrated an association between air quality pollution and health and have shown some benefits of legal intervention (Keen & Altieri, 2016; Langerman et al., 2018; Naiker et al., 2012; Norman et al., 2007). A study among the community living in the north-west of the City of Cape Town near petrochemical processing operations showed an association between asthmatic symptoms in school children and a meteorologically estimated petrochemical emissions dose (Norman et al., 2007). Another study estimating the burden of disease in South Africa concluded that outdoor air pollution in urban areas was estimated to cause 3.7% of the national mortality from cardiopulmonary disease and 5.1% of mortality attributable to cancers of the trachea, bronchus and lung in adults aged 30 years and older, and 1.1% of mortality from ALRIs in children under 5 years of age (Norman et al., 2007).
Yet again in South Durban, a health study aimed at assessing the influences of industrial and vehicular emissions on respiratory health found that relatively moderate ambient concentrations of NO2, NO, PM10, and SO2 were strongly and significantly associated with reduced lung function among children with persistent asthma (eThekwini Municipality, 2007). The study, which estimated lifetime cancer risks from inhalation of pollutants, indicated that children attending primary school in south Durban, compared to the northern suburbs, had an increased risk of persistent asthma and for marked airway hyperactivity. Higher outdoor concentrations of NO2, NO, PM10, and SO2 were strongly and significantly associated with a higher reduction in lung function.
In Richards Bay, a study conducted between 2011-2013, focused mainly on perceptions of air pollution in different suburbs based on economic class. It concluded that the less affluent suburban dwellers felt more affected by air pollution than the affluent dwellers (Jaggernath, 2013). A study for the KwaZulu Natal Department of Agriculture, Environment and Rural Development (KZN-DEARD) found some impacts associated with air pollution but was not conclusive on the link between health and air pollution on the populations due to limited long term data (KZN-DEA, 2014).
Methodology
Data sources
The data on mortality was obtained from Statistics South Africa (Stats SA), the custodians of population data, including causes of mortality in South Africa. This data from Stats SA is based on administrative records from death notification forms accumulated by the Department of Home Affairs (DHA) (Stats SA, 2016). It should be noted that the analyses do not include factors such as cigarette smoking that may predispose people to respiratory complications but rather to air pollution-related mortality in general. Data on the trends of air quality pollution related complaints was obtained from the RBCAA.
Data analyses
The mortality endpoints or causes analysed include lung and bronchus cancer, asthma, ALRI, IHD, CEV and COPD (Lelieveld et al., 2015; WHO, 2016).
The data obtained was aggregated in terms of age groups 0-4, 5-24, 25-64, and 65+ years of age for ease of interpretation, as different mortality endpoints affect different age groups differently. Further, total mortalities before and after the promulgation of NAAQS and MES were analyzed using the Mann Kendall test (MK-tests) (Guerreiro et al., 2014; Koudahe et al., 2017) to determine any significant change. This test is used to analyse data collected over time for consistently upward or downward trends ("monotonic trends"). Being a non-parametric test, the MK trend test works for all distributions, including for data that is not normally distributed. The test is robust in that it can be used to find trends for as few as four samples (Guerreiro et al., 2014).
YLL analysed considered the age at which mortalities occur, giving greater weight to mortalities at a younger age and lower weight to mortalities at an older age. The indicator measures the YLL due to a cause as a proportion of the total YLL lost in the population due to premature mortality (Devleesschauwer et al., 2014)
The number of YLL is calculated by summing the number of mortalities at each age between 1-75 years, multiplied by the number of years of life remaining up to the age of 80 years.

Where:
i = age
ai= no. years of life remaining to age 80 when death occurs between ages and i+1
di= no. of observed mortalities in the population under investigation between aged i and i+1
Assuming a uniform distribution of mortalities within age groups, ai.= 75 - (i+0.5) and therefore:

The perceptions of residents were obtained through an online survey that was conducted in October 2018 using Evasys online survey system (Okello et al., 2020). Complaints data was obtained from the RBCAA, which has a very robust system of air quality complaints handling (RBCAA, 2018).
Results and Discussion
In this section, the results of trends and significance in mortality, as well as YLL before and after the introduction of the NAAQS and are discussed. Additionally, changes in the ranking of mortality due to pollution-related diseases and the results of the residents' perceptions and complaints are examined.
Trends in mortality due to air quality-related diseases
Absolute trend and significance thereof
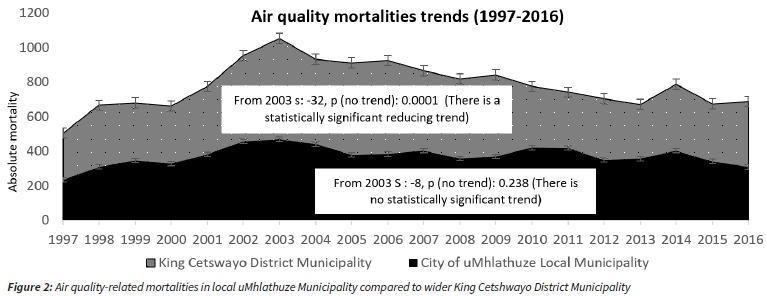
Twenty years of data analyzed indicate a steady increase in mortality (almost double) from 1997 to 2003. This data includes the total number of mortalities attributed to asthma, CEV, IHD, lung, trachea and bronchus cancer, ALRI and COPD. After 2003, a general decrease in mortality is observed in the wider KCDM.
The local uMhlathuze Municipality contributes almost half of the mortalities in KCDM (Figure 2). This could be attributed to its larger share of population size, industrial make-up and pollution concentration compared with the wider KCDM. When the Mann-Kendall trend test for significance is applied on mortalities at both the local uMhlathuze Municipality level and the wider KCDM level (2003 onwards), a statistically significant decreasing trend is seen in the number of moralities at the wider KCDM level. However, at the local uMhlathuze Municipality level, there is a decreasing trend in air quality-related mortality, but the decrease is not statistically significant.
The results of the linear regression model taken from 2003 to 2016 show that, on average, mortality is decreasing and is expected to decrease further. This is important and could signify that efforts to manage pollution are working.
Variation of mortalities among different age groups
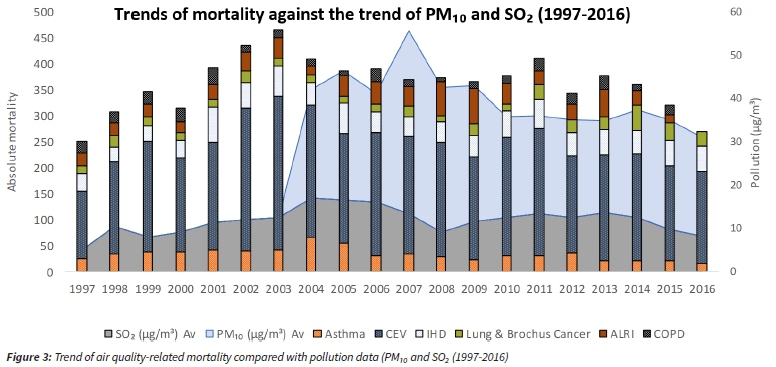
Figure 3 shows the trend in mortality compared with the trend of air quality data (SO2 μg/m3 and PM10 μg/m3) but also presents the variation in diseases per year. CEV among adults is the main underlying cause of mortality, followed by IHD, asthma, and ALRI. The comparison, especially with SO2, shows a clear similarity in the trend between air pollution and the related mortality. For example, a rise in pollution in 2004 is commensurate with an increase in mortality due to asthma cases in the same year. SO2 is known to affect the respiratory system and the functions of the lungs and causes irritation of the eyes (Goudarzi et al., 2016). Consequently, the inflammation of the respiratory tract causes coughing, mucus secretion, aggravation of asthma and chronic bronchitis and makes people more vulnerable to infections of the respiratory tract (WHO, 2016). It is also evident that the decrease in PM10, although not statistically significant, coincides with a decrease in mortalities (Okello et al., 2018).
In Figure 4, a higher rate of mortality is seen amongst the middle-aged (25-64) and older generations (65+) with the middle-aged group being the most affected by asthma, ALRI as well as lung and bronchus cancer. These results mirror those of a study conducted in Richards Bay by the KwaZulu-Natal Department of Agriculture, Environment and Rural Development in 2014 in which mostly the middle-aged adults frequented hospitals for air quality-related ailments. The 65+ age group was most affected by CEV and IHD with mortality rates rising among this age group.
The trends in mortalities related to these diseases are also on the rise except for asthma and COPD, which have a slight downward trend. ALRI and asthma-related mortalities are present among all age groups and represent diseases with more impact on children. ALRI is known to affect all age groups, but the younger population is more vulnerable (Murray & Lopez, 2013; Norman et al., 2007).
Changes in health risk before and after the introduction of NAAQS and MES
Data analysed before NAAQS and MES promulgation (2003-2009) and after (2010-2016) indicated a decrease in CEV mortality among the 15 year-old group upwards to 65+ (Figure 5). Mortality due to CEV is an indication of the long-term effects of pollution and represents the highest mortality, particularly in the older age groups. Similarly, ALRI and Asthma cases have reduced in the age group of 25-64 (Figure 5). On the other hand, mortality due to lung and bronchus cancer, ALRI, IHD, as well as COPD, have increased. The decrease in mortality mirrors the decrease in ambient PM10 and SO2 concentrations measured by the RBCAA (Okello et al., 2018).
The cases of increase in mortality can also be considered as a lag, that is, having been affected previously before the introduction of air quality standards and thus manifesting the long-term effects of air pollution before the introduction of the new standards post-2010.
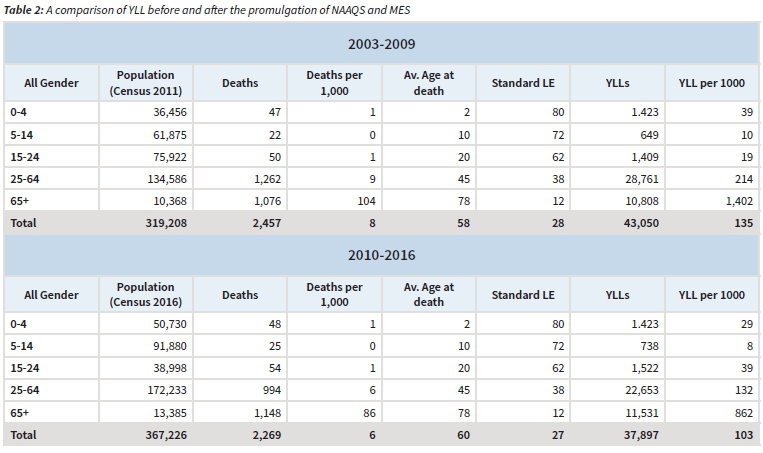
Year of Lost Life Comparison
Another metric used to determine the change in mortality before and after 2010 is the analysis of YLL per 1000 (5 years before and after the promulgation of NAAQS and MES). The results indicate a 24% decrease in the YLL due to air quality-related diseases (Table 2). The decrease can be observed across all age groups except for the 15-24-year-old where there is a slight increase although with few mortality cases. It appears that the adults and the older generation are now living slightly longer.
This result is important in that it indicates an improvement in air quality, but also signals the need for more pollution control.
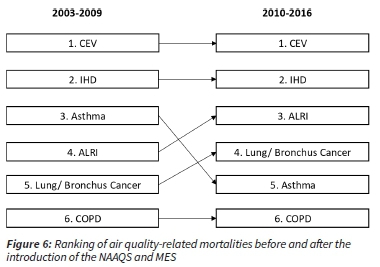
Changes in the ranking of pollution-related mortality causes
On ranking the six mortality causes considered (with one as the highest cause and six as the least), CEV and IHD remain the top two even after the introduction of the NAAQS and MES. A reduction in asthma can be observed from the third-highest to fifth in the ranking. ALRI and cancer have increased one step up. (Figure 6)
Residents perceptions and complaints
The results of the survey undertaken in Richards Bay and the surrounding community indicate a cautious concern over air quality. Most of the public perceives the air quality as fair or poor (Okello et al., 2020). The fair rating is likely to be a result of a downward trend in pollution, particularly PM10 and SO2 (Okello et al., 2018). Nonetheless, widespread sporadic pollution events over the airshed continue to occur. Residential areas closer to main pollution sources such as CBD and Arboretum seem to experience more pollution.
The main cause of pollution affecting the local uMhlathuze Municipality residents is industrial sources followed by agricultural (sugar cane and agrarian burning) and then general waste burning. These results are similar to previous studies and reports in the area (Jaggernath, 2013; uMoya-NILU, 2014) and point out where the focus should be if further pollution reduction is to be achieved.
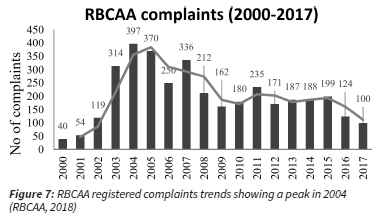
Aside from the perceptions, the trends in complaints recorded by the RBCAA over the last two decades are important in assessing the historical changes in air emissions. Figure 7 shows a peak of 379 complaints in 2004 and then a drop thereafter. The RBCAA recorded a total of 3,638 complaints between 2000 to 2017, most of which were attributed to industries around the local Municipality's CBD (RBCAA, 2018).
Conclusion and Recommendations
The study aimed to analyse changes in health risk associated with air quality pollution exposure in Richards Bay before and after the introduction of the NAAQS and MES in 2009 and 2012, respectively.
We conclude that there is a slight improvement in air quality and health benefits that could be attributed to policy implementation. This is based on the results, which indicate a reducing trend of incidents of air quality-related mortalities, although in the local uMhlathuze Municipality it is not statistically significant. There is a 24% difference in YLL before the promulgation of NAAQS and MES and thereafter, a factor that points out to an improved situation. More so, the number of asthma cases has greatly reduced between the period before and after NAAQS and MES. Lastly, there is a perception that air quality is fair and complaints to the RBCAA have reduced markedly since 2004.
One would argue that the reducing mortality trend could be a result of several factors, among others: the introduction of NAAQS in 2009, the implementation of MES for Listed Activities from 2012, the pressure on industrial emission sources from NGOs such as the RBCAA and/or the implementation of the KCDM air quality management plan from 2014. It could also mean an improvement in health care intervention, or increased migration and emigration, which would impact the observed trends.
Nonetheless, the increase in mortality due to certain disease cases such as cancer of the bronchus and lung, the onset of which could have been prior to 2010, signifies that the pollution control efforts need to continue and be enhanced. The increase of ALRI, which adversely affects children, is of concern. Cases of CEV in the younger, as well as the older generation, is still an issue that requires continuous monitoring and intervention. A recent study in Limpopo, South Africa with similar results, (Tshehla & Wright, 2019b) has suggested a revision of the current South Africa PM10 standards to be comparable to the WHO guidelines. This is desirable to improve the protection of human health and well-being.
While the study examined mortality in the last 20 years, further analysis of data in years to come may present more information on policy efficacy. This makes it important to continue with and support monitoring efforts currently on-going. Due to time and resource constraints, this study did not examine morbidity data (hospital admissions, loss of workdays, school days, etc.) which could be used to improve the understanding of policy efficacy. Morbidity data can also be used to understand Disability Adjusted Life Years, which include YLL and Years Lived with Disability. Potential still exists to use modelled air quality predictions to postulate mortalities in the future. Besides, there could be other predisposing factors to respiratory complications such as cigarette smoking that were not singled out.
Acknowledgement
The authors wish to thank Statistics SA for data provided on mortality due to air quality-related outcomes. Without this data, analyses of trends and the efficacy of policy implementation would not have been possible. We also thank Tronox KZN Sands and my current employer Base Titanium for study assistance in attending workshops and seminars related to the PhD program. We hope this paper contributes in one way or another on the overall air quality of the local uMhlathuze Municipality, KCDM, South Africa and beyond.
References
Amegah, A. K., & Agyei-Mensah, S. (2017). Urban air pollution in Sub-Saharan Africa: Time for action. Environmental Pollution, Vol. 220. https://doi.org/10.1016/jJ.envpol.2016.09.042 [ Links ]
Bradshaw, D., Groenewald, P., Laubscher, R., Nannan, N., Nojilana, B., Norman, R., ... Schneider, M. (2003). MRC POLICY BRIEF. (1), 1-4. [ Links ]
Brauer, M., Freedman, G., Frostad, J., Donkelaar, A. Van, Martin, R. V, Dingenen, R. Van, ... Cohen, A. (2015). Ambient Air Pollution Exposure Estimation for the Global Burden of Disease 2013. https://doi.org/10.1021/acs.est.5b03709 [ Links ]
DEA. (2009). State of Air Report 2005 A report on the state of the air in South Africa, Department of Environmental Affairs (DEA). 1-6. Retrieved from https://www.environment.gov.za/sites/default/.../stateofair_executive_introduction.pdf [ Links ]
Devleesschauwer, B., Havelaar, A. H., Maertens De Noordhout, C., Haagsma, J. A., Praet, N., Dorny, P., . Speybroeck, N. (2014). Calculating disability-adjusted life years to quantify burden of disease. International Journal of Public Health, 59(3), 565-569. https://doi.org/10.1007/s00038-014-0552-z [ Links ]
eThekwini Municipality. (2007). South Durban Health Study. In Multipoint Plan: Project 4 Health Study and Health Risk Assessment. Retrieved from http://scholar.google.com/.../South+Durban+Health+Study#4 [ Links ]
Forouzanfar, M. H., Alexander, L., Anderson, H. R., Bachman, V. F., Biryukov, S., Brauer, M., . Murray, C. J. (2015). Global, regional, and national comparative risk assessment of 79 behavioural, environmental and occupational, and metabolic risks or clusters of risks in 188 countries, 1990 2013: a systematic analysis for the Global Burden of Disease Study 2013. The Lancet, 386(10010), 2287-2323. https://doi.org/10.1016/S0140-6736(15)00128-2 [ Links ]
Ghanbari Ghozikali, M., Heibati, B., Naddafi, K., Kloog, I., Oliveri Conti, G., Polosa, R., & Ferrante, M. (2016). Evaluation of Chronic Obstructive Pulmonary Disease (COPD) attributed to atmospheric O3, NO2, and SO2 using Air Q Model (2011-2012 year). Environmental Research, 144. https://doi.org/10.1016/j.envres.2015.10.030 [ Links ]
Goudarzi, G., Geravandi, S., Idani, E., Hosseini, S. A., Baneshi, M. M., Yari, A. R., . Mohammadi, M. J. (2016). An evaluation of hospital admission respiratory disease attributed to sulfur dioxide ambient concentration in Ahvaz from 2011 through 2013. Environmental Science and Pollution Research, 23(21), 2200122007. https://doi.org/10.1007/s11356-016-7447-x [ Links ]
Guerreiro, C., Foltescu, V., & deLeeuw, F. (2014). Air quality status and trends in Europe. Atmospheric Environment, 98, 376-384. https://doi.org/10.1016/j.atmosenv.2014.09.017 [ Links ]
Haagsma, J. A., Polinder, S., Cassini, A., Colzani, E., & Havelaar, A. H. (2014). Review of disability weight studies: Comparison of methodological choices and values. Population Health Metrics, 12(1). https://doi.org/10.1186/s12963-014-0020-2 [ Links ]
Jaggernath, J. (2013). A socio-economic and spatial investigation into the health implications of air pollution in Richards Bay, Kwazulu-Natal, South Africa. University of KwaZulu-Natal. [ Links ]
Keen, S., & Altieri, K. (2016). The health benefits of attaining and strengthening air quality standards in Cape Town. Clean Air Journal, 26(2), 22-27. https://doi.org/10.17159/2410-972x/2016/v26n2a9 [ Links ]
Koudahe, K., Djaman, K., Bodian, A., Irmak, S., Sall, M., Diop, L., . Rudnick, D. R. (2017). Trend Analysis in Rainfall, Reference Evapotranspiration and Aridity Index in Southern Senegal: Adaptation to the Vulnerability of Rainfed Rice Cultivation to Climate Change. Atmospheric and Climate Sciences, 07(04), 476495. https://doi.org/10.4236/acs.2017.74035 [ Links ]
KZN-DEA. (2014). Air quality monitoring and health impact assessment study of the Richards Bay area. Report by Gondwana Environmental Solutions. Retrieved from Richards Bay Clean Air Association Records [ Links ]
Langerman, K. E., Pauw, C. J., Smith, H. J., & Piketh, S. J. (2018). Moving households to cleaner energy through air quality offsets. 2018 International Conference on the Domestic Use of Energy (DUE), 1-8. https://doi.org/10.23919/DUE.2018.8384405 [ Links ]
Lelieveld, J., Evans, J. S., Fnais, M., Giannadaki, D., & Pozzer, A. (2015). The contribution of outdoor air pollution sources to premature mortality on a global scale. Nature, 525(7569). https://doi.org/10.1038/nature15371 [ Links ]
Mohammadi, A., Azhdarpoor, A., Shahsavani, A., & Tabatabaee, H. (2016). Investigating the health effects of exposure to criteria pollutants using airq2.2.3 in Shiraz, Iran. Aerosol and Air Quality Research, 16(4). https://doi.org/10.4209/aaqr.2015.07.0434 [ Links ]
Murray, C. J. L., & Lopez, A. D. (2013). Measuring the Global Burden of Disease. New England Journal of Medicine, 369(5), 448-457. https://doi.org/10.1056/NEJMra1201534 [ Links ]
Naiker, Y., Diab, R. D., Zunckel, M., & Hayes, E. T. (2012). Introduction of local Air Quality Management in South Africa: Overview and challenges. Environmental Science and Policy. https://doi.org/10.1016/j.envsci.2011.11.009 [ Links ]
Norman, R., Barnes, B., Mathee, A., & Bradshaw, D. (2007). Estimating the burden of disease attributable to indoor air pollution from household use of solid fuels in South Africa in 2000. South African Medical Journal, 97(8), 764-771. https://doi.org/10.7196/SAMJ.673 [ Links ]
Okello, N., & Allan, C. (2015). The Richards Bay Clean Air Association: A Case Study for Success in Participatory Air Quality Management. Clean Air Journal, 25(1), 34-39. Retrieved from http://dx.doi.org/10.17159/2410-972X/2015/v25n1a2 [ Links ]
Okello, N., Camminga, S., Okello, T., & Zunckel, M. (2018). Spatial and Temporal Trends of PM10 and SO2 in the. Clean Air Journal, 28(2), 80-89. https://doi.org/http://dx.doi.org/10.17159/2410-972X/2018/v28n2a20 [ Links ]
Okello, N., Okello, T., & Zunckel, M. (2020). Public perception and suggestions to improve of air quality justice: The case of Richards Bay, South Africa. (In Review) Clean Air Journal. RBCAA. (2018). Annual Air Quality Report - 2018. Richards Bay. [ Links ]
Savides, D. (2011, May 27). Celebrating 14 years of monitoring air quality and supporting responsible industrial development. Zululand Observer, p. 4. [ Links ]
Scorgie, Y. (2012). Urban Air Quality Management and Planning in South Africa. Doctoral thesis. Department of Geography, Environmental Management and Energy Studies, Faculty of Science, University of JohannesburgUniversity of Johannesburg. September 2012. [ Links ]
Stats SA. (2016). Mortality and causes of death in South Africa, 2015: Findings from death notification. Statistical Release P0309.3, (November), 1-127. https://doi.org/Statistical_release_P0309.3 [ Links ]
Tshehla, C., & Wright, C. (2019a). 15 years after the National Environmental Management Air Quality Act: Is legislation failing to reduce air pollution in South Africa? South African Journal of Science, 115(9-10), 2-5. https://doi.org/10.17159/sajs.2019/6100 [ Links ]
Tshehla, C., & Wright, C. (2019b). Spatial and temporal variation of PM10 from industrial point sources in a rural area in limpopo, South Africa. International Journal of Environmental Research and Public Health, 16(18). https://doi.org/10.3390/ijerph16183455 [ Links ]
Turnock, S. T., Butt, E. W., Richardson, T. B., Mann, G. W., Reddington, C. L., Forster, P. M., ... Spracklen, D. V. (2016). The impact of European legislative and technology measures to reduce air pollutants on air quality, human health and climate. Environmental Research Letters, 11(2). https://doi.org/10.1088/1748-9326/11/2/024010 [ Links ]
uMhlathuze Municipality. (2018). Integrated Development Plan. Retrieved from http://www.umhlathuze.gov.za/images/IDP/IDP.pdf [ Links ]
uMoya-NILU. (2014). Air Quality Management Plan for the uThungulu District Municipality: Output B:Status Quo Assessment of Air Quality in the uThungulu District Municipality, Report No. uMN028-2013, January 2014. [ Links ]
WHO. (2005). Air quality guidelines. Global update 2005. Particulate matter, ozone, nitrogen dioxide and sulfur dioxide. Environmental Science and Pollution Research, 3(91), 23-23. https://doi.org/10.1007/BF02986808 [ Links ]
WHO. (2016). Ambient Air Pollution: A global assessment of exposure and burden of disease. World Health Organization, 1-131. https://doi.org/9789241511353 [ Links ]
Yamineva, Y., & Romppanen, S. (2017). Is law failing to address air pollution? Reflections on international and EU developments. Review of European, Comparative and International Environmental Law, 26(3), 189-200. https://doi.org/10.1111/reel.12223 [ Links ]
Received: 28 February 2020
Reviewed: 29 April 2020
Accepted: 24 May 2020

