


Servicios Personalizados
Articulo
 Inglés (pdf)
 Articulo en XML
 Referencias del artículo
Indicadores

Links relacionados
-
 Citado por Google
 -
 Similares en Google
Compartir

 Permalink
Clean Air Journal
versión On-line ISSN 2410-972X
versión impresa ISSN 1017-1703
Clean Air J. vol.29 no.2 Pretoria 2019
http://dx.doi.org/10.17159/caj/2019/29/2.7517
RESEARCH ARTICLE
Aerosol characterisation including oxidative potential as a proxy of health impact: a case of a residential site in a highly industrialised area
Miroslav JosipovicI; Catherine Leal-LiousseII; Belinda CrobedduIII; Armelle Baeza-SquibanIII; C. Keitumetse SegakwengI; Corinne Galy-LacauxII; J. Paul BeukesI; Pieter G. van ZylI; Gerhard FourieIV
IUnit for Environmental Sciences and Management, North-West University, Potchefstroom Campus, South Africa a) MickyJosipovic@nwu.ac.za b) 16516966@nwu.ac.za c) Paul.Beukes@nwu.ac.za d) Pieter.VanZyl@nwu.ac.za
IILaboratoire d'Aérologie, Université Paul Sabatier, Toulouse III, France a) cathy.leal-liousse@aero.obs-mip.fr b) corinne.galy-lacaux@aero.obs-mip.fr
IIIUnit of Functional and Adaptive Biology, UMR-CNRS 8251, Laboratory of Molecular and Cellular Responses to Xenobiotics, University Paris Diderot, Sorbonne Paris Cité, France a) belinda.crobeddu@gmail.com b) baeza@univ-paris-diderot.fr
IVEnviroNgaka (Pty) Ltd., Brits, South Africa, gerhard.fourie@environgaka.co.za
ABSTRACT
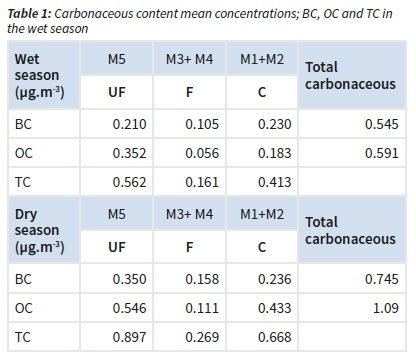
This study aimed to characterise aerosols sampled in the vicinity of a major industrialised area, i.e. the Vaal Triangle. It included the determination of oxidative potential as a predictive indicator of particle toxicity. Aerosol samples were collated through the cascade filtering during an eight-month period (12 h over three days in one week). Three size fractions were analysed for organic carbon (OC), black carbon (BC) and oxidative potential (OP), while ionic content was presented as monthly and seasonal concentrations. The continuous measurement of black carbon by an optical attenuation instrument was collated concurrently with cascade filtering. The carbonaceous content was low compared to the ionic one. Within the carbonaceous concentrations, the organic carbon was higher than concentrations of black carbon in both seasons in the ultra-fine fraction; the opposite was the case for the fine fraction, while the coarse fraction concentrations of organic carbon in the dry season had higher concentrations than black carbon in the wet season and organic carbon in the wet season. The OP tended to increase as the size was decreasing for wet season aerosols, whereas, for the dry season, the highest OP was exerted by the fine fraction. The ultrafine fraction was the one showing the most contrasting OP between the two seasons. Continuous monitoring indicated that the higher BC concentrations were recorded in the dry/winter part of the year, with the daily pattern of concentrations being typically bimodal, having both the morning and evening peaks in both seasons. Within the ionic content, the dominance of sulphate, nitrate and ammonium was evident. Multiple linear correlations were performed between all determined compounds. Strong correlations of carboxylic acids with other organic compounds were revealed. These acids point to emissions of VOC, both anthropogenic and biogenic. Since they were equally present in both seasons, a mixture of sources was responsible, both present in the wider area and throughout the year.
Keywords: carbon, ions, acellular assays, cascade impactors, aethalometer
Introduction
Context and problem
Pollution is now recognised to be a huge environmental threat, with air pollution being a leading cause of premature human death (Landrigan et al., 2018). The different air pollutants, their doses and time of exposure and in particular the pollutant mixtures to which humans are usually exposed lead to adverse impacts on human (and similarly to animal) health that range from acute to chronic effects. Epidemiological studies and animal model data state that primarily affected systems are the cardiovascular and the respiratory system (Kampa and Castanas, 2007). In terms of the health effects of the particulate matter (PM), there has been substantial progress in the evaluation of PM health effects at different time-scales of exposure and in the exploration of the concentration-response function (Pope and Dockery, 2006).
Inhalation toxicology research has demonstrated that the generation of reactive oxygen species (ROS) and the associated induction of oxidative stress in target cells may represent a key pathway by which ambient fine and ultrafine (sub-micrometre) size particles cause adverse health effects. Particle surface reactivity, metals and redox cycling organic compounds are properties shown to be involved in ROS generation.
Air quality (AQ) regulations in most countries rely on PM volumetric mass without taking into consideration PM composition. Since PM is a complex mixture including metallic, inorganic and organic compounds, with differing proportions depending on the sources of emissions and ambient atmospheric conditions, alternative metrics such as the oxidative potential (OP) can and have been proposed to predict PM toxicity (Boogaard et al., 2012).
Oxidative properties of aerosol are considered to be important attributes to explain many of the aerosol biological/health effects (Borm et al., 2007). As such, aerosol OP constitutes a unifying factor explaining its pathological activity and has been considered as an additional metric to determine aerosol health impact (Donaldson et al., 1996; Borm et al., 2007). Li et al. (2003) indicated that the ultra-fine mode of ambient aerosols collected from Los Angeles (USA) had a higher intrinsic oxidative capacity than the fine and coarse aerosol modes.
To date, not many health impact studies have been undertaken in Africa. The POLCA project ("POLlution des Capitales Africaines") in western Africa was a pioneering study that addressed the physicochemical characterisation of aerosol pollution in two west African capitals (Bamako, Mali and Dakar, Senegal). These cities experience high population growth. They are impacted by a variety of emission sources, dominated by traffic and domestic burning, and strongly subjected to contrasted meteorological conditions (Doumbia et al., 2012).
The sampling campaigns in these West African capitals were performed during the dry season, and the influence of the Saharan dust events and biomass burning was recognised in addition to prevailing anthropological pollution sources, mainly traffic and domestic burning (Assamoi and Liousse, 2010). Val et al. (2013) demonstrated that the finest size fractions of these aerosols induced a pro-inflammatory response in human bronchial cells, indicating that aerosol pollution in West African cities may have a strong impact on its population health. These cities have high ambient aerosol concentrations originating from anthropogenic sources known to contribute to health effects (Doumbia et al., 2012; Liousse and Galy-Lacaux, 2010; Cassee et al., 2013).
South Africa has one of the largest economies in Africa and remains the largest industrialised regional energy producer. South Africa is on a continuing trend of increasing fossil fuel consumption and demand for electricity. Most of the electricity in South Africa is produced by coal-fired power stations. A substantial fraction of liquid fuel is also distilled from coal as well as from natural gas. The main axes of South Africa's economy remain the large mining and associated metallurgical industries (e.g. Beukes et al., 2010). Domestic biomass and fossil fuel combustion for space heating and cooking is also widely practised, especially in informal settlements that are found around most towns and cities (e.g. Kimemia et al., 2010; Vakkari et al., 2013; Butt et al., 2016; Makonese et al., 2016).
All of the afore-mentioned has led to increased environmental concerns with atmospheric pollution being a major worry. New industrial installations in South Africa are being equipped with cleaner technologies. However, emissions of sulphur dioxide (SO2), oxides of nitrogen (NOx), black carbon (BC) and carbon dioxide (CO2) are predicted to increase.
These emissions, combined with a potential change in biomass burning due to global warming, and the associated dryer climate in certain parts of southern Africa, can significantly influence the regional and global climate (Boko et al., 2007). Climate change may also enhance migration to already densely populated urban areas, and potentially increase environmental concerns.
Overall, the atmospheric PM in this region originates from a mixture of natural and anthropogenic emission sources (such as industry, domestic burning, biomass burning, transport), and is spatially and temporally variable (Tiitta et al., 2014). On the southern African sub-continent, number concentrations and optical properties of sub-micrometre aerosol particles have been investigated intensively during the SAFARI 1992 and 2000 measurement campaigns (Swap et al., 2003; Ross et al., 2003; Eck et al., 2003). Recently, more studies have been published on the aerosol measurements regionally giving more insight into the sub-micrometre number-size distribution, formation of secondary particles, and trends and loadings of non-refractive species (Hirsikko et al., 2012; Vakkari et al., 2013; Tiitta et al., 2014; Sundström et al., 2015). The aerosol organic compounds were studied (Booyens et al., 2015), BC modelled results were compared with the regional BC (continuous) measurements (Kuik et al., 2015), and impacts of aerosols from residential activities were also modelled (Butt et al., 2016).
This study focused on characterising aerosol pollution impacting a residential suburb amid a major South African industrialised area, i.e. the Vaal Triangle. In addition to the carbonaceous and ionic content, the oxidative potential of the aerosols was determined to provide a predictive indicator of their toxicity.
The particles from 0.25 to over 2.5 pm in aerodynamic diameters were collected through three cascade impactor devices running in parallel at the Vaal Park Primary School, in Sasolburg. They were sampled for 12 hours in each of three sampling days during the last week of every month from March 2012 to October 2012 to encompass the three local weather seasons: entire autumn, entire winter and early to mid-spring. The thermal analytical method was used to determine the black carbon (BC) and organic carbon (OC) content (Cachier et al., 1989), whereas (water soluble) ionic compounds were determined by ion chromatography and inductively coupled-plasma-mass spectroscopy. Three different acellular assays were applied to characterise the oxidative potential. A determination of trace metals content was out of the scope for this study.
Site selection
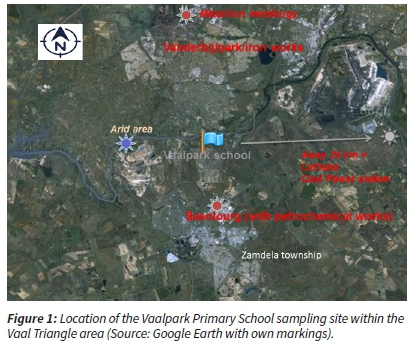
The study area is colloquially called the Vaal Triangle, after the three towns forming each of its three spatial angles (Sasolburg, Vanderbijlpark and Vereeniging). The Vaal Triangle area is where a large part of the South African petrochemical and other chemical industries is located. In addition, other large point sources, including a coal-fired power station (without SOx and NOx scrubbing) and several large (iron) metallurgical smelters, are also within this area. This area, together with the southern section of Gauteng was proclaimed a national air pollution area for intervention in terms of the South African National Environmental Management: Air Quality Act (Government Gazette Republic of South Africa, 2007) termed the "Vaal Triangle Priority Area" (constituting effectively more intensely monitored air-shed air quality (AQ) management area). The Vaal Triangle is also home to a number of formal (towns and townships) and informal settlements (slums), which mainly use coal, paraffin and wood as fuel sources. This, in turn, impacts directly on the health and well-being of the people residing in these communities. Other sources of concern contributing to the pollution emission mixtures within the area include transport-related emissions, biomass burning (domestic/anthropogenic and wild/natural), water treatment works and landfill areas, agricultural activities and various other fugitive sources. This is a strong indication that air quality in this area often exceeds or is close to exceeding National Ambient Air Quality Standards for criteria pollutants.
The study sampling site was set at the grounds of a primary school in the target area (Vaalpark Primary School). The sampling site's latitude is 26°46' 2" south, and the longitude is 27"5Γ 12" east (Figure 1). The sampling site was chosen for its proximity to the Sasolburg industrial complex. This was done to determine the level of aerosol pollution possibly received by the population working, visiting and residing in close proximity to the major petrochemical complex (Sasol Industries) and metallurgical industries (in Vanderbijlpark and Vereeniging municipalities) (Figure 1).
Regional weather and climate
Geo-morphologically, the sampling site is located on the South African Highveld (an elevated plateau of 1400 m a.s.l. to 1700 m a.s.l.). Laakso et al. (2012) recently gave a concise description of the weather conditions over the South African Highveld. The description in this paper is, therefore, limited.
Over the South African Highveld, literally all precipitation falls during the wet season (from mid-October to end of April), with almost no precipitation during the dry season (May to mid-October). The exact duration of the dry and wet seasons can differ between years, especially if the onset of rains is late. This distinct precipitation cycle strongly affects pollutant concentrations, i.e. enhanced wet scavenging (wet deposition/wash-out) of pollutants during the wet season, while pollution levels are increased during the dry season through the occurrence of large-scale biomass burning and wind-blown dust emissions.
An important attribute of the regional climate is protracted periods of cold mainly night temperatures with often sub-zero temperatures, which contribute to lower relative humidity in the ambient air as well as drying moisture content from vegetation. The lower temperatures also coincide with increased use of coal, paraffin and wood as fuels in low-income residential areas (formal and informal). This contributes to the overall ambient pollution levels and subsequently to the increase in aerosol concentrations. During the winter and early spring months, multiple inversion layers form regularly at various altitudes. Such layered atmospheric structure significantly reduces vertical mixing, impacting significantly on the residence time of atmospheric pollutant concentrations. The region is also dominated by anti-cyclonic circulation, especially during the winter months (June-Aug). Such re-circulation can trap pollutants for a number of weeks (Garstang et al., 1996; Tyson and Preston-Whyte, 2000; Freiman and Piketh, 2002, Mafusire et al., 2016).
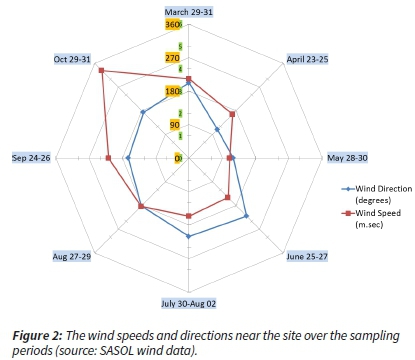
The more frequent and highest wind speeds are observed during the end of the dry season (August, September and part of October), towards the beginning of the wet season (mid- to end-October) (Figure 2).
During the wet season, besides higher precipitation, higher temperatures and relative humidity with frontal and convective air mass movements enable horizontal and vertical mixing of the atmosphere over the area, and across the entire region, allowing better dispersion and dilution of pollutants.
Methods
Aerosol filter (impactor) sampling
The filter collection of aerosol was performed by means of three cascade impactors (5-stage Sioutas-type impactor) at the flowrate of 9 l.min-1, running in parallel for 12 h a day over three days (8am-8pm), resulting in 36 h of sampling per month. Each cascade impactor (Sioutas) was mounted with four 25 mm diameter filters, and one 37 mm filter (one Sioutas with polycarbonate nuclepore filters with 1 pm porosity). A second (Sioutas) impactor, equipped with quartz filters (QMA, Whatman), was dedicated to carbonaceous aerosol measurements (for black carbon - BC and organic carbon - OC determination). A third cascade impactor ran with Teflon filters (Zefluor, Pall Corporation®) for water-soluble ions and trace element analysis. Aerodynamic particle diameters collated by the cascade impactors were in the following cut-off size ranges (marked as M5 - M1 in Table 1): <0.25 pm, 0.25-0.50 pm, 0.50-1 pm, 1-2.5 pm, and >2.5 pm. For the data analysis, the results were presented in three particle size fractions, which were combined out of five sizes: ultrafine particle, UF [<0.25 pm], fine, F [>0.25<1 pm], and coarse C [>1pm and >2.5 pm]. For oxidative potential measurements, particles from the same season were pooled.
Aethalometer (BC) measurement
Black carbon (BC) equivalent concentrations were also measured by using an optical attenuation method applied in a seven wavelength aethalometer (Magee Scientific®, model AE-42) ranging from 370 to 950 nm wavelengths. Just the periods towards the end of June 2012 and at the beginning of July 2012 were excluded due to temporary instrument stoppage, which left some periods with data gaps.
Meteorological data
An essential task in this study was to correctly allocate collated data into two main weather seasons with similar prevailing climatic conditions, i.e. wet and dry season, as to better categorise the entire dataset. This, we based on the following:
i. prevailing climatic patterns (Tyson and Preston-Whyte, 2000),
ii. the NOAA's ARL data for the sampling week and the South African Weather Service (SAWS) precipitation information because the measurements at the Vaalpark site did not include any rain gauge
iii. a nearby Sasol company AQ monitoring station (Vaal Eco-Park) acquisition of the wind speed and wind directions data.
From this, a decision was taken to keep the April filter samples within the wet season dataset, while the May data/filters were allocated to the dry season. September's filters were included in the dry season set, while October's filters were included in the wet season. There were several days with rain at the end of October (when our aerosol samplings were taken). Although October could fit in either season, the data were kept in the "wet season" data grouping.
Analytical methods
Carbonaceous content analysis by a thermal method
Black carbon (BC) and total carbon (TC) contents were determined from quartz filters with a thermal method developed by Cachier et al. (1989). Two similar aliquots of the same filter were separately analysed. One portion was directly examined for total carbon content (TC). The other portion was first submitted to a pre-combustion step (2 h at 340°C under pure oxygen) to eliminate OC and then analysed for BC content. Organic carbon (OC) concentrations were calculated as the difference between TC and BC.
Major ions (ion chromatographer) analysis
This method was used to determine water-soluble compounds. Teflon filters are weighted on a METTLER MC21S electronic microbalance with a sensitivity of 1 pg and measure the precision of ± 5 pg, to determine the aerosol mass loadings before analysis. In order to determine the water-soluble components (WSOC), half of the samples are extracted in 15 ml of Milli-Q water (resistivity ~ 18.2 MO) by ultrasonic stirring for 15 minutes. Three ion chromatographs, DX-100, ICS 1000 and DX 500 of Dionex were equipped respectively with an anion exchange column IonPac AS40, a cation exchange column IonPac AS50 and a carbonate exchange column IonPac AS50, which are used for separating the ions. A combination of 1.8 mM Na2CO3 and 1.7 mM NaHCO3 is used as the anion eluent, while a 20 mM solution of methane sulphonic acid (CH3SO2OH) is used as the cation eluent, and 100 % water de-ionised is used for eluting carbonate ion. WSOCs obtained were Cl-, SO42-, NO3-, CO32-, K+, Na+, NH4+, Mg+ and Ca'+ expressed in ppb. The limits of detection were less than 10 ppb for anions and cations.
Aerosol oxidative potential (OP) analysis The three size fractions presented above were reconstituted from sampled nuclepore membrane filters. Recovery of the particles was achieved as previously described by Ramgolam et al. (2009). Briefly, polycarbonate membranes were sonicated (Ultrasonic Processor, Bioblock Scientific), 3 χ 5 sec at 60 Watt in 15mM HEPES (2-[4-(2-hydroxyethyl)piperazin-1-yl]ethane-sulfonic acid) (Life Technologies, Gibco®). Blank filters were prepared in the same way and were used as a control in the experiments. Particle suspensions were stored at -20°C (to prevent degradation and bacterial development) until use, and were again sonicated (3 χ 10 sec) just before dilution in the culture media for acellular assays.
Three different acellular assays were performed to characterise the OP:
• the scission of plasmid DNA;
• the consumption of dithiothreitol (DTT), a reducing agent, and
• the depletion of antioxidants (AO): ascorbic acid (AA), uric acid (UA) and glutathione (GSH) in synthetic lung surfactant, according to the methods specified in Crobeddu et al. (2017).
Plasmid assay
It served as a determination of the ability of PM to induce DNA breaks. As such, it is a good indicator of PM ability to generate free radicals reactive enough to break DNA.
The DNA used was a plasmid (φΧ174) of 5386 bp. It is super-helicoidal except where there is a simple strand DNA break leading to a relaxed form. These forms can be separated by gel electrophoresis and quantified to evaluate their respective proportion.
Plasmid (290 ng) was incubated with 100 pg/ml particles in the presence of hydrogen peroxide (0.4 mM) in 15 mM Hepes buffer for 4 hours at 37°C under gentle agitation (Rotolab 3D). After incubation, samples were electrophoresed on a 1 % agarose gel at 50 V for 5 hours in a 1X Tris-Borate-EDTA buffer (Euromedex). At the end of the migration, DNA bands were visualised using ethidium bromide (2 pg/ml) by soaking for 10 min. The fluorescence is visualised on UV trans-illuminator and the intensity of the fluorescence of the super-helicoidal and relaxed forms was quantified using "Image J" software in order to express the results as a percentage (%) of relaxed form.
Anti-oxidant depletion assay
It served as a determination of the ability of PM to deplete anti-oxidants in a synthetic lung lining fluid. Three specific anti-oxidants used were: ascorbic acid (AA), uric acid (UA) and glutathione (GSH).
PM of each size fraction at 25, 50 and 100 pg/ml were incubated for 4 h at 37°C with AA, UA and GSH, under agitation. At the end of every incubation, each sample was centrifuged in 0.22 spins (Costar®, Fisher Scientific) (30 sec at 12 000 g) to eliminate the nanoparticle. AA, UA, GSH and the oxidised GSH form (GSSG) were analysed by means of reversed-phase HPLC (Shimadzu HPLC system interfaced with the "LabSolution" software). Samples were injected onto a C18 column (length 250 mm; internal diameter 4.6 mm; particle size 5 pm) at 40°C. The mobile phase composition for the gradient system was 25 mM sodium phosphate monobasic; 0.5 mM octane sulphonic acid (pH 2.7) for mobile phase A; and 100 % acetonitrile for mobile phase B. The gradient programme was 0-5min 0 % B; 5-10 min 0-12 % B; the initial conditions (100 % A) were then maintained for 10 min.
The products were monitored spectrophotometrically at 243 nm (AA); 280 nm (UA) and 210 nm (GSH; GSSG) and quantified by integration of the peak absorbance area.
DTT (dithiothreitol) consumption assay
The redox-active compounds catalyse the reduction of oxygen to superoxide by DTT, which is oxidised to disulphide (Kumagai et al., 2002).
PM of each size-fraction at 25, 50 and 100 pg/ml was incubated with 200 of DTT for 1 h at 37°C. After incubation, samples were centrifuged for 15 min at 3500 g at 4°C to eliminate PM. 5 mM of DTNB was added to the supernatant. The absorbance was analysed at 405 nm (micro-plate reader Multiskan-EX, Thermo Scientific).
For all the valid samples, the final results' blank sample values were taken into account at the time of calculation.
Results
Aerosol filter concentrations, its carbonaceous ratios and seasonal
trends
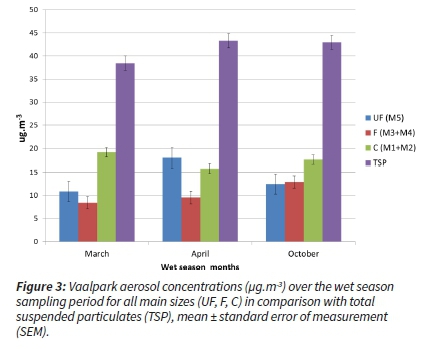
Considering the distribution of the aerosol filter concentrations over each main season, it was evident that the concentrations were comparable between the months of the wet season (Figure 3).
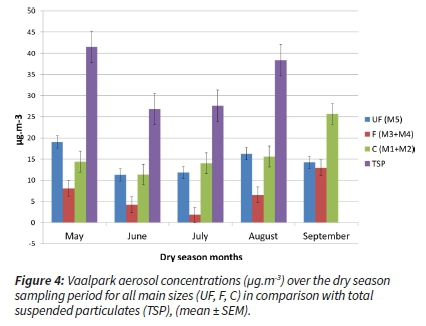
During two dry season months (June and July), concentrations decreased 'unseasonably', which constituted the anomaly for this region (dry and cold temperature, low ambient relative humidity, increased residential burning as well as the start of occasional wildfires/biomass burning) (Figure 4).
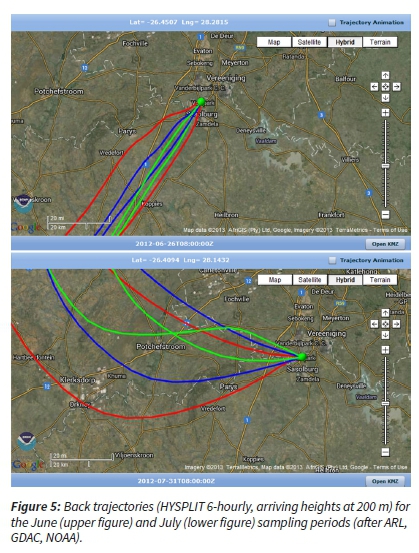
For these two anomalous months (June and July), air mass movement and origin were investigated. The wind speeds during these sampling periods increased and the back trajectory analysis for the sampling period indicated that the air masses were overpassing from the S-SW (June) and NW-W (July) directions (Figure 5) (ARL, GDAC, NOAA, 2013). The prevailing air mass originated from cleaner and essentially background regions. This influenced the aerosol concentrations at the sampling site. Therefore, these questionable concentrations could be attributed to the intrusions of cleaner air masses that changed the prevailing ambient air concentrations (Figure 5).
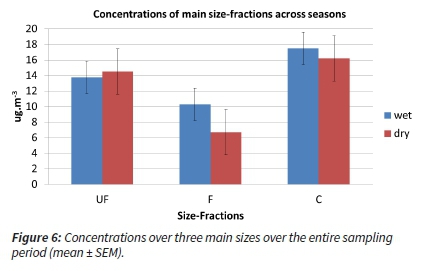
Considering the concentrations averaged over the main sizes across the two main seasons, the following trend is evident: overall, the coarse fraction was recorded highest and Ultra-Fine 2nd highest concentrations over both seasons (Figure 6). The fine fractions were lower in both seasons.
The concentrations of BC, OC and TC for the three size-fractions and across the two main seasons were determined. Whatever the season, the highest carbonaceous concentrations were observed in the UF fraction, followed in C fraction and then in F fraction (Table 1). Both the organic carbon (OC) and black carbon (BC) had higher concentrations in the dry season compared to the wet season for all fractions.
In general, the concentrations of OC were higher than those of BC, whatever the season, except for the fine fraction.
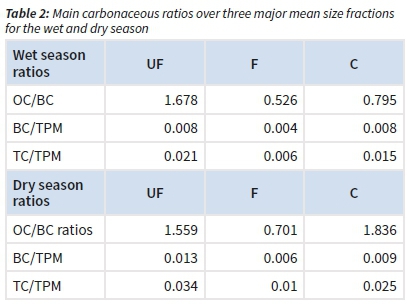
The following ratios, i.e. OC/BC, BC/TPM (total particulate matter) and TC/TPM concentration ratios were considered for each season and were higher in the dry season (except for the UF OC/ BC ratio). The highest ratios of OC/BC, BC/TPM and TC/TPM were found for the ultra-fine fraction (UF), followed by the coarse (C) and fine (F) fraction during the wet season (Table 2). For the dry season, the OC/BC ratio was the highest. The lowest ratios were found for each BC/TPM and TC/TPM in the wet season (Table 2).
Aethalometer measured BC trends
Since this instrument ran continuously, the diurnal trend for the equivalent BC was determined using the mean BC results obtained from the absorptions near infrared (880 nm) wavelength (Hansen et al., 1984). The results are presented as two main South African Highveld seasons (Figure 7).
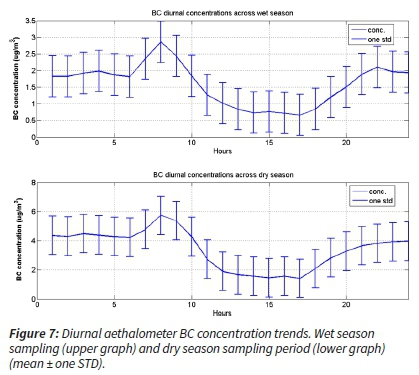
The observed bimodal diurnal distribution is typical of the BC pollution reported (and PM25 and PM10 trends) for South Africa's low-cost residential settlements over the SA Highveld region (Hersey et al., 2015; Venter et al., 2012). However, the morning peaks of the Vaalpark aethalometer BC data appear higher than the evening peaks for both seasons. As expected, the dry period had higher concentrations overall. However, the evening peak was lower than the morning peak. The mid-day to mid-afternoon diurnal concentration levels were low. Should there be much industrial pollution reaching/impacting the sampling site, these concentrations would be higher after the break of nocturnal and development of convective boundary layer, ~3-4h after sunrise (Korhonen et al., 2014; Gierens et al., 2018)
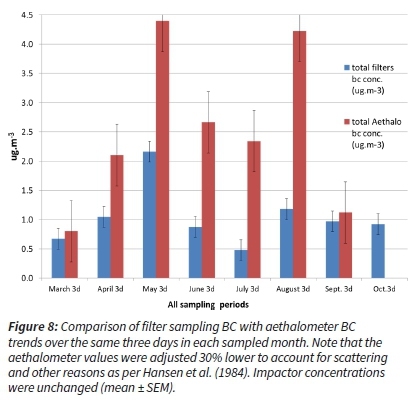
Inter-comparison of aethalometer BC with filter determined BC content
The comparison of BC results from filter analysis and aethalometer data obtained for the same days is shown in Figure 8. Both sets of data followed a similar trend during the entire sampling period, gradually increasing in concentrations from the late spring towards winter and higher levels over winter as expected. Although there were substantial differences between their absolute values, it needs to be taken into account that the filter sampling ran 12 h a day while the aethalometer measured 24 h. As elaborated earlier, the June and July 'dip' in the trend level is explained by the cleaner air mass overpasses (HYSPLIT modelled back trajectories, ARL, NCAR, NOAA, 2013). This is also evident when both datasets for the same period were plotted alongside one another (Figure 8).
Ionic aerosol content
The content of important non-carbonaceous compounds was also determined. To a certain extent, the ionic concentrations reflect similar trends to the carbonaceous measurements.
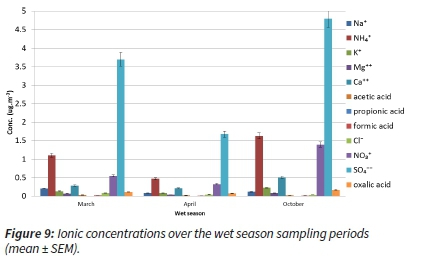
We considered the ionic concentrations over the two main sampling season periods and also per species (Figure 9).
Considering the dry season months, the concentrations in the May, August and September sampling periods followed the well-known trends of increased concentrations of S and N compounds. However, two mid-dry season sampling months (June and July) were at much lower levels (Figure 10).
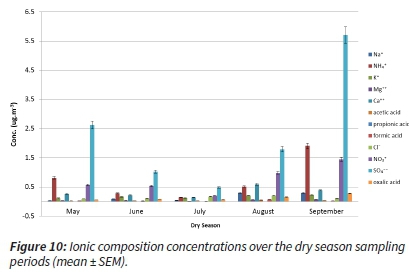
The same reason for the lower concentration levels was applicable, as in case of carbonaceous content concentrations: the sampling site weather played a crucial role - having been influenced by the cleaner air masses arriving from the regional background. This background has neither much industrial and residential burning, nor wildfires. Similarly, the emissions from traffic in the regional background are also limited.
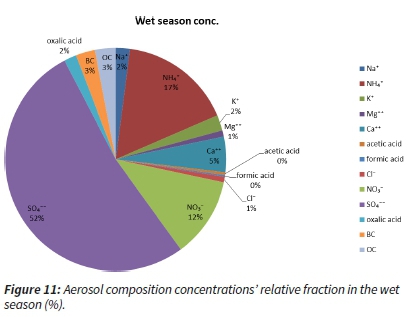
Relative contributions of aerosol components
Considering the wet season, it is evident that the sulphate, ammonium and nitrate were dominant species (Figure 11). Black carbon and organic carbon appear almost equally (~3 %). However, the majority of the aerosol content was sulphate, and this fact points to the prevailing anthropogenic origin of the aerosol sampled at the sampling site. Together with nitrate and ammonium, these compounds represent more than two-thirds of the filter-sampled aerosol content (Figure 11).
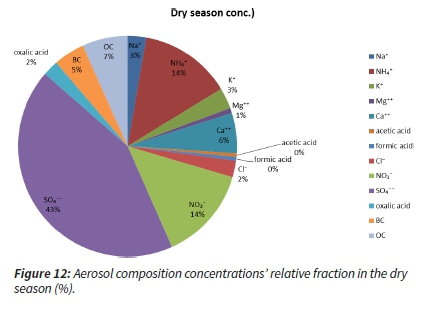
The dry season had just slightly different aerosol composition concentrations. The fractions of sulphate (45 %) and ammonium (14 %) were lower, while the relative fractions of BC (5 %), OC (7 %) and nitrate (14 %) increased. This points to an increased influence of the biomass and residential fossil fuel burning and not necessarily a decrease in industrial emissions (Figure 12).
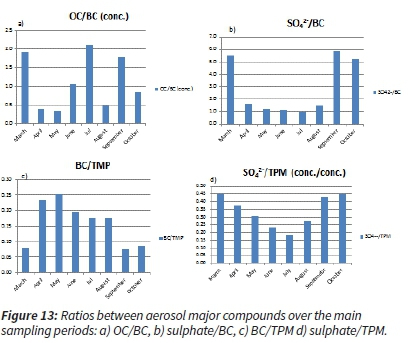
It is also essential to look at the ratios between the major ions and the BC and OC with regard to the total particulate matter (TPM).
The higher sulphate ratios within TPM and higher sulphate over BC ratios indicate the prevalence of industrial combustion emissions, while increased BC/TPM ratios indicate the prevalence of domestic and biomass burning combustion emissions. The lack of higher sulphate ratios in the dry season can be explained by the fact that most of the production (petrochemical and metallurgical industries) stacks are designed to be high, over ~200 m (Beukes et al., 2012, Held et al., 1996), so the emissions are released aloft the inversion capping layer in the colder and drier part of the year. The reduced moisture content also impedes the formation of sulphate (and nitrate), leaving the residential and traffic pollution content higher, likely emanating from within, as well as farther from the concerned area (Figure 13 a-d).
The linear regression as the coefficient of correlation (Pearson), between each of ions, was calculated, and the output (R) has been indicated as a matrix. Certain high correlations (in dark red) and some low to anti-correlations (in yellow, green and blue) have been revealed (Figure 14).
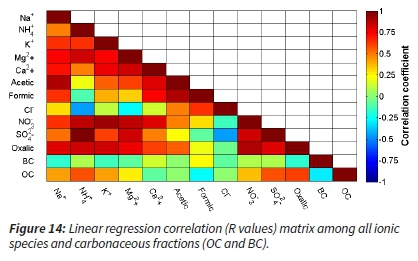
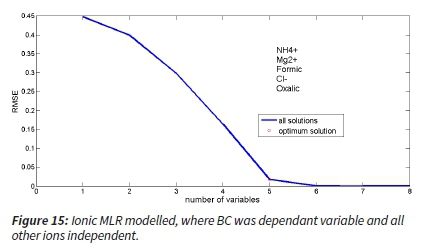
The correlation calculations did not indicate any unexpected association. To gain more insight into the species correlations, a multiple-linear regression (MLR) with root mean square error (RMSE) output was modelled using Matlab® for all the main ions, taking BC as the dependent variable, while others were left as an independent.
The model output (MLR) also indicated that the Mg2+, Cl- and oxalic were negatively associated and NH4+ and formic positively with BC. The model showed that to accurately predict BC (i.e. the change in RMSE reaches a minimum), NH4+, Mg2+, Formic, Cl- and oxalic were the most important and the OC was less significant (Figure 15).
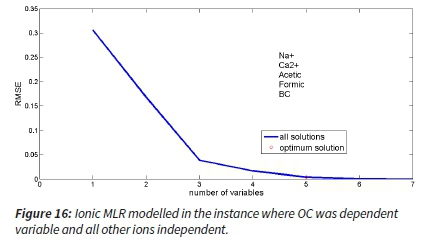
Another multiple-linear regression with RMSE was modelled for all the main ions taking OC as the dependent variable while others were left as an independent. This MLR output indicated that the acetic ions and BC are negatively associated, while Na+, Ca2+ and formic ions are positively associated with OC. Modelled showed that to accurately predict OC (i.e. the change in RMSE reaches a minimum), Na+, Ca2+, Acetic, Formic and BC were the most important (Figure 16).
Aerosol oxidative potential
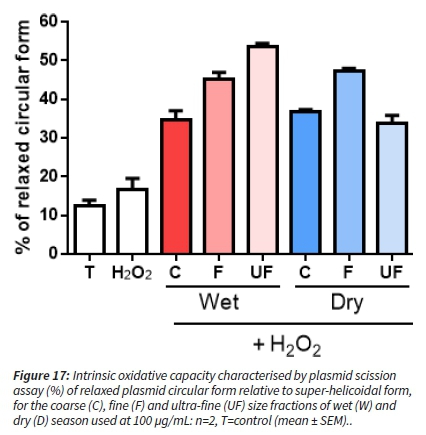
Plasmid assay results
To induce DNA breaks, the production of free radicals, such as hydroxyl radical (ΟΗ·), is needed. Adding H2O2 (reactive oxygen species) to the incubation mixture allows the Fenton reaction to take place, if there is the presence of transition metals in the aerosol. All samples increased the production of DNA damages as measured by the relaxation of the plasmid DNA by comparison with the control (T) and H2O2 (reactive oxygen species) alone, suggesting the presence of transition metals. The effects of aerosol from the wet season were increasing as the PM size was decreasing. For the dry season, the F fraction is the most reactive, whereas C and UF exhibited a similar effect (Figure 17).
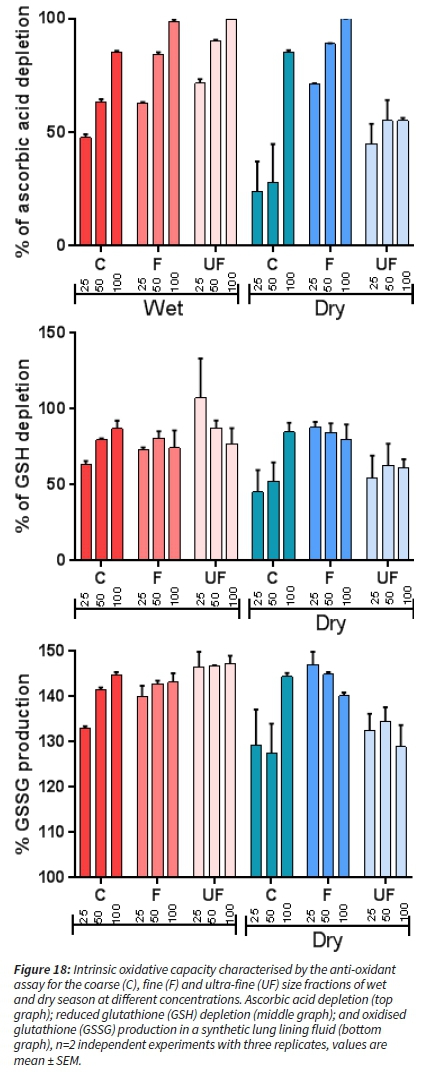
Anti-oxidant depletion assay results
All samples induced an ascorbic acid (AA) and glutathione (GSH) depletion (Figure 18 top and middle) with concomitant production of oxidised glutathione (GSSG) (Figure 18 bottom). There was no depletion of uric acid (UA) for either season or different dilutions (therefore not shown). For wet season samples, there is a trend of more AA and GSH depletion as the aerosol fraction size is decreasing. For the dry season aerosols, we observed a stronger effect of the fine fraction compared to the other size fractions. The coarse fraction depleted AA and GSH only at the highest concentrations tested.
DTT consumption assay results
All samples induced a significant dose-dependent DTT depletion (Figure 19). For wet season samples, as seen for plasmid assay and anti-oxidant depletion assays, we observed that as the size is decreasing, the DTT depletion was more pronounced and significantly different for the ultrafine fraction compared to the fine and coarse fractions. The DTT depletion was generally more pronounced with PM from the wet season considering the same size fraction. For the dry season, the higher effect was observed for the fine fraction and is significant at the highest concentration, whereas the other size fractions exhibited similar oxidative potential (OP) (Figure 19).
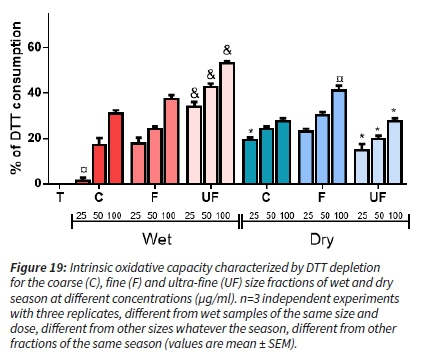
The three OP assays consistently showed that for aerosols sampled in the wet season, the OP tends to increase as the size is decreasing. By contrast, for the dry season, the size-fraction exhibiting the highest OP is the fine mode. The UF fraction showed the most contrasting OP between the two seasons.
Discussion
To a certain extent, the gravimetric mass of the filter samples was low, and we attribute this to the type of the environment where the sampling was taken, i.e. an affluent, fully electrified residential neighbourhood, as well as to the prevailing weather patterns effectively upwind from the nearby pollution sources. However, the aerosols still contained representative mixtures of chemical compounds, such as sulphate, nitrate and ammonium, strongly indicating the prevalence of the anthropogenic sources. The carbonaceous content of both organic and black carbon was not high, and they are mostly similar in content in both seasons, although an evident higher organic content in the dry season indicates the typical influence of the biomass burning season, which is prevalent in the 2nd part of the dry season (from midwinter to mid-spring).
The diurnal pattern seen from the continuous data indicates bimodal peaks, with the morning peak being higher than the evening peak. The plausible explanation is that the traffic into and around the area and some residential fossil fuel burning increase concentrations in the morning. While the evening peak is not as pronounced, it is indicative of reduced emissions in comparison to the morning peaks (reduced traffic and reduced residential burning). This is understandable for the sampling site, which is in a residential electrified area and although a number of electrified households in SA use fossil fuels for heating, this activity is less pronounced than in low-income settlements (Hersey et al., 2015; Venter et al., 2012).
A question was posed why the concentrations of major ionic compounds (being characteristic of industrial combustion emissions) in March and October were similar compared with the months in the dry season (May, September). We attribute this to the regular existence of a more turbulent boundary layer (with higher solar radiation and fewer inversions and horizontal stratification) allowing entrainment/fumigation of the pollution from the industrial sources nearby. The months of March and October fit this description, although April concentrations were reduced, and the April period meteorology had played a determining role.
It is important to point to the presence of some carboxylic acids (oxalic, formic, acetic) found among particulate organic matter. However, similar relative content of these carboxylic acids in both seasons indicates that there are a number of sources/precursors of these species during both seasons. Since the main precursors to carboxylic acids are VOC (from both anthropogenic and biogenic sources), their presence throughout the year is expected. The degradation of anthropogenic hydrocarbons photo-chemically, as well as oxidation of isoprene and monoterpene emissions, leads to the formation of such acids (Herrmann et al., 2005; Lim et al., 2005). Among the identified carboxylic acids, oxalic acid is the most abundant compound in both seasons. Oxalic acid is frequently observed as one of the most abundant single organic compounds in tropospheric particles. Sources of oxalic acid in the atmosphere are numerous. Biomass burning (Yamasoe et al., 2000) and vehicular exhaust (Kawamura and Kaplan, 1987) are two primary emission sources for oxalic acid.
Atmospheric oxidation processes provide secondary mechanisms for oxalic acid formation from both anthropogenic and biogenic volatile organic compound emissions (e.g. Kerminen et al., 2000; Warneck, 2003).
In the studied environment, there are both types of sources present throughout the year as well as seasonally. While the anthropogenic emissions from industries are more or less constant, plus emission transport from out of the area, the domestic biomass burning is not specific to the case study area, although there are a number of low-income dwellings in its vicinity that rely on biomass burning for cooking and heating. In addition, in the winter months, intentional and spontaneous biomass burning in the form of veld (grassland and savannah) fires is a substantial source of pollutant emissions.
A significant correlation (coefficient of determination) was found between potassium (K) as a well-known fire tracer (Gao et al., 2003; Andreae et al., 1998) with oxalic acid. Correlations between potassium (K) and oxalic acid per seasons resulted in high correlations (R2=0.87 in dry and R2=0.99 in wet season). This indicates that the oxalic acid would be strongly correlated to fire origin, both domestic uses as well as biomass burning seasonal fires.
The US Department of Health and Human Services (1992) indicated that oxalic acid aids a range of detrimental pulmonary impacts. Acetic acid is a strong eye, skin and mucous membrane irritant. Any prolonged skin contact with glacial acetic acid may result in tissue destruction.
Although formic acid shares most of the chemical properties of other carboxylic acids, it has low toxicity. However, the concentrated formic acid is corrosive to the skin (Reutemann and Kieczka, 2002). Such characteristics hint that the carboxylic acids do play a role in OP of collated aerosol.
Interestingly, to the best of our knowledge, this study was the first to compare the OP of PM according to the size fraction in South Africa. It revealed that the fine fraction exhibited a constant OP whatever the season. By contrast, the ultrafine fraction exhibited the highest OP in the wet season compared to the other size fraction, whereas it was equal to the coarse fraction in the dry season. These data suggest the role of the particle composition on the ultrafine OP that would warrant deeper chemical characterisation. We can speculate that metals are involved in OP, since the DNA scission can only occur through hydroxyl radical production that is known to be mediated by transition metals (Crobeddu et al. 2017).
The acidity of the particles due to the significant content in oxalic and formic acid could favour the bioavailability of metals. Size-wise, UF and F fractions of aerosol in both seasons are capable of evident OP when exposed to in-vitro acellular human cell proxies.
Conclusions
Aerosol OP was characterised on particle size fractions collected in a heavily industrialised area at a residential suburb through a set of three different assays. By detecting ROS generated by different particle characteristics, OP can be seen as an integrative indicator of aerosol exposure enabling the prediction of the aerosol effects on human/animal health within the South African context. In this study, in the wet season, the fine (F) and ultra-fine (UF) fractions were proven to exhibit stronger OP compared to the coarse (C) fraction. In addition, the UF fraction had higher OP in the wet season compared to the dry season when elevated pollution levels are usually recorded on the SA Highveld due to its climate and land topography. The investigated air mass movement point out that cleaner (background) air mass influx dominated large periods of the sampling campaign, and that the sampling site is upwind of major pollution sources in the area, such as industrial, and low-cost and slum dwellings. However, should more particulates have been sampled in the dry season, this could have exerted different effects. Nevertheless, the chemical analysis confirmed the predominance of anthropogenic compounds present in collated aerosol - sulphate, nitrate and ammonium.
The role of combustion from transport and residential burning is also evident through the continuous BC sampling having typical bimodal peaks and a much stronger peak in inversion capped the cold and dry season. Furthermore, inevitably, we could pick up evidence of biomass burning, first in BC/OC content and ratios, as well as in the presence of the organic acids, which are generally secondary pollutants resulting from oxidation of VOC. The organic acids emanate from both anthropogenic and biogenic sources such as biomass burning, transport emission as well as industrial production and effluents such as carboxylic acids.
Overall, the sampled aerosols represent the majority of the pollution sources being present well in the atmosphere of the wider area and are not mainly and only generated by the industrial emission despite being so spatially close to major chemical and metallurgical industries. Residential use of fossil and biomass burning with seasonal veld fires contributes to emissions of solid particulate matter in the area. In terms of overall health effect, by considering the OP assays, we showed significant oxidative properties for the finer sizes and in the more turbulent atmosphere, although the main chemical contributors to OP could not be determined. Combined aerosol characterisations, including OP with experimental biological studies, with relevant target cells in vitro (and ex vivo), are necessary to decipher the link between chemical composition, OP and cellular oxidative stress within the context of South African aerosols. Such in vitro studies would allow establishing the predictivity of OP as an exposure indicator to be used in epidemiological studies.
Acknowledgements
We acknowledge the French GDRI for making possible the collaboration between the French and SA institutions as well as the NRF, its SA counterpart, in this collaboration. We also kindly thank the SAWS for the provision of rainfall data and SASOL Ltd for the provision of wind data.
References
Air Resources Laboratory, Gridded Meteorological Data Archives, [online] available at http://www.arl.noaa.gov/archives.php ([accessed November 2013]. [ Links ]
Andreae, M. O., Andreae, T. W., Annegarn, H., Beer, J., Cachier, H., le Canut, P., Elbert, W., Maenhaut, W., Salma, I., Wienhold, F. G., Zenker, T. 1998 Airborne studies of aerosol emissions from savanna fires in southern Africa, 2, Aerosol chemical composition, J. Geophys. Res., 103, 32,119-32,128. https://doi.org/10.1029/98JD02280 [ Links ]
Assamoi E-M., Liousse C. 2010, A new inventory for two-wheel vehicle emissions in West Africa for 2002. Atmos. Environ, 44:38693996. https://doi.org/10.1016/j.atmosenv.2010.06.048 [ Links ]
Beukes, P., Dawson, N., van Zyl, P. G. 2010. Theoretical and practical aspect of Cr (VI) in the South African FeCr industry, S. African Inst. Min. M., 110, 743-750. [ Links ]
Boko, M. I., Niang, A., Nyong, C., Vogel, A., Githeko, M., Medany, B., Osman-Elasha, R., Tabo, Yanda, P. Africa, in. Climate Change 2007: impacts, adaptation and vulnerability. The contribution of working group II to the fourth assessment report of the intergovernmental panel on climate change, edited by Parry, M. L., Canziani, O. F., Palutikof, J. P., van der Linden, P. J., and Hanson, C. E. Cambridge University Press, Cambridge UK, 433-467. [ Links ]
Boogaard, H., Janssen, N.A.H., Fischer, P.H., Kos, G.P.A., Weijers, E.P., Cassee, F.R., van der Zee, S.C., de Hartog, J.J., Brunekreef, B., Hoek, G., 2012. Contrasts in oxidative potential and other particulate matter characteristics collected near major streets and background locations. Environ Health Perspect. 120, 185191. https://doi.org/10.1289/ehp.1103667 [ Links ]
Booyens, W., Van Zyl, P.G., Beukes, J.P., Ruiz-Jimenez, J., Kopperi, M., Riekkola, M., Josipovic, M., Venter, A.D., Jaars, K., Laakso, L. 2015. Size-resolved characterisation of organic compounds in atmospheric aerosols collected at Welgegund, South Africa. J Atmos. Chem. 72, 43-64. https://doi.org/10.1007/s10874-015-9304-6 [ Links ]
Borm, P.J.A, Kelly, F., Künzli, N., Schins, R.P.F., Donaldson, K., 2007. Oxidant generation by particulate matter: from biologically effective dose to a promising, novel metric. Occup. Environ Med; 64, 73-74. https://doi.org/10.1136/oem.2006.029090 [ Links ]
Butt E. W., Rap, A., Schmidt, A., Scott, C. E., Pringle, K. J., Reddington, C. L., Richards, N. A. D., Woodhouse, M. T., Ramirez-Villegas, J., Yang, H. 2016. The impact of residential combustion emissions on atmospheric aerosol, human health, and climate. Atmos. Chem. Phys., 16, 873-905. https://doi.org/10.5194/acp-16-873-2016 [ Links ]
Cachier H, Brémond MP, Buat-Ménard P: 1989. Determination of atmospheric soot carbon with a simple thermal method. Tellus B Chem. Phys. Meteorol., 41(B):379-390. https://doi.org/10.3402/tellusb.v41i3.15095 [ Links ]
Cassee F.R., Héroux M.E., Gerlofs-Nijland M.E., Kelly F.J. 2013. Particulate matter beyond mass: recent health evidence on the role of fractions, chemical constituents and sources of emission. Inhal. Toxicol. (14):802-12. https://doi.org/10.3109/08958378.2013.850127 [ Links ]
Celo, V., Dabek-Zlotorzynska, E., Mathieu, D., Okonskaia, I. 2010; Validation of a Simple Microwave-Assisted Acid Digestion Method Using Microvessels for Analysis of Trace Elements in Atmospheric PM2.5 in Monitoring and Fingerprinting Studies. The Open Chemical and Biomedical Methods Journal 3, 143-152. https://doi.org/10.2174/1875038901003010143 [ Links ]
Crobeddu B., Aragao-Santiago L., Bui L.C., Boland S., Baeza Squiban A. 2017. Oxidative potential of particulate matter 2.5 as predictive indicator of cellular stress. Environ Pollut. 230,125-133. https://doi.org/10.1016/j.envpol.2017.06.051 [ Links ]
Donaldson, K., Beswick, P.H., Gilmour, P.S. 1996. Free radical activity associated with the surface of particles: A unifying factor in determining biological activity? Toxicol Lett., 88, 293-298. https://doi.org/10.1016/0378-4274(96)03752-6 [ Links ]
Doumbia, E.H.T., Liousse, C., Galy-Lacaux C., Ndiaye, S.A., Diop, B., Ouafo, M Assamoi, E.M., Gardrat, E., Castera, P., Rosset, R., Akpo, A., Sigha, L. 2012. Real-time black carbon measurements in West and Central Africa urban sites. Atmos. Environ. 54, 529-537. https://doi.org/10.1016/j.atmosenv.2012.02.005 [ Links ]
Eck T. F., Holben B. N., Ward D. E., Mukelabai M., M. Dubovik O., Smirnov A., Schafer J. S., Hsu N. C., Piketh, S. J., Queface, A., Le Roux J., Swap R. J., Slutsker, I. 2003. Variability of biomass burning aerosol optical characteristics in southern Africa during the SAFARI 2000 dry season campaign and a comparison of single scattering albedo estimates from radiometric measurements, J. of Geophys Res.-Atmos, Volume 108, issue D13. https://doi.org/10.1029/2002JD002321 [ Links ]
Favez, O, Haddad, I. E, Piot, C., Bor'eave, A., Abidi, E., Marchand, N., Jaffrezo, J.-L., Besombes, J.-L., Personnaz, M.-B., Sciare, J. 2010. Inter-comparison of source apportionment models for the estimation of wood burning aerosols during wintertime in an Alpine city (Grenoble, France). Atmos. Chem. Phys., 10, 5295-5314. https://doi.org/10.5194/acp-10-5295-2010 [ Links ]
Freiman, T. and Piketh, S. J. 2002. Air Transport into and out of the Industrial Highveld Region of South Africa, Journal of Applied Meteorology, 42, 994-1002. https://doi.org/10.1175/1520-0450(2003)042<0994:ATIAOO>2.0.CO;2 [ Links ]
Gao, S., D. A. Hegg, P. V. Hobbs, T. W. Kirchstetter, B. I. Magi, and M. Sadilek. 2003. Water-soluble organic components in aerosols associated with savanna fires in southern Africa: Identification, evolution, and distribution, J. Geophys. Res., 108(D13), 8491. https://doi.org/10.1029/2002JD002324 [ Links ]
Garstang, M., Tyson, P.D., Swap, R., Edwards, M., Kallberg, P., Lindesay, J.A. 1996. Horizontal and vertical transport of air over southern Africa. Journal of Geophysical Research-Atmospheres, 101, 23721-23736. https://doi.org/10.1029/95JD00844 [ Links ]
Gierens, R. T., Henriksson, S., Josipovic, M., Vakkari, V., van Zyl, P. G., Beukes, J. P., Wood, C. R. and O'Connor, E. J. 2018. Observing continental boundary-layer structure and evolution over the South African savannah using a ceilometer, Theor. Appl. Climatol., 1-14. https://doi.org/10.1007/s00704-018-2484-7 [ Links ]
Hansen, A.D.A., Rosen, H., Novakov, T. 1984; The aethalometer -An instrument for real-time measurement of optical absorption by aerosol particles. The Science of The Total Environment, 36, 191-196. https://doi.org/10.1016/0048-9697(84)90265-1 [ Links ]
Herrmann, S.M., Anyambab, A., Tucker, C.J. 2005. Recent trends in vegetation dynamics in the African Sahel and their relationship to climate. Global Environmental Change 15, 394-404. https://doi.org/10.1016/j.gloenvcha.2005.08.004 [ Links ]
Hersey, S. P., Garland, R., M. Crosbie, E, Shingler, T., Sorooshian, A., Piketh, S., Burger, R. 2015. An overview of regional and local characteristics of aerosols in South Africa using satellite, ground, and modelling data, Atmos. Chem. Phys., 15, 4259-4278, www.atmos-chem-phys.net/15/4259/2015/. https://doi.org/10.5194/acp-15-4259-2015 [ Links ]
Hirsikko, A., Vakkari, V., Tiitta, P., Manninen, H. E., Gagne, S., Laakso, H., Kulmala, M., Mirme, A., Mirme, S., Mabaso, D., Beukes, J. P., Laakso, L. 2012. Characterisation of sub-micron particle number concentrations and formation events in the western Bushveld Igneous Complex, South Africa. Atmos. Chem. Phys., 12, 3951-3967. https://doi.org/10.5194/acp-12-3951-2012 [ Links ]
Kampa, M. and Castanas, E. 2008. Human health effects of air pollution, Environmental Pollution, 151, 362-367. https://doi.org/10.1016/j.envpol.2007.06.012 [ Links ]
Kawamura, K. and Kaplan, I. R. 1987. Motor Exhaust Emissions as a Primary Source for Dicarboxylic Acids in Los Angeles Ambient Air. Environ. Sci. Technol., 21, 105-110. https://doi.org/10.1021/es00155a014 [ Links ]
Kerminen V-M., Ojanen, C., Pakkanen, T., Hillamo, R., Aurela, M. and Kinen, J.M. 2000. Low-Molecular-Weight Dicarboxylic Acids In An Urban And Rural Atmosphere, J. Aerosol Sci. Vol. 31, No. 3, pp.349-362. https://doi.org/10.1016/S0021-8502(99)00063-4 [ Links ]
Kimemia, D., Annegarn, H., Makonese, T., Molapo, V. and Robinson, J. 2010. Characterisation of domestic biomass combustion technologies used in Setswetla, Alexandra township, Gauteng, 18 DUE, Cape Peninsula University of Technology, Cape Town, 29-31 March 2010, 167-173, 2010 [ Links ]
Koike, E. and Kobayashi, T. 2006. Chemical and biological oxidative effects of carbon black nanoparticles, Chemosphere,65, 946-951. https://doi.org/10.1016/j.chemosphere.2006.03.078 [ Links ]
Korhonen K, Giannakaki E., Mielonen T., Pfüller, A., Laakso L., Vakkari V., Baars H., Engelmann R., Beukes J.P., Van Zyl P.G., Ramandh A, Ntsangwane L, Josipovic M, Tiitta P., Fourie G., Ngwana I., Chiloane K., Komppula M. 2014. Atmospheric boundary layer top height in South Africa: measurements with lidar and radiosonde compared to three atmospheric models. Atmos Chem Phys 14(8):4263-4278. https://doi.org/10.5194/acp-14-4263-2014 [ Links ]
Kuik, F., Lauer, A., Beukes, J. P., Van Zyl, P. G., Josipovic, M., Vakkari, V., Laakso, L., Feig, G. T. 2015. The anthropogenic contribution to atmospheric black carbon concentrations in southern Africa: a WRF-Chem modelling study. Atmos. Chem. Phys., 15, 8809-8830. https://doi.org/10.5194/acp-15-8809-2015 [ Links ]
Kumagai, Y., Koide, S., Taguchi, K., Endo, A., Nakai, Y., Yoshikawa, T., Shimojo, N. 2002. Oxidation of Proximal Protein Sulfhydryls by Phenanthraquinone, a Component of Diesel Exhaust Particles. Chem. Res. Toxicol, Volume 15, Number 4, pp. 483-489. https://doi.org/10.1021/tx0100993 [ Links ]
Laakso, L., Vakkari, V., Virkkula, A., Laakso, H., Backman, J., Kulmala, M., Beukes, J. P., van Zyl, P. G., Tiitta, P., Josipovic, M., Pienaar, J. J., Chiloane, K., Gilardoni, S., Vignati, E., Wiedensohler, A., Tuch, T., Birmili, W., Piketh, S., Collett, K., Fourie, G. D., Komppula, M., Lihavainen, H., de Leeuw, G., and Kerminen, V.-M. 2012. South African EUCAARI measurements: seasonal variation of trace gases and aerosol optical properties, Atmos. Chem. Phys., 12, 1847-1864. https://doi.org/10.5194/acp-12-1847-2012 [ Links ]
Landrigan, P.J., Fuller, R., Acosta, N. et al. 2018.The Lancet Commission on pollution and health. The Lancet Commissions, 391, 462-512 [ Links ]
Li N., Sioutas, C., Cho, A., Schmitz, D., Misra, M., Sempf, J., Wang, M., Oberley, T., Froines, J. Nel, A. 2003. Ultrafine Particulate Pollutants Induce Oxidative Stress and Mitochondrial Damage, Environ. Health Perspect., 2003 Apr; 111(4): 455-460. https://doi.org/10.1289/ehp.6000 [ Links ]
Life Technologies, Gibco, [online] available at: https://www.thermofisher.com/za/en/home/brands/life-technologies.html [accessed Sept. 2018]. [ Links ]
Lim, L. P., Lau, N.C, Garrett-Engele, P. Grimson, A., Schelter, J. M., Castle, J., Bartel, D. P., Linsley P. S.; Johnson J. M. 2005. Microarray analysis shows that some microRNAs downregulate large numbers of target mRNAs, Nature, volume 433, pages 769-773.https://doi.org/10.1038/nature03315 [ Links ]
Liousse C. and Galy-Lacaux C. 2010. Urban pollution in West Africa. Meteorology, 71, 45-49. https://doi.org/10.4267/2042/37377 [ Links ]
Liousse, C., Cachier, H., Jennings, S.G. 1993. Optical and thermal measurements of black carbon aerosol content in different environments: Variation of the specific attenuation cross-section, sigma (σ). Atmos. Environ. Part A. General Topics, 27, 1203-1211.https://doi.org/10.1016/0960-1686(93)90246-U [ Links ]
Mafusire, G., Annegarn, H.J., Vakkari, V. Beukes, J. P. Josipovic, M., van Zyl, P. G. and Laakso, L. 2016. Sub-micrometer aerosols and excess CO as tracers for biomass burning air mass transport over southern Africa, J. Geophys. Res. Atmos., 121. https://doi.org/10.1002/2015JD023965 [ Links ]
Magee Scientific®, model AE-42, USA [online] available at: https://mageesci.com/our-products/ae42/ [accessed Sept. 2018]. [ Links ]
Makonese, T., Masekameni, M.D., Annegarn, H.J. Energy use scenarios in an informal urban settlement in Johannesburg, South Africa. In: Proceedings of the domestic use of energy conference, 31 March-2 April 2016. Cape Town: Cape Peninsula University of Technology. 1-6. 10.1109/DUE.2016.7466703. https://doi.org/10.1109/DUE.2016.7466703 [ Links ]
Micro-plate reader Multiskan-EX, Thermo Scientific [online] available at: https://www.selectscience.net/products/thermo-scientific-multiskan-ex/?prodID=10022 [accessed Sept. 2018]. [ Links ]
Occupational Safety and Health Guideline for Acetic Acid, Centers for Disease Control and Prevention, US Department of Health and Human Services, 1992, USA. [ Links ]
Petzhold, A., Kopp, C., Niessner, R. 1997. the dependence of the specific attenuation cross-section on black carbon mass fraction and particle size. Atmos. Environ., 31, 661-672. https://doi.org/10.1016/S1352-2310(96)00245-2 [ Links ]
Pope and Dockery. 2006. Health Effects of Fine Particulate Air Pollution: Lines that Connect. J Air Waste Manag Assoc , 56, 709742. https://doi.org/10.1080/10473289.2006.10464485 [ Links ]
QMA, Whatman, [online] available at: https://www.sigmaaldrich.com/catalog/product/aldrich/wha1851047?lang=en®ion= ZA&gclid=Cj0KCQjwguDeBRDCARIsAGxuU8YlRrKbuCUdYmuk qj9H8cjLs3A70-Y6Rg9j4ciLSbjfDPc091Xmeg8aAnpuEALw_wcB [accessed Sept. 2018]. [ Links ]
Ramgolam K., Favez O., Cachier H., Gaudichet A., Marano F., Martinon L., Baeza-Squiban A. 2009. Size-partitioning of an urban aerosol to identify particle determinants involved in the proinflammatory response induced in airway epithelial cells, Part Fibre Toxicol, 6:10. https://doi.org/10.1186/1743-8977-6-10 [ Links ]
Reutemann W. and Kieczka H. 2002. Formic Acid in Ullmann's Encyclopedia of Industrial Chemistry, Wiley-VCH, Weinheim. [ Links ]
Ross, K.E., Piketh, S. J., Bruintjes, R. T., Burger, R. P., Swap, R. J., Annegarn, H. J. 2003. Spatial and seasonal variations in CCN distribution and the aerosol-CCN relationship over southern Africa. J. of Geophys Res.-Atmos 108, 8481-8498. https://doi.org/10.1029/2002JD002384 [ Links ]
Sauvain, J., Deslarzes, S., Riediker, M. 2008. Nanoparticle reactivity toward dithiothreitol. Nanotoxicology, 2, 121-129. https://doi.org/10.1080/17435390802245716 [ Links ]
Seinfeld, J. H. and Pandis, S. N. 2006. Atmospheric Chemistry and Physics: from Air Pollution to Climate Change, 2nd Edition, J. Wiley & Sons, New York. [ Links ]
Sundström, A.-M., Nikandrova, A., Atlaskina, K., Nieminen, T., Vakkari, V., Laakso, L., Beukes, J.P., Arola, A., Van Zyl, P.G., Josipovic, M., Venter, A.D., Jaars, K., Pienaar, J.J., Piketh, S., Wiedensohler, A., Chiloane, E.K., De Leeuw, G. and Kulmala, M. 2015. Characterization of satellite-based proxies for estimating nucleation mode particles over South Africa, Atmos. Chem. Phys.,15, 4983-4996. https://doi.org/10.5194/acp-15-4983-2015 [ Links ]
Swap R.J., Annegarn, H.J., Suttles, J.T., King, M.D., Platnick, S., Privette, J.L., Scholes, R.J. 2003. Africa burning: A thematic analysis of the Southern African Regional Science Initiative (SAFARI 2000). J Geophys Res Atmos 108, 8465-8479. https://doi.org/10.1029/2003JD003747 [ Links ]
The Government Gazette Republic of South Africa, 4 May 2007 No. 29864, [online] available at http://www.info.gov.za/view/DownloadFileAction?id=73046 [accessed October 2013]. [ Links ]
Tiitta, P., Vakkari, V., Croteau, P., Beukes, J. P., van Zyl, P. G., Josipovic, M., Venter, A. D., Jaars, K., Pienaar, J. J., Ng, N. L., Canagaratna, M. R., Jayne, J. T., Kerminen, V. M., Kokkola, H., Kulmala, M., Laaksonen, A., Worsnop, D. R., and Laakso, L. 2014. Chemical composition, main sources and temporal variability of PM1 aerosols in southern African grassland, Atmos. Chem. Phys., 14, 1909-1927. https://doi.org/10.5194/acp-14-1909-2014 [ Links ]
Tyson, P. D. and Preston-Whyte, R. A. 2000. The Weather and Climate of Southern Africa, Oxford University Press, Oxford, UK. [ Links ]
Ultrasonic Processor, Bioblock Scientific [online] available at: https://www.fishersci.com/us/en/products/ITN31F6R/equipment-instruments.html [accessed Sept. 2018]. [ Links ]
Vakkari, V., Beukes, J. P., Laakso, H., Mabaso, D., Pienaar, J. J., Kulmala, M., Laakso, L. 2013. Long-term observations of aerosol size distributions in semi-clean and polluted savannah in South Africa. Atmos. Chem. Phys., 13, 1751-1770. https://doi.org/10.5194/acp-13-1751-2013 [ Links ]
Val S., Martinon L., Cachier H., Yahyaoui A., Marfaing H., Baeza-Squiban A. 2011. Role of size and composition of traffic and agricultural aerosols in the molecular responses triggered in airway epithelial cells. Inhal. Toxicol. 23 (11):627-640. https://doi.org/10.3109/08958378.2011.599445 [ Links ]
Val, S., Liousse, C., Doumbia, E.H.T., Galy-Lacaux, C., Cachier, H., Marchand, N., Badel, A., Gardrat, E., Sylvestre, A., Baeza-Squiban, A. 2013. Physico-chemical characterization of African urban aerosols (Bamako in Mali and Dakar in Senegal) and their toxic effects in human bronchial epithelial cells: description of a worrying situation. Particle and Fibre Toxicol. 10:10. https://doi.org/10.1186/1743-8977-10-10 [ Links ]
Venter, A.D., Vakkari, V., Beukes, J.P., van Zyl P.G., Laakso, H., Mabaso, D., Tiitta, P., Josipovic, M., Kulmala, M., Pienaar, J.J., Laakso, L. 2012. An air quality assessment in the industrialised western Bushveld Igneous Complex, South Africa, S. Afr. J. Sci. 108, 1059. https://doi.org/10.4102/sajs.v108i9/10.1059 [ Links ]
Warneck, P. 2003. In-cloud chemistry opens a pathway to the formation of oxalic acid in the marine atmosphere. Atmos. Environ., 37, 2423-2427. https://doi.org/10.1016/S1352-2310(03)00136-5 [ Links ]
Yamasoe, M.A., Artaxo, P., Miguel, A.H., Allen, A.G. 2000. Chemical composition of aerosol particles from direct emissions of vegetation fires in the Amazon Basin: water-soluble species and trace elements. Atmos. Environ., 34, 1641-1653. https://doi.org/10.1016/S1352-2310(99)00329-5 [ Links ]
Zefluor, Pall Corporation [online] available at: https://www.opticsplanet.com/pall-zefluor-ptfe-membrane-filters-pall-life-sciences-p5pj047.html [accessed Sept. 2018]. [ Links ]
Received: 4 February 2019
Reviewed: 20 March 2019
Accepted: 25 August 2019

