


Services on Demand
Article
 English (pdf)
 Article in xml format
 Article references
Indicators

Related links
-
 Cited by Google
 -
 Similars in Google
Share

 Permalink
Clean Air Journal
On-line version ISSN 2410-972X
Print version ISSN 1017-1703
Clean Air J. vol.29 n.2 Pretoria 2019
http://dx.doi.org/10.17159/caj/2019/29/2.7500
RESEARCH ARTICLE
Measurement of atmospheric black carbon in some South Mediterranean cities: Seasonal variations and source apportionment
Hamza MerabetI, II; Rabah KerbachiII; Nikolaos MihalopoulosIII, IV; Iasonas StavroulasIV, V; Maria KanakidouIV; Noureddine YassaaI, VI
ICentre de Développement des Energies Renouvelables, CDER, BP. 62 Route de l'Observatoire Bouzaréah16340 Algiers, Algeria, h.merabet@cder.dz, n.yassaa@cder.dz
IILaboratoire des Sciences et Techniques de l'Environnement, Ecole Nationale Polytechnique, 10, Hassan Badi Avenue, El Harrach, Algiers, Algeria, r_kerbachi@yahoo.fr
IIIInstitute of Environmental Research and Sustainable Development (IERSD), National Observatory of Athens (NOA), Athens 152 36, Greece, mihalo@uoc.gr
IVEnvironmental Chemistry Processes Laboratory, Department of Chemistry, University of Crete, Heraklion, P.O. Box 2208, 70013, Greece, mariak@uoc.gr
VEnergy Environment and Water Research Center, The Cyprus Institute, Nicosia 2121, Cyprus, stajas@gmail.com
VILaboratoire d'Analyse Organique Fonctionnelle, Faculté de Chimie, Université des Sciences et de la Technologie Houari Boumediene, BP 32, El-Alia, Bab-Ezzouar, 16111 Alger, Algérie
ABSTRACT
This study aims to investigate, for the first time in Algeria, the atmospheric black carbon (BC) concentrations over one year measured at the Scientific Observatory of Algiers and to compare their concentration levels with other Mediterranean cities (i.e., Athens and Crete). The diurnal cycles as well as seasonal variations of BC concentrations were evaluated and attributed to their emission sources (fossil fuel: BCff and wood burning: BCwb). The annual mean concentrations of BC, BCff and BCwb were 1.113±2.030, 1.064±2.002 and 0.049±0.262 μgm-3, respectively. The highest seasonal mean concentrations were recorded in summer and autumn with 1.283±1.346 and 1.209±1.149 μgm-3 for BC and 1.217±1.431 and 1.177±1.151 μgm-3 for BCff, respectively. However, the lowest mean concentrations were recorded in winter and spring with 1.023±1.189 and 0.966±0.964 μgm-3 for BC and 0.933±1.177 and 0.956±0.874 μgm-3 for BCff, respectively. For BCwb, the highest mean concentrations were reached in winter and summer with 0.090±0.055 and 0.066±0.050 μgm-3, respectively, very likely due to the forest fires and long-range transport of air pollution from Europe. The lowest mean concentrations of BCwb were recorded in autumn and spring with 0.032±0.033 and 0.010±0.021 μgm-3, respectively. Seggregating BC levels into eight wind sectors, showed that the prevailing BC pollution with concentrations reaching up to 5.000 μgm-3 originated from the North-West wind sector. A source apportionment of BC for the wet and dry period was also perfomed followed by a back trajectory cluster analysis for long-range transport.
Keywords: Aerosol, black carbon, atmospheric pollution, source apportionment, seasonal variation, year modulation.
Introduction
Anthropogenic emissions of aerosols in the atmosphere have increased historically affecting air quality, human health and regional radiative forcing (Seinfeld and Pandis, 2006). Soot or black carbon (BC) is considered a reliable indicator of air pollution at a regional scale (Streets et al., 2001). Because of
its submicron diameter, BC is capable of provoking numerous respiratory diseases and impacting the cardiovascular system, penetrating deep into the lungs and being deposited on the pulmonary alveoli (Cheng et al., 2014). Black carbon plays a great role in the climate system and is responsible for direct and semi-direct effects on regional and global climate (Bond et al., 2013; Wang et al., 2015) as it absorbs solar radiation and affects the thermal stability of the atmosphere and precipitation (Jose et al., 2016). BC includes elemental carbon (EC, present as graphite), the dominant light absorbing material, that is generally co-emitted and coated by polycyclic aromatic hydrocarbons and humic-like substances or brown carbons (Andreae and Gelencser., 2006).
In addition, once emitted into the atmosphere, BC is subject to atmospheric aging that leads to particles of aged BC that are internally mixed with soluble components such as sulfates or nitrates and also water soluble organics, which increase aerosol solubility (Jennings et al., 1996). Such particles (aged BC) can contribute to the number concentrations of cloud condensation nuclei (CCN) (Bahadur et al., 2012).
Furthermore, during rainfall the fresh BC, which is not hygroscopic, can be removed from the atmosphere by wet scavenging (below-cloud scavenging), while aged hygroscopic BC particles can be removed both by in-cloud and below-cloud scavenging due to condensation of secondary inorganic aerosols on BC (Gadhavi and Jayaraman, 2010).
The physical and chemical properties of aerosols change significantly when BC is mixed with dust aerosols during dust events (Pu et al., 2015). The binding of organic pollutant particles with BC influences their transport and limits their bioavailability (Ali et al., 2014). It was proved that BC adsorbs strongly to pesticides, polyaromatic hydrocarbons (PAHs), biphenyls (PCBs) and polychlorinated dibenzo-p-dioxins (PCDDs), which can exacerbate water and soil pollution and human disease (Lohmann et al., 2005). BC can travel hundreds to thousands of kilometers in the atmosphere, but in sediments, it can live up to several millions of years (Masiello and Druffel, 1998). During monsoon season, low BC concentrations are associated with higher wind speeds and rainfall (Begam et al., 2016). The diurnal evolution of the atmospheric boundary layer (ABL) is a determinant factor for the variation of BC concentrations during the nighttime (Nair et al., 2007). The surface heating during the daytime increases the ABL height and results in a dilution of atmospheric aerosols in the ABL, thus decreasing BC concentration (Jose et al., 2016). In Algeria, similarly to other southern Mediterranean countries, no detailled studies of BC levels have been reported to date, to the best of our knowledge. The present study aims to document, for the first time, BC air pollution in Algiers through a full year of BC measurement performed at the observatory of Algiers from 1 June 2014 to 31 May 2015.
Experimental
Description of the measurement site
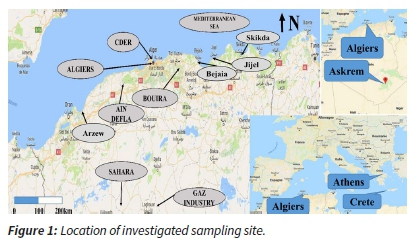
The sampling station is located at the Scientific Observatory of Bouzaréah, Algiers at the Centre de Développement des Energies Renouvelables (CDER). The site is situated at 36.8°N, 3.0°E, at 345m above the sea level in the highest Algiers plateau and at about 1 km from the Mediterranean Sea coast. It is also located about 6 km to the north-west of the Algiers downtown and has no significant industrial and agricultural combustion activities surrounding the sampling site at a distance of several kilometers; however, there is a forest about 3 km to the west (see Figure 1).
Instruments
Aethalometer
From 1 June 2014 to 31 May 2015, continuous BC observations have been performed at a height of 3m above ground level using an aethalometer (model AE-33 of Magee Scientific, USA).
The aethalometer AE33 instrument measures the light beam attenuation in seven wavelengths (370, 470, 520, 590, 660, 880 and 950 nm), operating with a flow rate of 5 L/min, a 1-minute measurement interval and an automatic zero calibration with an accuracy of 0.001 Mgm-3. According to the manufacturer, the instrument sensitivity is 0.03 Mgm-3 at 1 minute and its detection limit is 0.005 Mgm-3 for a 1-hour mean. The aethalometer uses the patented Dual Spot method to compensate for the 'spot loading effect' and provides a real-time output of the 'loading compensation' parameter, which may provide additional information about the physical and chemical properties of the aerosol (aethalometer Model AE33, user manual). The aethalometer AE33 used in the present study is equipped with a sampling head, which has an inlet with a diameter allowing the entry of PM2.5. The BC measured in the present study was obtained by the following equation.

where BC reported . is the BC measured by the aethalometer, reported J' BC zeroloading. ,. is the BC measured by the instrument without loading zeroloading Jο effect, k is the loading compensation parameter, and ATN is the attenuation of light beam in the wavelength of measurement. The equations below are taken from the aethalometer model developed by Sciare et al., (2011). Aerosol absorption coefficients (babs) were obtained by equations 2 and 3.
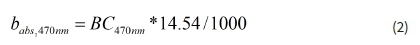
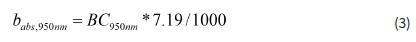
where 14.54 and 7.19 are the Mass Absorption Efficiency (MAE) in the two wavelengths, 470nm and 950nm, respectively, and are provided by the manufacturer. We used the measurements at 470nm in order to avoid the absorption by the dust at 370nm. The equations 4 to 7 enabled the calculation of the BCff (fossil fuel) and BCwb (wood burning).

where babsλ is the light absorption coefficient at the wavelength λ (we used 950nm wavelength), babsff, λ is the light absorption coefficient for the BCff and babswb. λ is the light absorption coefficient of BCwb, affand awbare the Angstrom exponents for fossil fuel and wood burning in Algiers, respectively. The affand awbcalculated by Sciare et al. (2011) were equal to 1 and 2 respectively. The combination of these equations using dedicated software developed by Sciare et al. (2011) was applied for the calculation of BCff and BCwb. In addition to BC, biomass-burning aerosols contain a substantial fraction of organic substances, which absorb in the N-UV and blue part of the spectrum in contrast to the N-IR wavelength range, resulting in awblarger than aff(Zotter et al., 2017). It is also important to mention that BC exists in mixed nature (from fossil fuel and wood burning at the same time).
A calculation of the mass absorption cross-section (MAC) has been performed in this study by using the following equation:
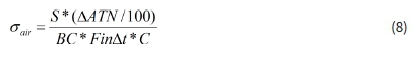
where, S=spot size; t=time, C=multiple scattering parameter (Weingartner et al., 2003), aa/r=mass absorption crossection.
where, Fout=measured flow, ζ= leakage factor.

Where, I0=reference signal and I=spot signal.
Meteorological data
Local meteorological parameters such as air temperature, relative humidity, wind speed and direction, atmospheric pressure and rain intensity were monitored by the CHEMS network of the CDER (composed of a weather and radiometric station) at 5-minute intervals using instruments situated near the aethalometer.
Traffic informations
Two national roads exist near the site about 1 km to the north and about 2km to the east, and roads with light traffic are about 200m to the south-east and 1.5 km to the west of the monitoring site. These roads can be sources of BC emissions. Algiers's car fleet includes more than 1,400,000 vehicles of all categories, with 31.32% using diesel and 68.68% using petrol as of the end of 2014, and about 1 million cars coming daily from the other regions. The car fleet in Algeria is old (51.11% of vehicles' age is greater than 20 years) (http://www.ons.dz/-Au-31-12-2014-.html) and has more than 5,000,000 cars of all categories, with 34.29% powered by diesel versus 65.71% by petrol. Almost all goods are transported by road. Algiers has also a train station, a harbor, an airport, and an industrial area situated at about 4, 5, 25 and 20 km from the measurement site, respectively.
Results and discussion
Monitoring of black carbon
One-year observations of BC, BCff and BCwb with hourly, diurnal, and seasonal evolutions allow better understanding of high pollution events due to the rush hour traffic emissions, wild fires, oil industry to the south, celebration events (coinciding with high BC emissions due to abusive use of pyrotechnic products) and long-range air pollution transport from Europe or neighboring countries.
Black carbon variability
Figure 2 presents BC concentrations recorded at the scientific observatory of Bouzaréah (from 1 June 2014 to 31 May 2015), along with BCff and BCwb calculated for the site. The BC concentrations were recorded at 950 nm wavelength, and the missing data are indicated with blanks. The equal distance between the high peaks is explained by the moving of the tape roll when the attenuation (ATN) at 370 nm reaches 100 (Sciare et al., 2011), which leaves gaps of two to three minutes. BC and BCff concentration levels were high with several peaks reaching 50.000 Mgm-3, however, BCwb values were low and usually close to 0 Mgm-3. The BC, BCff and BCwb mean concentrations were 1.113±2.030, 1.064±2.002 and 0.049±0.262 Mgm-3, respectively. It is worth noting that the BCff represents 95.60% of BC total concentration mass, suggesting that the main BC pollution originated from fossil fuel (traffic and oil industry). It is important to mention that the main source of heating in Algiers and in Algeria in general is natural gas, which is also the principal source of electricity production (96%). Therefore, the predominant BCff emissions are diesel, gasoline and kerosene used in the transport sector.
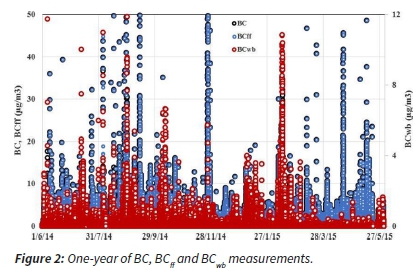
The daily peaks of BC exceeding 5.000 Mgm-3 could be related to forest fires or a regional source (heating) which can be confirmed by the BCwb concentrations, e.g., on 29 August 2014, the mean concentration of BC . from 02:00 to 09:00 was 0.450 Mgm-3. On 4 wb August 2014, BC bmean concentration from 04:00 to midnight (00:00) was 0.180 Mgm-3 and on 7 September 2014, BCwb mean concentration from midnight (00:00) to 15:00 was 0.055 Mgm-3. The yearly percentage of BCff was very high (95.60%), compared to BCwb (4.40%). This result revealed that the main sources of BC in Algeria are local activities and road traffic rather than forest fires and cooking.
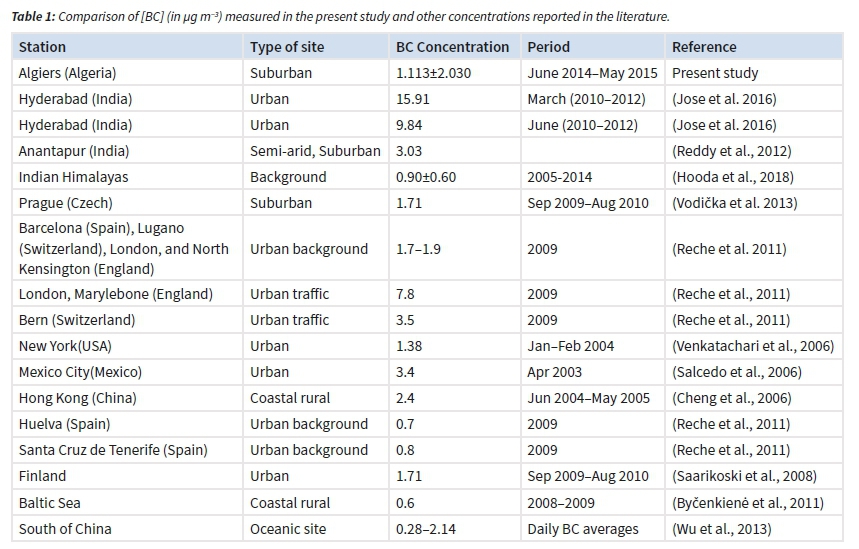
These results could be of great importance for air quality management policy. The measured BC concentrations can be compared with literature data from other locations as presented in Table 1. The annual average of BC recorded at the Algiers Observatory was much lower than that recorded in Anantapur (India), Prague (Czech), Athens (Greece) and Rome (Italy). In contrast, it was higher than measured values in Santa Cruz de Tenerife (Spain), Crete (Greece) and Finland. Chiloane et al., (2017) recorded BC mean concentrations ranging between 0.7 and 1.4 pgm-3 in background sites and sites influenced by industrial activities and/or nearby settlements in South Africa.
A thorough investigation of BC variation in the present study is needed for a comparison and characterization in order to explain these findings.
The highest seasonal mean concentrations of BC, BC and BC were recorded in summer with 1.283±1.346, 1.217±1.431 and 0.066±0.050 Mgm-3, respectively, which could be explained by the scarcity of rains and winds on the one hand and the increase of visitors to the north of Algeria during summer holidays on the other hand. The high BC , levels in summer are attributed to the forest fires recorded during that season.
The second most polluted season was the autumn, where mean concentrations reaching 1.209±1.149 Mgm-3 for BC and 1.177±1.151 Mgm-3 for BCff were recorded, explained by the intensive socioeconomic activity started after the summer holidays which is reflected by the traffic road increase, however, the BCwb mean concentration was lower at 0.032±0.033 Mgm-3due to the decrease of the magnitude of forest fires during this season, and the low use of wood burning in Europe. During winter, the mean concentrations of BC and BCff were lower than in autumn (1.023±1.189 and 0.933±1.177 Mgm-3, respectively); however, the BCwb mean concentration was the highest at 0.090±0.055 Mgm-3, which can be related to air masses originating from Europe and having a high BCwb load (due to domestic heating emissions).
During spring, the mean BC, BCff and BCwb concentrations were the lowest with 0.966±0.964, 0.956±0.874 and 0.010±0.021 Mgm-3, respectively, attributed to air masses coming mostly from the north-west, with low BCwb from Europe (low use of wood and coal for heating in spring), south, and local sources with a very high rate of BCff (98.96%) due to petroleum industry and traffic.
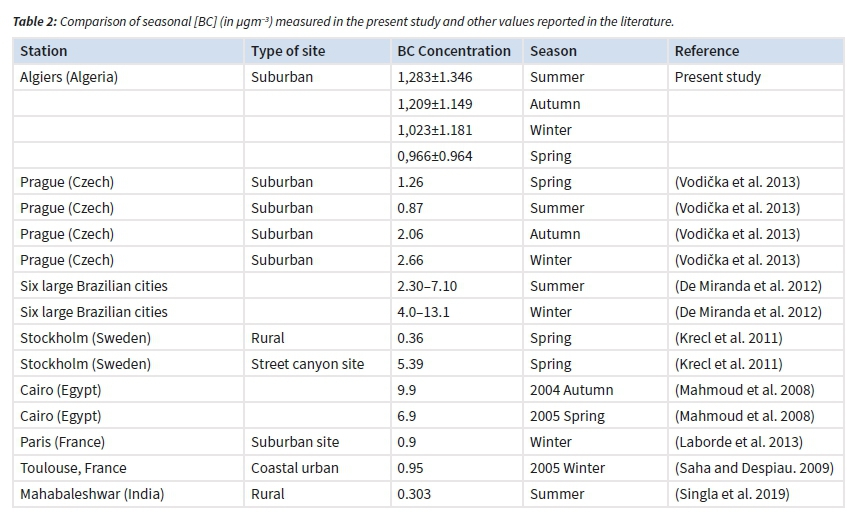
For the sake of comparison, Table 2 reports the seasonal variations of BC measured in this study and those reported in the literature.
The mean concentrations of BC recorded in the present study during summer was higher than those measured in Prague (Czech) and Mahabaleshwar (India). In contrast, the BC concentrations measured in this study were lower than mean concentrations documented for six large Brazilian cities. The results recorded in winter are higher than those measured in Paris and Toulouse, but lower than the mean concentrations obtained in Cairo (Egypt), Prague (Czech Republic) and six large Brazilian cities. For the spring season, the concentration levels were higher than those reported in Stockholm (Sweden), but, lower than the mean concentrations recorded in Prague and Cairo. Finally, during autumn, the mean concentrations recorded in Algiers were lower than those measured in Prague (Czech). The difference between the seasonal mean concentrations of BC recorded in Algiers and other cities could depend not only on the national emissions related to wild fires, industry, and transport, but also on the long-range transport pathways which will be studied in the rest of the study.
Figure 4 displays the seasonal variation of the daytime, nighttime and rush hour mean concentrations of BC, BCff and BCwb, during the studied one-year period.

It shows that during the daytime, spring was the most polluted season with BC and BCff mean concentrations reaching up to 1.427±1.045 and 1.405±1.043 Mgm-3, respectively, followed by the summer season when concentrations of 1.320±0.958 Mgm-3 for BC and 1.241±1.504 Mgm-3 for BCff were recorded.
These high mean concentrations of BC with high rates of BCff reaching 98.46% in spring season can be explained by the decrease of rains, the increase of airflow from the south charged with BCff emitted by oil industry and the air masses coming from Europe.
In summer, the rate of BC concentration was less at 94.00% due to the wild fires emitting BCwb. The lowest mean BC and BC concentrations were recorded in the winter season at 0.985±1.409 and 0.982±1.401 Mgm-3, respectively, which can be explained by the wet scavenging by the rain and the dispersion by winds.
During nighttime, summer is the most polluted season by BC and BCff with concentrations of 1.254±1.306 and 1.183±1.306 Mgm-3, respectively, followed by the autumn season with 0.902±0.779 and 0.886±0.781 Mgm-3, because of the increased use of cars during the night contrary to autumn and winter seasons. It is worth noting that the majority of the industries in Algeria work 24 hours a day, leading to increased emissions of BCff by cars and machines during the night.
As to BC , the highest mean concentrations were recorded wb during the summer followed by the autumn with 0.071±0.571 and 0.066±0.028 Mgm-3 respectively, which is due to the forest fires in summer and wood burning coming from Europe in autumn with a scarcity of rains in Algeria. The lowest BCwb was observed in the spring with 0.003±0.194 Mgm-3, which can be explained by the wet scavenging by rains and the dispersion by winds.
As the cooking and heating in Algeria is from natural gas, the BCwb measured in our study could be due to cooking and heating from Europe and from wild fires during the summer (both in Europe and in Algeria). The BCwb in the daytime was higher than BCwb at night during summer, autumn and spring, which is due to the fires recorded in Algeria in summer with a higher frequency and magnitude of spread during the day than at night and the low use of heating in Europe during spring and autumn. However, in winter, we recorded in Algiers a similar average of BCwb concentration in the daytime and in the nighttime, which could be explained by the long-range transport from Europe with a high use of wood and coal for heating and cooking during the day and the night.
For the BC and BCff average concentrations in rush hours (07:00 and 10:00), summer and autumn were the most polluted with 1.672±1.297 and 1.528±1.167 Mgm-3 for BC and 1.600±1.327 and 1.518±1.171 Mgm-3 for BCff, respectively. These concentrations, which were higher than the yearly average, can be explained by the citizens' behavior during peak hours in Algeria: leaving work and school at the same time, and lunch between midday and 13:00 for most citizens. The seasonal maximum levels of BC during rush hours (between 11:00 and 14:00) were recorded in summer and spring with 0.381±0.232 and 0.183±0.151 Mgm-3, respectively, most likely associated with cooking activities in restaurants and wild fires.
In Figure 5, we present the month-hour variation plot of BC during the period of measurement in Algiers as plotted by Hooda et al. (2018). The figure presents better the variation of BC depending on hours and months and completes the previous interpretations. It is clear that the BC peaks were observed in the summer during the rush hours. The BC concentrations during daytimes were very high during spring months, which is in line with the previous interpretations. The figure summarizes what was presented previously and gives a more precise view of the hourly averages during the months studied.
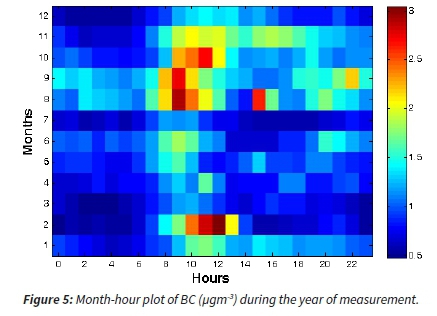
Figure 6 shows the mean diurnal cycle of BC, BCffand BCwb concentrations during the studied period of one year. The diurnal cycle reflects the combined effect of variations in anthropogenic emissions, surface meteorology and ABL dynamics (Ramachandran and Rajesh, 2007). Targino and Krecl, (2017) reported that local traffic was by far the most important source of BC in street canyon in a mid-sized city in southern Brazil, with hourly mean concentration peaking during the rush hours at 5.840 Mgm-3 in the morning at 06:00 and at 4.550 Mgm-3 in the afternoon at 18:00.
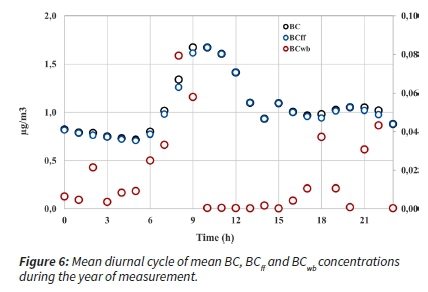
In the present study, the hourly mean concentrations of BC and BCff were higher than 1.300 Mgm-3 between 08:00 and midday (12:00) with maximum concentration of 1.673 Mgm-3 at 09:00, due to the high traffic. In contrast, the concentrations were as low as 0.718 Mgm-3 for BC and 0.709 Mgm-3 for BCff at 05:00. For BCwb, low hourly mean concentrations were recorded with two peaks at 08:00 and 09:00 reaching 0.079 and 0.058 Mgm-3, respectively, most likely related to the indoor and outdoor cooking and heating.
In Figure 7, a comparison of BC daily variability with the means of wind speed (ws) and recorded rainfall has been presented. An inversely proportional relationship between the wind speed and rainfall on the one hand and BC concentrations on the other hand was observed. A statistical study of daily data revealed a correlation between ws and rainfall increase and BC decrease, which is very clear in Figure 7. When ws was less than 5 m.s-1, the BC decreased with a good correlation (correlation coefficient K=0.16); however, BC concentrations increased with the ws higher than 5 m.s-1. This result could be explained by the dispersion of BC pollution when winds are moderate. In contrast, the increase of BC when ws is higher than 5 m s-1 could be due to the atmosphere disruption. Nevertheless, a relationship between rainfall and BC decrease was recorded, with a better correlation when rainfall is less than 3mm. BC dispersion by winds and the wet scavenging by rains can explain the decrease of BC. High wind speed may increase the vertical mixing thereby diluting particles among them black carbon in addition to the dispersion of BC by winds, which decreases the BC concentrations. Low atmospheric boundary layer height and low wind speeds during winter can be also attributed to high accumulation of BC aerosols (Begam et al., 2016).

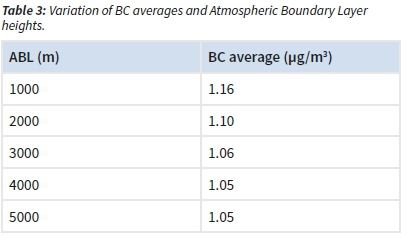
To study the relationship between the atmospheric boundary layer (ABL) and BC concentrations, Table 3 presents the averages of BC vs ABL height. Cheng et al. (2014) revealed that the BC mass concentrations decreased during the afternoon hours, due to the boundary layer dynamics and a lower car fleet volume. Begam et al., 2016, confirmed the inverse proportional relationship between the ABL level and BC concentrations. In the present study, it was observed that BC levels were high when the boundary layer was lower than 1000m, and decreases with the ABC height, which is explained by the pressure applied by the ABL on the air pollutants, decreasing the volume and increasing the concentrations.
Sources of black carbon
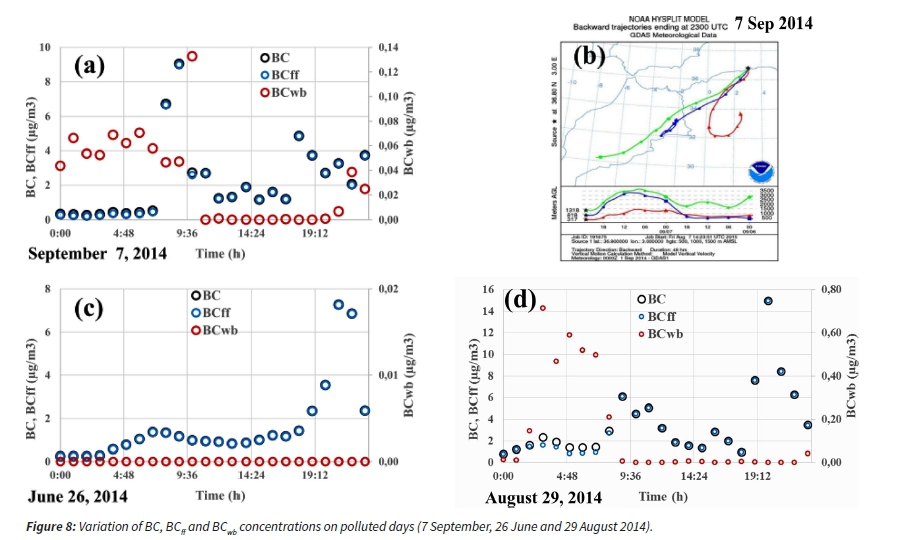
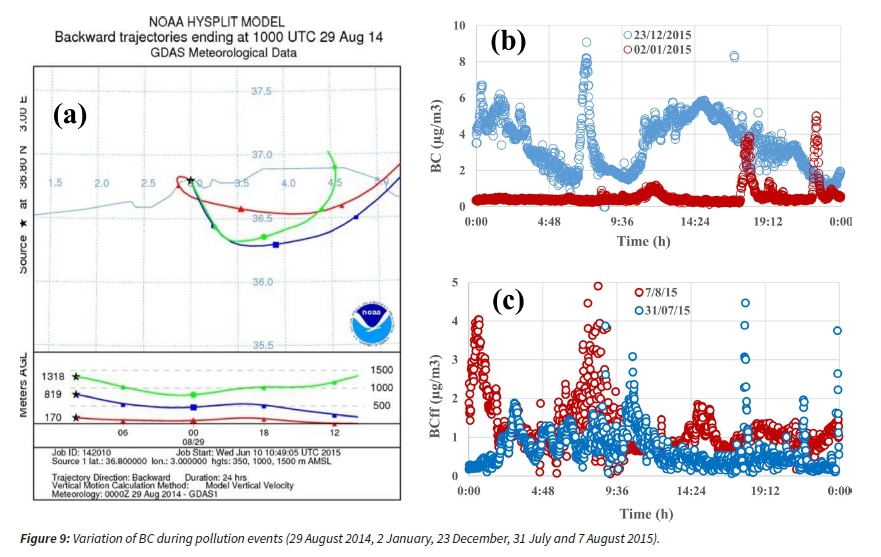
Figures 8a,b,c,d show some pollution events (pollution from the Sahara, sport and religious celebrations, forest fires, long-range transport from Europe as well as a day without cars). The hourly averages of BC, BCff and BCwb concentrations during 7 September 2014 are displayed in Figure 8a. High levels of BC and BCff reach 9.043 and 8.996 Mgm-3, respectively, between 09:00 and 10:00. A high peak of BCwb reaching 0.133 Mgm-3 between 10:00 and 11:00 was also measured. These high levels of BC wbwere attributed to the forest fires in Ain Defla in the south-west of Algiers that occured during the same period, as cited by the Algerian Directorate General of Forestry, and affecting the region as confirmed by the air mass trajectories shown in Figure 8b. The high levels of BC and BCff can be associated with other air masses coming from the petroleum industry in the Sahara (Figure 8b).
Figure 8c displays the hourly averages of BC, BCff and BCwb on 26 June 2014, when the national soccer team of Algeria came for the first time to the second round of the 2014 World Cup. High levels of BC and BCff were recorded during the night of 26 June exceeding 7.000 Mgm-3 between 21:00 and 23:00 with 98.88% of the BC being BCff. This pollution has been produced by traffic emissions and excessive use of pyrotechnic products exacerbated during this particular celebration event. The hourly averages of BC, BCff and BCwb on 29 August 2014 are shown in Figure 8d. High peaks of BC and BCff reached up to 14.000 Mgm-3 between 20:00 and 21:00 and high levels of BC . reached 0.715 Mgm-3 between 03:00 and 04:00 and 0.589 Mgm-3 between 05:00 and 06:00 with a daily mean concentration of 0.199 Mgm-3.
The Hysplit back trajectories (Figure 9a) corroborated the occurrence of huge forest fires in the east of Algiers (300 km away) in Bejaia and Jijel, as announced by the Director General of Forestry. The fires started on 27 August 2014 and the plume arrived at Algiers on 29 August 2014. The mean concentrations of BC and BCff between 20:00 and 21:00 were similar and very high (i.e., 14.953 Mgm-3), suggesting the dominance of fossil fuel sources of BC after the extinction of the forest fires. Interestingly, Figure 9b compares the variation of BC in two successive celebrations years of the Birthday of Muslim Prophet (Mawlid Enabawi) coincided with the nights of 2 January 2015 and 23 December 2015. High levels of BC concentrations were recorded with peaks exceeding 9.000 Mgm-3 on 23 December and 5.000 Mgm-3 on 2 January, and daily mean concentrations of 3.477 Mgm-3 on 23 December, and 0.559 Mgm-3 on 2 January, occuring during tremendous use of pyrotechnic products. Seidel and Birnbaum (2015) reported an increase of the US-average mean hourly PM25 values reaching 21.000 Mgm-3 21:00 to 22:00 during the celebration of the national independence day in the US (4 July 1999-2013) and a decrease to zero by noon the day after (5 July 1999-2013). The authorities implemented a day without traffic road in the center of Algiers. This special case helps to assess to what extent the impact of traffic on BC emissions is important for BC levels in the Algiers city. Figure 9c presents a comparison of BC variations between an ordinary day (7 August 2015) and a day without cars in Algiers (31 July 2015).
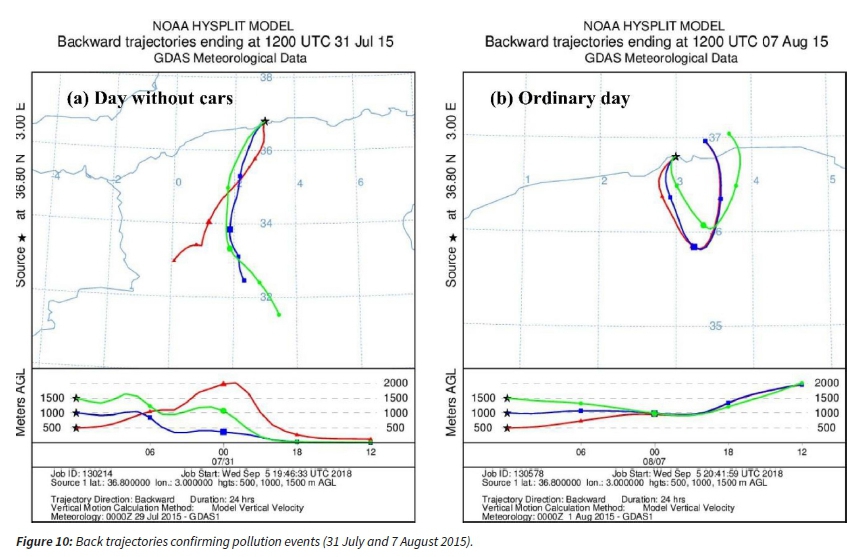
A substantial drop in BC concentrations of between 47.3% and 92.4% was observed during the day without cars relative to the days with cars, considering that the air mass sources are local during the ordinary (day with cars) day and from the south-west from the region having no oil industry, for the day without cars as shown in Figure 10. The BC average concentrations during the day and the night of this day without cars were 0.564 and 0.543 Mgm-3, respectively, representing 50% on the annual average, which demonstrates the role of car fleet in BC levels in Algiers.
Annual source apportionment of black carbon
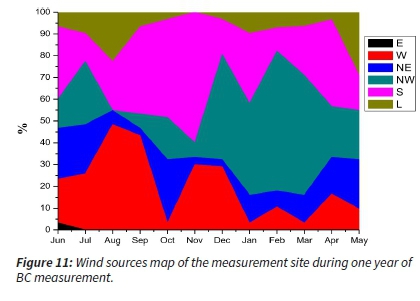
Figure 11 displays the variation of wind origin at 500m above ground level at the measurement site based on 365 air mass back trajectories performed using the Hysplit model for the year of the measurements. These maps are important for the interpretation of the high peaks of BC air pollution and their emission sources. From July to September 2014, the westerly sector was the main sector of wind origin, with average frequency of occurrence of 25.80% in July, 48.38% in August and 43.33% in September. In October and November 2014, the winds came mostly from the south with frequency of occurrence of 45.16% and 60.00%, respectively. For December 2014, January, February and March 2015, the principal source of winds was from north-west with frequencies of 48.38%, 41.93%, 64.28% and 54.84%, respectively. April was characterised by southerly winds coming from the Sahara, with frequency of occurrence of 40.00%. In May, the winds were local (29.03%), from the northeast (22.58%) and the north-west (22.58%).
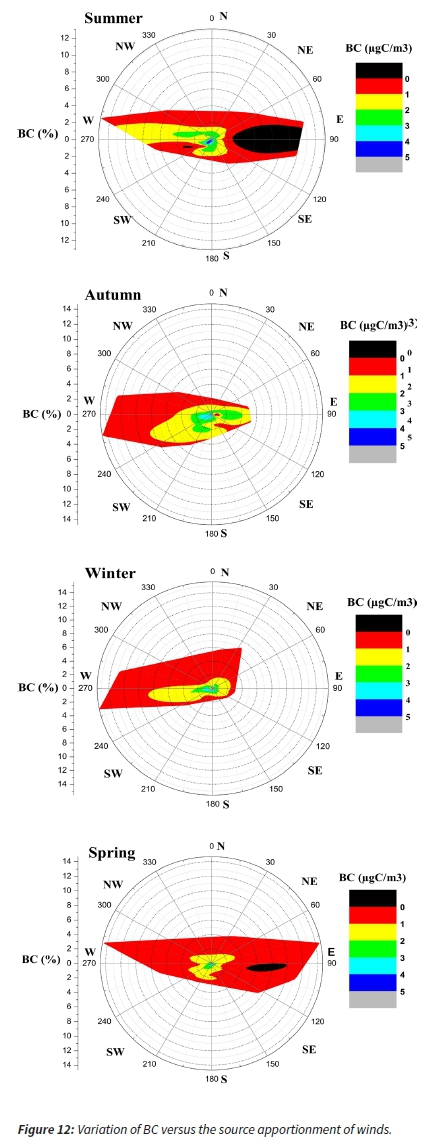
The relationship between BC and the source apportionment of winds (measured by CHEMS network of CDER) for the four seasons of the measurement period is depicted in Figure 12. A filtering of the BC coming from the eight wind sectors has been performed. In summer, BC predominantly came from the west (23.94%), the south (24.89%) and the east (23.08%). The polluted air masses came from the west and north-west with mean concentrations reaching 5 Mgm-3 for southerly airflow and 3 Mgm-3 for westerly airflow; however, the air masses coming from the east were cleaner (concentrations below 1 Mgm-3). During the autumn, the predominant BC mass fraction directions were from the south (34.80%), the west (32.39%) and the east (12.96%), with BC mean concentrations reaching up to 4 Mgm-3 for the westerly and 3 Mgm-3 for the southerly and the easterly sectors. In the winter, the prevailing air masses came from the west (34.40%), the south (19.97%) and the northwest (13.10%). The BC mean concentrations coming from the west, the south and north-west reached up to 3, 3 and 2 Mgm-3, respectively. In spring, BC mass fractions came mostly from the east (26.88%), the south (26.58%) and the west (22.88%). The BC mean concentrations reached up to 3 Mgm-3 for the southerly and 2 Mgm-3 for the easterly and the westerly sectors. Air masses rich in BC came from the west of Algiers.
During the wet period, high BC mean concentrations of 1.333 Mgm-3 were recorded in association with southerly winds (petroleum industry), followed by local winds with 1.238 Mgm-3 (car fleet) despite the wet scavenging of BC. The highest mean concentrations of BC recorded during the dry period were from the easterly (1.380 Mgm-3) and westerly (1.377 Mgm-3) directions, coinciding with the emissions from the fires, harbour and airport to the east and petroleum refinery to the west.
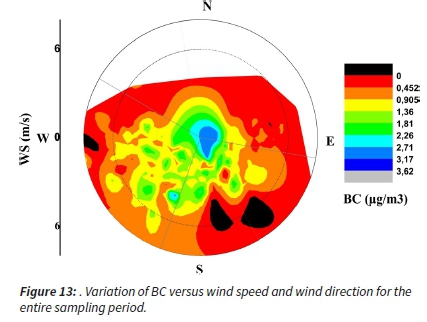
Figure 13 displays a non-parametric wind regression analysis involving wind speed and source apportionment of winds (measured by CHEMS network of CDER) and BC concentrations, which could reveal more information on the source apportionment of BC. The mean concentration of BC was 0.725 Mgm-3 when ws was higher then 4 m s-1; however, it reached 1.806 Mgm-3 for ws lower than 2 m s-1, reflecting the dispersion of BC by winds. Figure 13 revealed also that the prevailing sources of BC were from the south, north-east and north-west with concentrations reaching up to 3.170 Mgm-3 recorded when the wind speed was lower than 2 m s-1. However, despite southerly winds reaching 4 m s-1, high levels of BC of up to 3.170 Mgm-3 have been recorded from the southerly direction, suggesting the emissions from the oil industry.
For a better understanding of the source apportionment of BC and its long-range transport pathways, a back trajectory cluster analysis has been performed. Hysplit 120-hour back trajectories arriving at the site every 6 hours for 365 days (from 1 June 2014 to 31 May 2015) were carried out. The 6-hour time intervals were centered around midnight (00:00), 06:00, 12:00 and 18:00. The trajectories arriving at the site at a height of 500m A.S.L, were performed by the model Hysplit developed by NOAA (Figure 14a) for the year of measurement. We defined six clusters (northeast, north-west, south, east, west and local as performed by Kouvarakis et al. (2000). A percentage of wind sources for each one of the four intervals (00:00, 06:00, 12:00 and 18:00) was calculated, followed by the calculation of the average of BC, BCff and BCwb for each cluster during the four intervals. The north-westerly direction was predominant with percentages reaching up to 69, 66, 65 and 62% at 18:00, 12:00, 00:00 and 06:00, respectively, followed by the southerly direction with 15, 14, 13 and 12% at 12:00, 06:00, 00:00 and 18:00, respectively. These results confirm that the prevailing winds during the year of study were north-westerly followed by the southerly. Figures 14 b, c and d, display respectively the percentages of BC, BCff and BC wbbfor the wind directions of the same four intervals during the year of measurements. For the midnight (00:00) cluster, the highest BC and BCff mean concentrations were recorded from the west followed by the south with 1.417 and 1.402 Mgm-3 for BC and 1.263 and 1.212 Mgm-3 for BCff, respectively, which can be explained by the presence of the oil refinery of Arzew in the west and the oil industry (pumping, processing, storage and transport) in the south. The highest mean concentrations of BC and BC rtobserved for the 06:00 cluster came from the east and the north-east for BC with 1.336 and 0.994 Mgm-3, respectively, and from the east and the west for BC with 1.215 and 0.917rt u gm-3, respectively. The occurrence of such BC concentrations can be related to the harbor activities, the refineries to the east and west, the car fleet, and wood burning from Eastern Europe. With regards to the midnight (00:00) cluster, BC and BCff sources were mainly from the east followed by the west with concentrations of 2.354 and 2.200 Mgm-3 for BC and 2.238 and 2.156 Mgm-3 for BCff, respectively, which can be due to the harbor activities and petroleum refineries of Bejaia and Skikda in the east and of Arzew in the west.

For the 18:00 cluster, the predominant BC and BCff mean concentrations were recorded from the south and in association with local airflow with 1.942 and 1.696 Mgm-3 for BC and 1.889 and 1.683 Mgm-3 for BCff, respectively, which can be due to the oil industry in the south and the local car fleet. For the case of BCwb at midnight (00:00), the highest mean concentrations were predominantly from the north-east at 0,090 Mgm-3, which is double the previous average, due to wood burning in Europe, followed by from the south at 0,051 Mgm-3, close to the yearly mean, due to wild fires in the south of Algiers.
As to the 06:00 and midday clusters, the prevailing sources of BC were to the east and the north-east with high means reaching up to 0.121 and 0.092 Mgm-3, and 0.116 and 0.106 Mgm-3, respectively, explained by wood burning in Eastern Europe and Tunisia. Finally, for the 18:00 cluster, the BCwb predominant mean concentrations were close to the annual average and came from the south with 0.053 Mgm-3 due to cooking in the southern Algeria cities and from the west with 0,043 Mgm-3, very likely derived from cooking in the western Algeria cities and from wood burning in Morocco.
For a better interpretation of the previous results, trajectory frequency maps were performed by the Hysplit model. Figure 15 displays the trajectory frequency in summer (July-August), where winds came mainly from the north-east and north-west, which is in line with the previous results bringing BC and BC emitted by fires and human activities.
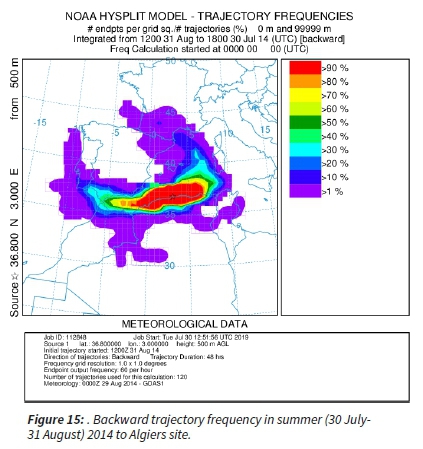
Figure 16 presents the trajectory frequency map during autumn months (September-October) 2014. The prevailing winds were from the west, the south and the north-east, reinforcing the results presented in the meteorological map.

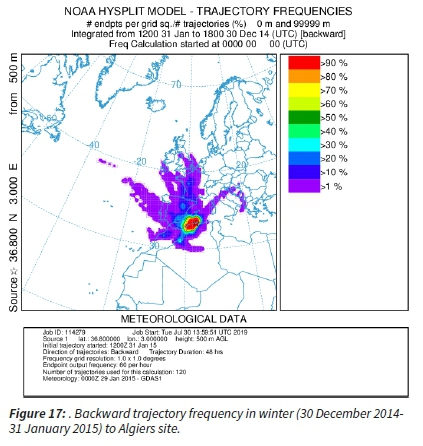
Figure 17 displays the trajectory frequency map in winter (December 2014-January 2015). The predominant winds were from the west, the south and the north-east, reinforcing the results presented in the meteorological map (Figure 11).
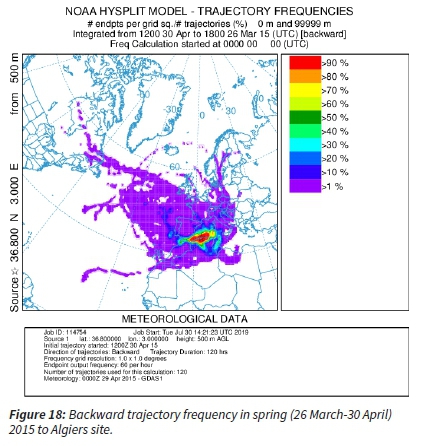
The trajectory frequency map during spring months (March-April) 2015 is shown in Figure 18. The prevailing winds during spring were from the north-east, the north-west and the south, which is in line with the previous results.
Anthropogenic sources of BC
We further focus on the anthropogenic part of BC emissions. For this purpose, a comparison of the levels of BC recorded in Algiers, Athens, Crete and Tamanrasset (the GAW/WMO reference station of Askrem) was performed.
Figure 19 displays the mean concentrations of BC recorded in Askrem, a background station situated at 23.27°N, 5.63°E and an altitude of 2730 m a.s.l, from April and May 1997. In contrast to the mean BC concentration measured in Algiers during April-May 2015, i.e., 0.936 Mgm-3, the BC mean concentration recorded at the Askrem GAW station was 0.168 Mgm-3. The BC concentrations in Algiers, which is heavily impacted by anthropogenic emissions, were 79.78% higher than at the Askrem background station.
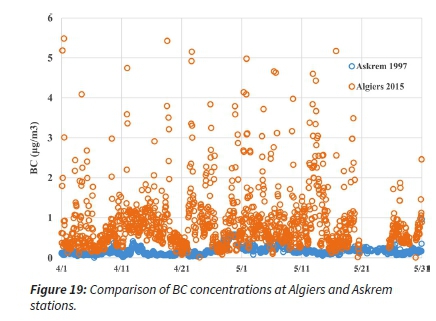
Figure 20 shows a comparison of BC recorded in Algiers, Athens and Finokalia, Crete (Greece) during the year of measurement. The measurement site of Thissio (Athens), is situated in a city near the Akropolis, which is a much-visited museum. The Finokalia station is a background site used as a reference for Greek and European stations, 80 km east of Heraklion (Crete). The monthly average of BC in the urban agglomeration of Athens were similar to those recorded in Algiers, except in November, December and January, when the average concentrations were for Athens and Algiers respectively 2.949 and 1.278, 3.819 and 0.907 and 2.364 and 1.099 Mgm-3. The high BC concentrations in Athens during winter could be due to wood burning for heating. The monthly mean BC levels observed at the background station of Finokalia, Crete varied mostly between 0.2 and 0.5 Mgm-3 with an annual average of 0.314 Mgm-3, which represents 20.36% and 28.16% of the annual averages recorded in Athens and Algiers, respectively.

BC modelling
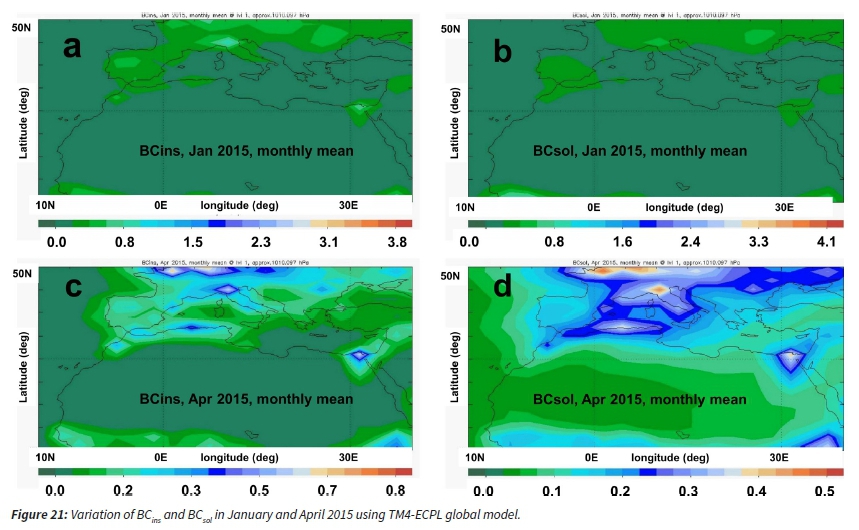
We further compare the observed BC with modelled results. For this, we used the TM4-ECPL global model developed by the University of Crete (Greece). The model, which has been described in detail by Daskalakis et al. (2015), accounts for multiphase chemistry as well as all major aerosol types, including carbonaceous aerosols, both insoluble (BCins) and soluble (BCv sol' ) black carbon. The modelling of BCsol and BC ins is 0important to follow the atmospheric concentrations of fresh insoluble BC (BCins) and the aged soluble BC (BCsol) that can be transported to the soil and ground water by wet scavenging. The results of the modeling are depicted in Figures 21 and 22 for July and October 2014 and January and April 2015, respectively. The months were chosen for a representative comparison of measured and modeled results for each month in the middle of each season. Figures 21a, b, c and d present the modeled BCins in January 2015, BCsol in January 2015, BCins in April 2015 and BCsol in April 2015, respectively. Figures 22a, b, c and d depict the modeled BCins in July 2014, BCsol in July 2014, BCins in October
2014 and BCsol in October 2014, respectively. BCins and BCsol were higher in the center of Africa and the north of Europe, due to forest fires and wood burning. The modelled BCins and BCinsin Algiers were respectively 0.50 and 0.30 Mgm-3 in July 2014, 0.50 and 0.40 Mgm-3 in October 2014, 0.40 and 0.40 Mgm-3 in January 2015 and 0.45 and 0.40 Mgm-3 in April 2015. Therefore, the total modelled BC for the four months was 0.80, 0.90, 0.80 and 0.85 Mgm-3, respectively, which were very close to the mean measured BC concentration levels (0.745, 1.308, 1.108 and 0.917 Mgm-3).
In order to follow the variation of BCffand BCwb by using the model proposed by Zotter et al. (2016), a statistical study has been performed. This statistical study was based on replacing the Angstrom exponents aff=1 and awb=2, used in the aethalometer model by aff=0.90 and awb=1.682 proposed by Zotter et al. (2016), followed by a calculation of the new seasonal BC, BCffand BCwb average concentrations. A decrease of seasonal BCff of 9.15 and 7.08% in winter and autumn, respectively, was calculated using the Zotter et al. (2016) model, compared to an increase of BCwb of 96.97 and 90.43% for spring and autumn, respectively. This result indicates that BCwb was undervalued by the model applied in our study, in contrary to the Zotter et al. (2016) model especially in spring and autumn.
Angstrom exponent
Another important factor for the characterization of the source of measured BC during the year of study is the Angstrom exponent (α). Favez et al., (2009) revealed a low spectral dependence of black carbon light absorption (α ~ 1), in contrast, it is much higher for other aerosol components, i.e. hematite and brown carbon. Sandradewi et al. (2008) recorded light absorption exponents of 1.1 for traffic and 1.8-1.9 for wood burning, calculated from the light absorption at 470 and 950 nm. Soni et al. (2011) observed minimum values of the Angstrom exponent during May and maximum values during the winter period (December and January), related to a gradual decrease in the coarse particle concentration from summer to winter months. The Angstrom exponent (calculated at 470 and 950nm) shown in Figure 23 varied mostly between 0.5 and 1.5 with an annual average of 1.07, indicating that the main source of BC during the year of measurement was from fossil fuel burning, in line with the findings presented in this investigation.

Mass absorption cross-section
The mass absorption cross-section (MAC) is also a good indicator of the source and the aging of BC particles. The MAC values are related to the aerosol mixing state, size, and morphology (Bond and Bergstrom, 2006), and increase with coating thickness or water at high relative humidity (Schnaiter, 2005). Laborde et al. (2013) revealed that the MAC average was -7.3 m2g-1 for traffic emissions due to refractory BC (rBC) cores wich are mainly uncoated and small. However, for the case of wood burning, the MAC average was -7.8 m2g-1 explained by thicker coating and bigger rBC core size. Higher average MAC (-8.8 m2g-1) were recorded with aged aerosols because of the thicker coating compared to aerosols from traffic and wood burning (Schnaiter, 2005). Cao et al. (2015) reported median MAC values of 20.0, 33.7, 29.1 and 27.6 m2g-1 during the spring, summer, autumn and winter, respectively, in China. However, the seasonal means of MAC values recorded in Switzerland were much smaller with 8.9, 9.5, 10.9, and 9.9 m2g-1 in spring, summer, autumn and winter, respectively (Lavanchy et al., 1999). The high MAC values recorded in China could be due to biomass burning, relatively large increase in the symmetrical particles and cluster-like structures emitted by motor vehicles, and the secondary and aged aerosols under high relative humidity (60-80%) and strong solar radiation.
In the present study, the seasonal means of MAC during summer, autumn, winter and spring were 10.97, 15.56, 30.27 and 17.12 m2g-1, respectively. These high MAC values could be due to aged aerosols coming from Europe and secondary aerosols under high humidity and strong solar radiation, considering that the seasonal relative humidity was 58.38, 61.78, 64.12 and 62.03% in summer, autumn, winter and spring, respectively. The highest monthly averages for MAC were recorded in February, December and March at 36.18, 30.54 and 26.92 m2g-1, respectively, when, relative humidity was high, reaching 63.94, 65.44 and 65.44%, respectively. The lowest MACs were recorded in July, September and October at 9.61, 1.75 and 11.88 m2g-1, respectively, with lower relative humidity of 58.00, 58.77 and 55.53%, respectively. This difference between the monthly variations in MAC could also be due to the clear skies in February and March especially, in contrast to the other months, and the wind in winter months bringing aged aerosols. July and September were also characterized by fresh aerosols due to wild fires as presented in the previous sections.
Conclusions
Observations of BC' ff, BCwb and BC J over one year of measurement were performed for the first time in Algeria in order to better understand the levels, the occurrence, the sources and the seasonal modulations of BC air pollution. Hourly, diurnal, and seasonal variations in BC levels have been investigated. BC sources were found to be associated with traffic, wild fires, and the oil industry in the south of Algeria. Celebration events and long-range transport of pollution from Europe and neighboring countries have also been investigated.
The main source of BC pollution in Algiers city was found to be fossil fuel combustion accounting for 95.60% of the total annual mean BC levels, whereas BCwb contributed only 4.40%.
The highest seasonal mean concentrations were recorded in summer and autumn at 1.283 and 1.209 Mgm-3 for BC and 1.217 and 1.177 Mgm-3 for BCff respectively. The lowest mean concentrations were recorded in winter and spring at 1.023 and 0.966 Mgm-3 for BC and 0.933 and 0.956 Mgm-3 for BCff, respectively.
For BC , the highest mean concentrations were reached in winter and summer at 0.090 and 0.066 Mgm-3, respectively, due to the forest fires and long-range transport of air pollution from Europe. The lowest mean concentrations of BCwb were recorded in autumn and spring at 0.032 and 0.010 Mgm-3, respectively.
The BC pollution predominantly came from the west of Algiers, probably associated with the petroleum refinery in Arzew (Oran) situated 400 km from Algiers.
A source apportionment study of BC has been carried out for the wet and dry period of the studied year, followed by back trajectory cluster analysis for a better understanding of the long-range transport pathways. The highest BC mean concentrations of 1.333 Mgm-3 in the wet period were recorded in association with southerly winds, followed by local pollution contributing 1.238 Mgm-3 of BC. During the dry period, the highest mean concentrations of BC were observed in association with airflow from the East and West directions at concentrations of 1.380 and 1.377 Mgm-3 respectively.
The mass absorption cross-section (MAC) and Angstrom exponent were used to investigate the source and the ageing of BC measured in the present study.
The present study allowed a comparison of BC mean concentrations recorded in Algiers, Crete and Athens (Greece), and Tamanrasset (GAW/WMO reference station of Askrem), revealing that the anthropogenic emissions were 79.78, 90.26 and 46.50% higher than at the Askrem background station for Algiers, Athens and Crete, respectively.
The annual average BC concentration recorded at the Algiers Observatory (suburban site) was much lower than that recorded in Anantapur (India), Prague (Czech), Athens (Greece) and Rome (Italy), but was higher than values measured in Santa Cruz de Tenerife (Spain), Crete (Greece) and Finland.
Acknowledgements
We gratefully acknowledge the NOAA Air Resources Laboratory (ARL) for the provision of the HYSPLIT transport and dispersion model and READY website (http://www.ready.noaa.gov) used in this publication.
The authors are thankful to the National Meteorological Office, Algeria especially to Mr Mimouni Mohamed, for providing the Askrem data.
We thank also Dr Pavlos Zarmpas, Dr Georgos Kouvarakis, Georgos Fanourgakis and Dimitrios Amanatidis at the University of Crete (Greece) for their assistances with the modelling.
References
Ali, U., Syed, J.H., Junwen, L., Sánchez-García, L., Malik, R.N., Chaudhry, M.J.I., Arshad, M., Li, J., Zhang, G., Jones, K.C. 2014, 'Assessing the relationship and influence of black carbon on distribution status of organochlorines in the coastal sediments from Pakistan', Environmental Pollution 190: 82-90. https://doi.org/10.1016/j.envpol.2014.03.024. [ Links ]
Andreae, M.O., Gelencser, A. 2006, 'Black carbon or brown carbon? The nature of light-absorbing carbonaceous aerosols', Atmospheric Chemistry and Physics 6:3131-3148. https://doi.org/10.5194/acpd-6-3419-2006. [ Links ]
Bahadur, R., Russell, L.M., Jacobson, M.Z., Prather, K., Nenes, A., Adams, P. and Seinfeld, J.H. 2012, 'Importance of composition and hygroscopicity of BC particles to the effect of BC mitigation on cloud properties: Application to California conditions: Effect of CV particles on clouds', Journal of Geophysical Research: Atmospheres 117(D9). https://doi.org/10.1029/2011JD017265. [ Links ]
Begam, G.R., Vachaspati, C.V., Ahammed, Y.N., Kumar, K.R., Babu, S.S. and Reddy, R.R. 2016, 'Measurement and analysis of black carbon aerosols over a tropical semi-arid station in Kadapa, India', Atmospheric Research, 171:77-91. https://doi.org/10.1016/j.atmosres.2015.12.014. [ Links ]
Bond, T.C. and Bergstrom, R.W. 2006, 'Light Absorption by Carbonaceous Particles: An Investigative Review', Aerosol Science and Technology 40(1):27-67. https://doi.org/10.1080/02786820500421521. [ Links ]
Bond, T. C., Doherty, S. J., Fahey, D. W., Forster, P. M., Berntsen, T., DeAngelo, B. J., Flanner, M. G., Ghan, S., Kärcher, B., Koch, D., Kinne, S., Kondo, Y., Quinn, P. K., Sarofim, M. C., Schultz, M. G., Schulz, M., Venkataraman, C., Zhang, H., Zhang, S., Bellouin, N., Guttikunda, S. K., Hopke, P. K., Jacobson, M. Z., Kaiser, J. W., Klimont, Z., Lohmann, U., Schwarz, J. P., Shindell, D., Storelvmo, T., Warren, S. G. and Zender, C. S. 2013, 'Bounding the role of black carbon in the climate system: A scientific assessment', Journal of Geophysical Research 118(11): 5380-5552. https://doi.org/10.1002/jgrd.50171. [ Links ]
Bycenkiené, S., Ulevicius, V. and Kecorius, S. 2011, 'Characteristics of black carbon aerosol mass concentration over the East Baltic region from two-year measurements', Journal of Environmental Monitoring 13(4):1027. https://doi.org/10.1039/c0em00480d. [ Links ]
Cao, J., Zhu, C., Ho, K., Han, Y., Shen, Z., Zhan, C. and Zhang, J. 2015, 'Light attenuation cross-section of black carbon in an urban atmosphere in northern China', Particuology 18:89-95. https://doi.org/10.1016/j.partic.2014.04.011 [ Links ]
Cheng, Y., Lee, S.C., Ho, K.F., Wang, Y.Q., Cao, J.J., Chow, J.C. and Watson, J.G. 2006, 'Black carbon measurement in a coastal area of south China', Journal of Geophysical Research 111(D12). https://doi.org/10.1029/2005JD006663. [ Links ]
Cheng, Y.-H., Liao, C.-W., Liu, Z.-S., Tsai, C.-J. and Hsi, H.C. 2014, 'A size-segregation method for monitoring the diurnal characteristics of atmospheric black carbon size distribution at urban traffic sites', Atmospheric Environment 90:78-86. https://doi.org/10.1016/j.atmosenv.2014.03.023. [ Links ]
Chiloane, K. E., Beukes, J. P., van Zyl, P. G., Maritz, P., Vakkari, V., Josipovic, M., Venter, A. D., Jaars, K., Tiitta, P., Kulmala, M., Wiedensohler, A., Liousse, C., Mkhatshwa, G. V., Ramandh, A. and Laakso, L. 2017, Spatial, temporal and source contribution assessments of black carbon over the northern interior of South Africa, Atmos. Chem. Phys. 17(10):6177-6196. https://doi.org/10.5194/acp-17-6177-2017. [ Links ]
Daskalakis, N., Myriokefalitakis, S. and Kanakidou, M. 2015, 'Sensitivity of tropospheric loads and lifetimes of short lived pollutants to fire emissions', Atmospheric Chemistry and Physics 15(6):3543-3563. https://doi.org/10.5194/acp-15-3543-2015. [ Links ]
De Miranda, R.M., de Fatima Andrade, M., Fornaro, A., Astolfo, R., de Andre, P.A. and Saldiva, P. 2012, 'Urban air pollution: a representative survey of PM2.5 mass concentrations in six Brazilian cities', Air Quality, Atmosphere & Health 5(1):63-77. https://doi.org/10.1007/s11869-010-0124-1. [ Links ]
Favez, O., Cachier, H., Sciare, J., Sarda-Estève, R., Martinon, L. 2009, 'Evidence for a significant contribution of wood burning aerosols to PM2.5 during the winter season in Paris, France', Atmospheric Environment 43:3640-3644. https://doi.org/10.1016/j.atmosenv.2009.04.035. [ Links ]
Gadhavi, H. and Jayaraman, A. 2010, 'Absorbing aerosols: contribution of biomass burning and implications for radiative forcing', Annales Geophysicae 28(1):103-111. https://doi.org/10.5194/angeo-28-103-2010. [ Links ]
Hooda, R. K., Kivekäs, N., O'Connor, E. J., Collaud Coen, M., Pietikäinen, J.-P., Vakkari, V., Backman, J., Henriksson, S. V., Asmi, E., Komppula, M., Korhonen, H., Hyvärinen, A.-P. and Lihavainen, H. 2018, 'Driving factors of aerosol properties over the foothills of Central Himalayas based on 8.5 years continuous measurements, J. Geophys. Res. Atmos. 123(23):13421-13442. https://doi.org/10.1029/2018JD029744. [ Links ]
Jennings, S.G., Spain, T.G., Doddridge, B.G., Maring, H., Kelly, B.P. and Hansen, A.D.A. 1996, 'Concurrent measurements of black carbon aerosol and carbon monoxide at Mace Head', Journal of Geophysical Research: Atmospheres 101(D14):19447-19454. https://doi.org/10.1029/96JD00614. [ Links ]
Jose, S., Niranjan, K., Gharai, B., Rao, P.V.N. and Nair, V.S. 2016, 'Characterisation of absorbing aerosols using ground and satellite data at an urban location, Hyderabad', Aerosol and Air Quality Research 16( 6): 1427-1440. https://doi.org/10.4209/aaqr.2014.09.0220. [ Links ]
Krecl, P., Targino, A.C. and Johansson, C. 2011, 'Spatiotemporal distribution of light-absorbing carbon and its relationship to other atmospheric pollutants in Stockholm', Atmospheric Chemistry and Physics 11(22):11553-11567. https://doi.org/10.5194/acp-11-11553-2011. [ Links ]
Laborde, M., Crippa, M., Tritscher, T., Jurányi, Z., Decarlo, P.F., Temime-Roussel, B., Marchand, N., Eckhardt, S., Stohl, A., Baltensperger, U., Prévöt, A.S.H., Weingartner, E., Gysel, M. 2013, 'Black carbon physical properties and mixing state in the European megacity Paris', Atmospheric Chemistry and Physics 13(11):5831-5856. https://doi.org/10.5194/acp-13-5831-2013. [ Links ]
Lavanchy, V.M.H., Gäggeler, H.W., Nyeki, S. and Baltensperger, U. 1999, 'Elemental carbon (EC) and black carbon (BC) measurements with a thermal method and an aethalometer at the high-alpine research station Jungfraujoch', Atmospheric Environment 33(17):2759-2769. https://doi.org/10.1016/S1352-2310(98)00328-8. [ Links ]
Lohmann, R., MacFarlane, J.K. and Gschwend, P.M. 2005, 'Importance of black carbon to sorption of native PAHs, PCBs, and PCDDs in Boston and New York harbor sediments', Environmental Science & Technology 39(1):141-148. https://doi.org/10.1021/es049424+. [ Links ]
Mahmoud, K.F., Alfaro, S.C., Favez, O., Abdel Wahab, M.M. and Sciare, J. 2008, 'Origin of black carbon concentration peaks in Cairo (Egypt)', Atmospheric Research 89(1-2):161-169. https://doi.org/10.1016/j.atmosres.2008.01.004. [ Links ]
Masiello, C.A. and Druffel, E.R.M. 1998, 'Black carbon in deep-sea sediments', Science, New Series 280(5371):1911-1913. https://doi.org/10.1126/science.280.5371.1911. [ Links ]
Nair, V.S., Moorthy, K.K., Alappattu, D.P., Kunhikrishnan, P.K., George, S., Nair, P.R., Babu, S.S., et al. 2007, 'Wintertime aerosol characteristics over the Indo-Gangetic Plain (IGP): Impacts of local boundary layer processes and long-range transport: Winter aerosols over Indo-Gangetic Plain', Journal of Geophysical Research: Atmospheres 112(D13). https://doi.org/10.1029/2006JD008099. [ Links ]
Pu, W., Wang, X., Zhang, X., Ren, Y., Shi, J.-S., Bi, J.-R., Zhang, B.-D. 2015, ' Size distribution and optical properties of particulate matter (PM10) and black carbon (BC) during dust storms and local air pollution events across a loess plateau site', Aerosol and Air Quality Research, 15(6): 2212-2224. https://doi.org/10.4209/aaqr.2015.02.0109. [ Links ]
Ramachandran, S. and Rajesh, T.A. 2007, 'Black carbon aerosol mass concentrations over Ahmedabad, an urban location in western India: Comparison with urban sites in Asia, Europe, Canada, and the United States', Journal of Geophysical Research 112(D6). https://doi.org/10.1029/2006JD007488. [ Links ]
Reche, C., Querol, X., Alastuey, A., Viana, M., Pey, J., Moreno, T., Rodríguez, S., et al. 2011, 'New considerations for PM, Black Carbon and particle number concentration for air quality monitoring across different European cities', Atmospheric Chemistry and Physics 11(13):6207-6227. https://doi.org/10.5194/acp-11-6207-2011. [ Links ]
Reddy, B.S.K., Kumar, K.R., Balakrishnaiah, G., Gopal, K.R., Reddy, R.R., Reddy, L.S.S., Ahammed, Y.N., Narasimhulu, K., Moorthy, K.K., Babu, S.S. 2012, 'Potential source regions contributing to seasonal variations of black carbon aerosols over Anantapur in Southeast India', Aerosol and Air Quality Research 12(3):344-358. https://doi.org/10.4209/aaqr.2011.10.0159. [ Links ]
Saarikoski, S., Timonen, H., Saarnio, K., Aurela, M., Järvi, L., Keronen, P., Kerminen, V.-M., Hillamo, R. 2008, 'Sources of organic carbon in fine particulate matter in northern European urban air', Atmospheric Chemistry and Physics 8(20):6281-6295. https://doi.org/10.5194/acp-8-6281-2008. [ Links ]
Saha, A. and Despiau, S. 2009, 'Seasonal and diurnal variations of black carbon aerosols over a Mediterranean coastal zone', Atmospheric Research 92(1):27-41. https://doi.org/10.1016/j.atmosres.2008.07.007. [ Links ]
Salcedo, D., Onasch, T.B., Dzepina, K., Canagaratna, M.R., Zhang, Q., Huffman, J.A., DeCarlo, P.F., Jayne, J.T., Mortimer, P., Worsnop, D.R., Kolb, C.E., Johnson, K.S., Zuberi, B., Marr, L.C., Volkamer, R., Molina, L.T., Molina, M.J., Cardenas, B., Bernabé, R.M., Márquez, C., Gaffney, J.S., Marley, N.A., Laskin, A., Shutthanandan, V., Xie, Y., Brune, W., Lesher, R., Shirley, T., Jimenez, J.L. 2006, "Characterization of ambient aerosols in Mexico City during the MCMA-2003 campaign with Aerosol Mass Spectrometry: results from the CENICA Supersite", Atmospheric Chemistry and Physics6(4):925-946. https://doi.org/10.5194/acp-6-925-2006. [ Links ]
Sandradewi, J., Pre'vo"t, A.S.H., Szidat, S., Perron, N., Alfarra, M.R., Lanz, V.A., Weingartner, E., Baltensperger, U., 2008b. Using aerosol light absorption measurements for the quantitative determination of wood burning and traffic emission contributions to particulate matter. Environmental Science and Technology 42:3316-3323. https://doi.org/10.1021/es702253m. [ Links ]
Schnaiter, M. 2005, 'Absorption amplification of black carbon internally mixed with secondary organic aerosol', Journal of Geophysical Research, 110(D19). https://doi.org/10.1029/2005JD006046. [ Links ]
Sciare, J., d'Argouges, O., Sarda-Estève, R., Gaimoz, C., Dolgorouky, C., Bonnaire, N., Favez, O., Bonsang, B., Gros, V. 2011, 'Large contribution of water-insoluble secondary organic aerosols in the region of Paris (France) during wintertime: Wintertime water-insoluble SOA', Journal of Geophysical Research: Atmospheres 116(D22). https://doi.org/10.1029/2011JD015756. [ Links ]
Seidel, D.J. and Birnbaum, A.N. 2015, 'Effects of Independence Day fireworks on atmospheric concentrations of fine particulate matter in the United States', Atmospheric Environment, 115:192198. https://doi.org/10.1016/j.atmosenv.2015.05.065. [ Links ]
Seinfeld, J.H. and Pandis, S.N. 2006, 'Atmospheric Chemistry and Physics: From Air Pollution to Climate Change, 2. ed.', Hoboken, NJ. [ Links ]
Singla, V., Mukherjee, S., Kashikar, A.S., Safai, P.D. and Pandithurai, G. 2019, 'Black carbon: source apportionment and its implications on CCN activity over a rural region in Western Ghats, India', Environmental Science and Pollution Research, 26(7):7071-7081. https://doi.org/10.1007/s11356-019-04162-w [ Links ]
Streets, D.G., Gupta, S., Waldhoff, S.T., Wang, M.Q., Bond, T.C. and Yiyun, B. 2001, 'Black carbon emissions in China', Atmospheric Environment 35(25): 4281-4296. https://doi.org/10.1016/S1352-2310(01)00179-0. [ Links ]
Targino, A.C. and Krecl, P. 2017, 'Local and Regional Contributions to Black Carbon Aerosols in a Mid-Sized City in Southern Brazil', Aerosol and Air Quality Research 16(1):125-137. https://doi.org/10.4209/aaqr.2015.06.0388. [ Links ]
Venkatachari, P., Zhou, L., Hopke, P.K., Felton, D., Rattigan, O.V., Schwab, J.J. and Demerjian, K.L. 2006, 'Spatial and temporal variability of black carbon in New York City: SPATIAL AND TEMPORAL VARIATIONS OF BC', Journal of Geophysical Research: Atmospheres 111(D10). https://doi.org/10.1029/2005JD006314. [ Links ]
Vodicka, P., Schwarz, J. and Zdímal, V. 2013, 'Analysis of one year's OC/EC data at a Prague suburban site with 2-h time resolution', Atmospheric Environment 77:865-872. https://doi.org/10.1016/j.atmosenv.2013.06.013. [ Links ]
Wang, H., Nie, L., Liu, D., Gao, M., Wang, M. and Hao, Z. 2015, 'Physico-chemical characterization and source tracking of black carbon at a suburban site in Beijing', Journal of Environmental Sciences 33:188-194. https://doi.org/10.1016/jjes.2015.05.001. [ Links ]
Weingartner, E., et al. (2003), Absorption of Light by Soot Particles: Determination of the Absorption Coefficient by Means of Aethalometers Journal of Aerosol Science 34:1445-1463. https://doi.org/10.1016/S0021-8502(03)00359-8. [ Links ]
Wu, D., Wu, C., Liao, B., Chen, H., Wu, M., Li, F., Tan, H., Deng, T., Li, H., Jiang, D., Yu, J.Z. 2013, 'Black carbon over the South China Sea and in various continental locations in South China', Atmospheric Chemistry and Physics 13(24):12257-12270. https://doi.org/10.5194/acp-13-12257-2013. [ Links ]
Zotter, P., Herich, H., Gysel, M., El-Haddad, I., Zhang, Y., Mocnik, G., Hüglin, C., Baltensperger, U., Szidat, S., Prévöt, A.S.H. 2017, 'Evaluation of the absorption Angstrom exponents for traffic and wood burning in the Aethalometer based source apportionment using radiocarbon measurements of ambient aerosol', Atmospheric Chemistry and Physics 17:4229-4249. https://doi.org/10.5194/acp-2016-621. [ Links ]
 Correspondence:
e-mail: h.merabet@cder.dz
Received: 12 April 2019
Reviewed: 4 June 2019
Accepted: 10 September 2019

