


Servicios Personalizados
Articulo
 Inglés (pdf)
 Articulo en XML
 Referencias del artículo
Indicadores

Links relacionados
-
 Citado por Google
 -
 Similares en Google
Compartir

 Permalink
Clean Air Journal
versión On-line ISSN 2410-972X
versión impresa ISSN 1017-1703
Clean Air J. vol.29 no.1 Pretoria 2019
http://dx.doi.org/10.17159/2410-972x/2019/v29n1a2
RESEARCH ARTICLE
Assessing the impact of Eskom power plant emissions on ambient air quality over KwaZamokuhle
Monray D BelelieI; Roelof Ρ BurgerI; Gabi MkhatshwaII; Stuart J PikethI
IUnit for Environmental Management and Science, North-West University, Potchefstroom, South Africa, chidhindiprince@gmail.com, monraybelelie@gmail.com, roelof.burger@nwu.ac.za, stuart.piketh@nwu.ac.za
IIEskom Research, Testing and Development, Rosherville, South Africa, MkhatsGV@eskom.co.za
ABSTRACT
Coal-fired power plants are considered a major source of criteria air pollutants. The existence of such activities close to densely populated areas has an impact on human health and more generally on the environment. The impact of a pollutant typically depends on its residence time and the existence of background concentration levels. This study evaluates the dispersion of PM25, SO2 and NOX emissions from Eskom power plants (Arnot, Hendrina, and Komati) located close to KwaZamokuhle Township. AERMOD was used to assess the contribution of each plant to the air quality of the township. This steady-state dispersion model was used to simulate surface concentrations (1-hour, 24-hour and annual average concentrations) on a 50km domain for 2015-2017. The modelled results together with data obtained from Eskom's KwaZamokuhle monitoring site were used to estimate the extent to which these power plants contribute to the ambient air quality of KwaZamokuhle Township. The results confirm that the power plants do contribute to concentrations of PM25, SO2, and NOx in the ambient air of the township. However, based on a comparison between the modelled and monitored data, it was inferred that power plants are not the only significant source of these criteria pollutants. Evidence from temporal variations in the monitored data shows that domestic burning is likely the major contributor since the variability is more closely associated with burning habits. It is therefore likely that existing regulatory strategies that focus mostly on the industrial sector may not be successful in improving ambient air quality in low-income settlements like KwaZamokuhle.
Keywords: Coal-fired power plants, emissions, AERMOD, atmospheric dispersion modelling, PM25, SO2, NOX
Introduction
Natural processes and anthropogenic activities release pollutants into the atmosphere which can be hazardous to the health of humans and the environment alike (Patrick et al. 2015). Although emissions occur at a local scale, it is possible for the impact to be observed globally; for example, emissions of carbon dioxide (CO2). This makes atmospheric emissions an important concern that requires attention from the local to the global scale (Pretorius 2015). Emitted pollutants are exposed to different processes in the atmosphere (turbulence caused by convection and stability, wind speed and direction, mixing height and temperature) that control their dispersion and transportation. Finally, the pollutants are transformed over time in the atmosphere to form secondary pollutants. Ultimately, the surface concentration of these trace gases and particulates determine the local air quality of an area (Hunter et al. 2002).
Emissions of criteria pollutants from South Africa's coal-fired power plants are considered significant on a global scale (SA. DEA 2016; Pretorius 2015). This is ascribed to the country's heavy dependence on coal as it has several large coal reserves (Zhou et al. 2009). Von Blottnitz (2006) compared emissions from South Africa's power plants to those in Europe and established that the total emissions of criteria pollutants from South Africa's coal-fired power plants are higher than all the European countries considered.
About 80% of the country's coal reserves are located in the Highveld area; the industrial epicentre of the country. This area houses 11 of the 13 Eskom coal-fired owned power plants as well as other anthropogenic activities (a large petrochemical plant, mining and steel and metal processing facilities) (SA. DEA 2011; Muthige, 2014; Language et al. 2016). The combined impact of these activities degrades local air quality hence why the region was declared as an Air-shed priority area under the National Environmental Management: Air Quality Act (NEM: AQA) (Act no. 39 of 2004).
The impacts of poor ambient air quality are mostly experienced in low-income settlements (Hersey et al., 2014). These settlements are usually associated with high levels of poverty, poor service delivery and lack of resources (Language et al. 2016). Furthermore, they often experience a double burden, which includes poor living conditions as well as exposure to poor ambient air quality levels due to indoor and outdoor air pollution from various sources (John and Sonali 2012). This is since the majority of the people in these settlements do not earn enough to afford clean energy options, so they settle for the affordable and readily available options, for instance, wood, paraffin fuel and coal (Language et al. 2016). Additionally, these settlements are usually located in areas directly impacted by major sources of emission (SA. DEA 2016).
Pressure on the industry from governmental institutions and civil community to reduce air pollution and its carbon footprint are steadily growing (ITA 2018). This includes the emission standards as set in terms of the Air Quality Act, the carbon tax bill that will be implemented at the beginning of 2019 and the alternative energy strategies implemented by the Department of Energy to control industrial emissions (SA. DEA 2016). SA. DEA (2011) acknowledges that various studies agree that the local sources, notably domestic coal burning is responsible for high concentrations of ambient air pollution but this specific contribution has not been adequately addressed nor fully been understood.
The aim of this research is to model the dispersion of emissions of sulphur dioxide (SO2), nitrogen oxides (NOX) and fine particulate matter (PM25), originating from three Eskom power plants, and to evaluate their possible impact on air quality of KwaZamokuhle Township. Air quality assessment is enhanced by using monitoring and modelling to evaluate the most effective emissions mitigation strategies. Therefore, a combination of AERMOD dispersion modelling and ambient air quality monitoring data have been used to achieve the aforementioned aim of this study.
Methodology
Study area
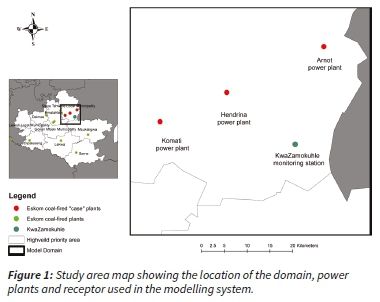
KwaZamokuhle Township is a low-income settlement located on the Highveld (26.1346S, 29.7317E) in the Mpumalanga province within the Highveld priority area. The township has three Eskom power plants within 50km; Arnot (22.5km SSE), Komati (27.3km ESE) and Hendrina (18.3km SE) (Figure 1).
The average monthly income of KwaZamokuhle Township is approximately R1 965 per household with an unemployment rate of 45% (STATS SA 2011). The Township is characterised by a fairly young population with a median age of 24 years (STATS SA 2011). The most common energy source used in KwaZamokuhle Township is coal with approximately 74% of the households depending on it as a primary source of energy. On average, each household uses between 141kg of coal in summer and 246kg in winter (Langerman et al. 2016).
AERMOD
Dispersion modelling is the standard method for analysing the impact of emissions from air pollution sources (Cora and Hung 2003; US EPA 2005). The model consists of a mathematical expression of the dispersion and chemical transformation of pollutants in the atmosphere (Cora and Hung 2003). This is done by estimating downwind air pollution concentrations for a given time frame, at potential receptor sites (Mtiya 2013).
AERMOD is a steady-state plume dispersion model, which uses a Gaussian and bi-Gaussian approach (US EPA 2002; Touma et al. 2007). It is applicable to near-source emissions and up to least 50 km (US EPA 2002). The model has proved to be an effective tool in modelling the dispersion of tall stack emissions (Perry et al. 2005; Buthelezi 2010; Mtiya 2013). There are three main types of data input required in AERMOD, i.e., information on the source (including emission rates, heights and locations), meteorological data and the local topography of the area of interest.
AERMET
AERMET provides a meteorological pre-processor for consolidating available meteorological data into a fixed planetary boundary layer (PBL) format appropriate for use in AERMOD. This is achieved by computing distinctive surface parameters and meteorological measurements (US EPA 2016a). Wind speed and direction, ambient pressure and temperature, albedo, Bowen ratios and cloud cover were used as input data. Hourly dataset containing the aforementioned parameters was obtained from Lakes Environmental Software, Canada for the period 2015-2017 and used as input of the AERMET preprocessor. The modelled data included hourly surface and upper air meteorology data in a processed grid cell format, with 26.6484 S, 27.9256 E as the grid cell centre.
AERMAP
AERMAP allows for the processing of terrain data, including a layout of the receptor sites and sources (Touma et al. 2007). It can process several standardised data formats, which makes it possible to produce terrain base elevations for specific receptors and sources as well as a hill height scale value for each respective receptor (US EPA 2016b). To calculate the terrain height scale for the receptor location, AERMAP uses gridded data that makes it possible to calculate the divided streamline height.
The topographic data required by AERMAP was obtained from SRTM1 (Shuttle Radar Topography Mission), whereas, the land cover data was attained from (WebGIS), with a resolution of (~30m). Studies have shown that SRTM datasets have limitations- large outliers and voids exists in the dataset; the accuracy of the data decreases with an increase in elevation and slope; and it shows features like buildings and forests which can increase the error bar in studies like this (Karwel and Ewiak 2008; Gorokhovich and Voustianiouk 2006). The WGS84 projection datum was used, with the terrain data calculated based on the UTM coordinate system (35 South). The receptors' grid was set at 2000m by 2000m with 2500 points. KwaZamokuhle Township monitoring station was added as a sensitive discrete receptor in order to evaluate the simulated concentrations at the settlement.
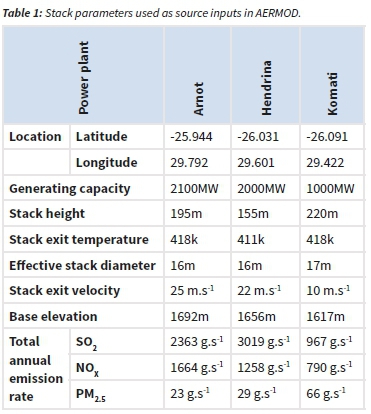
Emission sources as model inputs
Arnot, Hendrina and Komati power plants were considered as the emission sources in this study due to their proximity to the low-income settlement in question (Figure 1). The stack parameters used to run the model are shown in Table 1. These parameters were obtained from studies by Pretorius (2015) and Belelie (2017). The source characteristics and emission factors (calculated as an annual average from 2011-2013) used in these studies were obtained directly from Eskom. Emission rates used were converted from t.yr-1 to g.s-1 and were assumed to be constant over the study. The source characteristics and emission factors (calculated as an annual average from 20112013) used in these studies were obtained directly from Eskom Research, Testing and Development (RT&D).
AERMOD was run for an area of 50km x 50km using the configuration co-efficient for rural dispersion and elevated terrain. Upon completion of the model run, output plots of PM25, NOX and SO2 maximum concentrations were obtained for 1-hour, 24-hour and annual averages for the three year period, to allow for the comparison with the ambient air quality standards. Likewise, hourly-generated concentration exceedance output files were generated, which were then related to the measured data drawn from the same location as the discrete receptor in the model.
Ambient monitored data
Monitored air quality data for the period 2015-2017 from KwaZamokuhle Township monitoring site used in the study was obtained from Eskom Research Testing and Development's Climate Change, Air Quality and Ecosystems Management department's database. Clustered columns were used to show the ratio to which the modelled results compare to the measured data.
Results and Discussion
Modelled SO2 concentrations
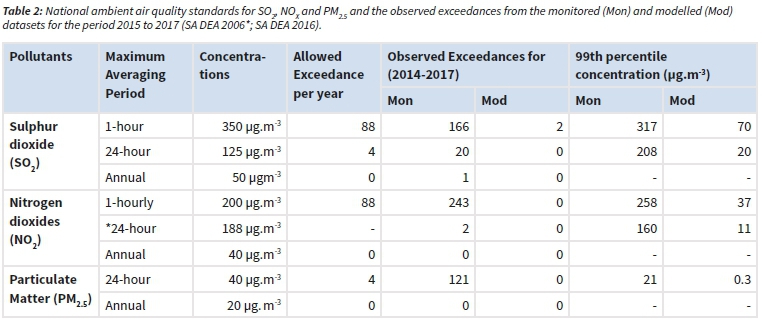
Figures 2 through 4 show the 1-hour, 24-hour and annual average modelled contributions of SO2 found within 50km of KwaZamokuhle Township. The model predicted the hourly average concentrations from the power plants to be above the national ambient air quality standards (NAAQS) with a maximum of 654 Mg.m-3 simulated (Table 2). However, the simulated 24hour and annual concentrations from the three power plants fall within the average standards i.e. 111 Mg.m-3 and 14.2 Mg.m-3, respectively. The simulations show that KwaZamokuhle Township receives hourly average concentrations in the range of 300-400 Mg.m-3, 24-hour averages between 30-50 Mg.m-3 and around 7-8 Mg.m-3 for the annual averages as a result of the power plants emissions.
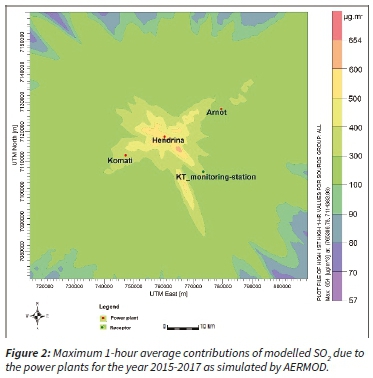
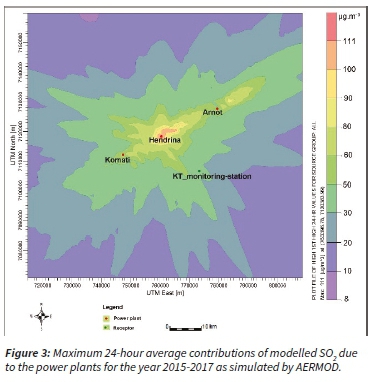
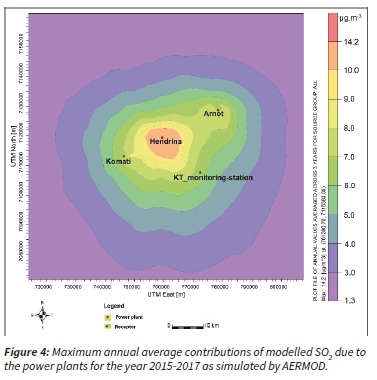
Table 2 displays the national ambient air quality standards and observed exceedances from the two datasets used in the study. The monitored data demonstrates how poor the ambient air in the Township is, for instance, monitored SO2 exceeds the NAAQS for the 24-hour and annual averages. On the other hand, the modelled data only show exceedances 2 times conveying the small contribution from power plants to the ambient concentrations in the township. The same can be said for NOX where exceedances are observed for the monitored 1-hour and 24-hour averages with annual averages showing adherences, while modelled data do not contribute concentrations that exceed the NAAQS in all averaging times. Lastly, monitored 24-hour PM25 exceeds the standard 121 times; about 30 times more than the allowed four exceedances but does not exceed the annual standards. These exceedances in the monitored data convey a possible health risk to the residents of the Township.
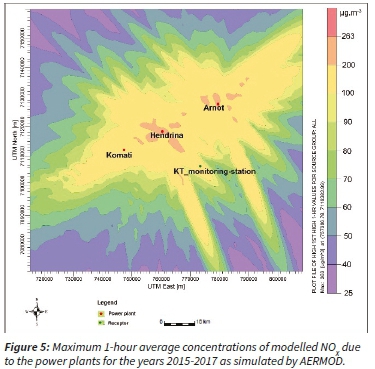
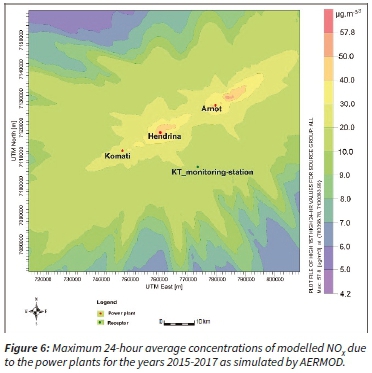
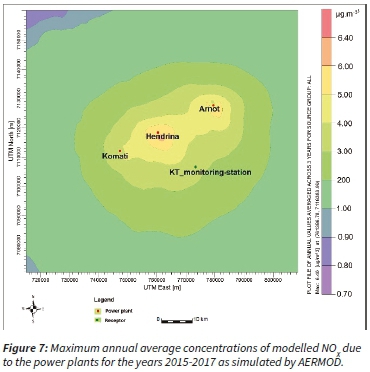
Modelled NOx concentrations
The maximum 1-hour average NOX concentration simulations for the three power plants exceeds the South African standards, while the maximums for the 24-hour and the annual averages comply with the standards (Table 2). The model simulated maximum contributions of 263 Mg.m-3, 57.8 Mg.m-3 and 6.40 Mg.m-3 for the averaging periods, respectively (Figures 5 to 7). The average NOX contribution of the three power plants towards the Township was observed to be in the ranges of between 100-200 Mg.m-3, 10-20 Mg.m-3 and 3-4 Mg.m-3 for each averaging period, respectively.
Modelled PM25 concentrations
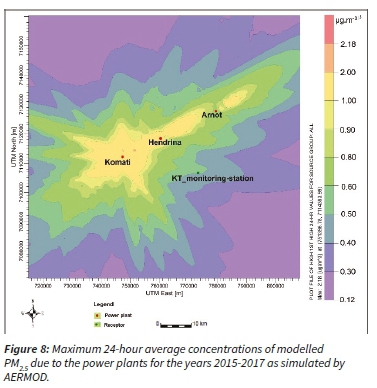
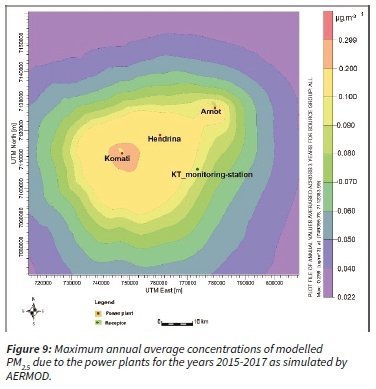
The modelling results show that the power plants contribute very small amounts of primary particulate matter concentrations to the ambient environment in KwaZamokuhle. The results also illustrate that at the discrete receptor at the township, maximum contributions ranging between 2-3 Mg.m-3 for the hourly average, 0.5-0.6 Mg.m-3 for the 24-hour average, and 0.090.1 Mg.m-3 for the annual average are observed. Relatively small emissions were observed near the power plants for the daily and annual averages (Figure 8 and 9).
Monthly averages of modelled against monitored SO2, NOX and PM2 5
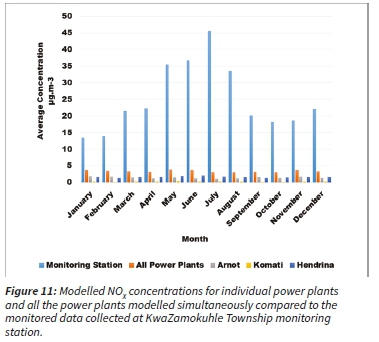
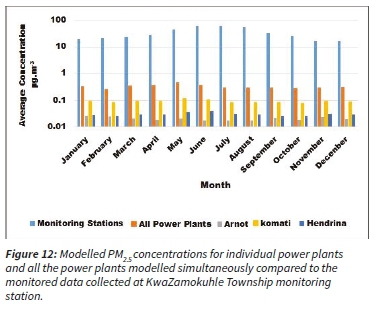
Figures 10 to 12 show the seasonal average concentration contributions of each power plant at KwaZamokuhle Township, the average for the combined power plants, and the measured data at the monitoring site. A general trend observed is that the monitoring site shows high concentration in winter for the three species. The modelled data though does not show the expected seasonal signature for all the three species which is most likely due to the fact that the emission rates were kept at constant throughout the year.
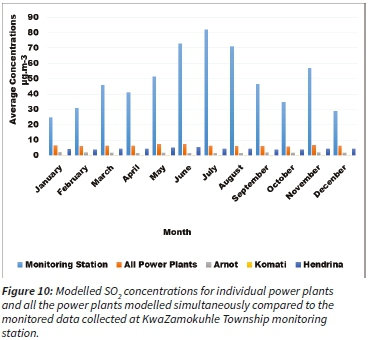
As simulated by the AERMOD, power plants contribute an average of about 6 Mg.m-3 of the 50 Mg.m-3 monitored SO2, which is approximately 13%. Figure 10 shows that Komati is contributing the least with an average of 0.3 Mg.m-3 (0.6%) of the average observed concentrations. Arnot and Hendrina contribute 1.8 Mg.m-3 (3.6%) and 4.3 Mg.m-3 (8.7%) respectively.
Of the criteria pollutants assessed, NOX has the highest relative contribution to the measured KwaZamokuhle Township levels, i.e., 3.4 Mg.m-3 (16.9%). Similar to SO2 Komati is the smallest contributor of NOX, with an average contribution of 0.28 Mg.m-3 (1.4%) of the total, whereas Arnot and Hendrina contributed 1.47 Mg.m-3 (7.2%) and 1.7 Mg.m-3 (8.4%) of the total 20.35 Mg.m-3 measured NOX concentrations.
The contribution of PM2.5 is much lower compared to SO2 and NOX. As depicted in Figure 12 the average concentrations for the three power plants combined are approximately 0.095 Mg.rrv 3, which is 0.2% of 48.6 Mg.m-3, measured at KwaZamokuhle Township monitoring site. The highest simulated values were observed at Komati, which had an average of 0.04 Mg.m-3, i.e., 0.08% of the average monitored PM2.5. Arnot contributes to an average prediction of 0.04%. The model simulated an average of 0.03 Mg.m-3 at Hendrina, which translate to 0.06% of the measured concentrations.
Comparison of the temporal variations in the modelled and monitored data
According to Carslaw (2015), variations of pollutions by time can be useful in revealing the likely sources. Figures 13 to 15 show the normalized diurnal and monthly patterns of the modelled contributions (powerplants) in comparison to the variations in the measured data from the KwaZamokuhle Township monitoring site. The plots were generated at 95% confident interval in the mean, applying the normalised option. Normalisation is adjusting values with different scales to an estimated common one (Carslaw 2015) which is useful in comparing the patterns of the two (modelled and monitored) datasets that had distinct ranges in concentrations. The simulations showed that the model did not agree with the measurements during the nighttime in all instances, i.e., between 18:00 and 6:00 the graphs show low values. AERMOD neglects the residual plumes and it lacks the ability to approximate secondary formation of pollutants such as sulphates and nitrates produced during the day that impact on the ambient air quality during the stable night-time periods (US EPA 2005).
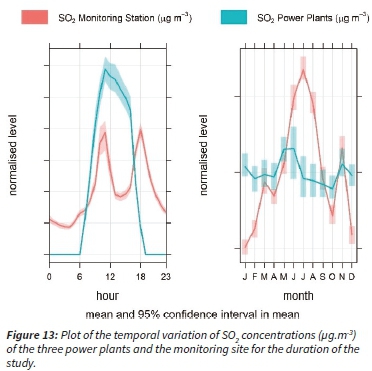
The diurnal plot of the modelled concentrations shows a peak at around mid-day due to the break-up of the inversion layer and downward mixing, which occurs at the same time as one of the two peaks observed for the monitoring data (Figure 13). The early evening peaks can likely be attributed to other local sources other than the power stations. Nkosi (2018) reported that low-cost fuels (wood, coal and dung) are the main sources of energy in low-income settlements on the Highveld, with burning events dominant between 16:00 and 19:00.
Measured values show distinct seasonal patterns which can be attributed to the variation in burning events. In winter the events are less variable than in the summertime hence the peak in winter (Nkosi 2018). Modelled data does not show much variation throughout the year, with little changes as a result of meteorological conditions, for instance, a dip observed around June and July is most possibly due to stable winter conditions.
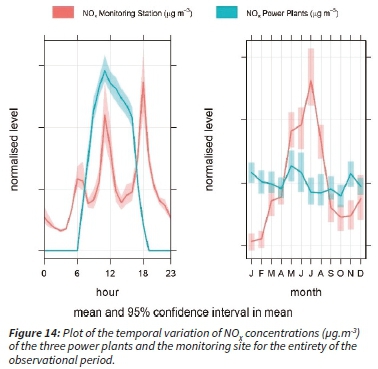
In the case of NOX (Figure 14), three peaks were observed for the monitored data, with the early morning and the evening peaks typical of low-level sources. A study by Nkosi (2018), observed that there are two common burning events i.e. morning and evening burning. The third peak observed around 10 am, which is mutual for the modelled and monitored data can be attributed to the downward mixing of tall-stack emissions. For the monthly variations, a peak is observed in the winter due to increased burning events since apart from cooking space heating is intensified. A drop is observed for the modelled data in winter due to calm conditions experienced during this time.
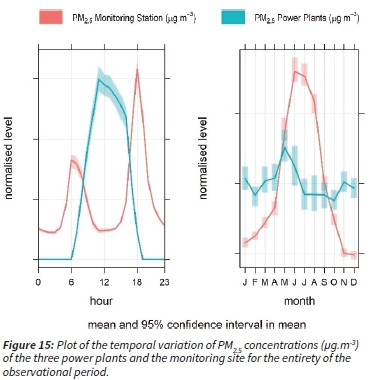
Low-level sources typically show a bimodal distribution with higher peaks observed in the early morning and evening, which was observed from the monitoring data. Like the other species, simulated PM2.5 peaks around mid-day (Muthige 2014). This can be related to the breakup of inversion layers and downward mixing of the tall stack emissions. Nonetheless, unlike the previous two species, its peak coincides with a dip in the monitored concentrations. This together with the two peaks observed during the morning and evening times indicate that there are other major sources besides power plants, with domestic combustion the most probable. Nkosi (2018) substantiate the assumption by affirming that domestic burning is a major source of PM2.5. The monthly trend is the same as the previous species with a maximum being observed in winter for the monitored data and not much variation for the modelled.
Conclusion
In this study, the possible impact of Eskom coal-fired power plants on the ambient air quality in KwaZamokuhle Township was evaluated through modelling with AERMOD. This was investigated by comparing simulated and monitored data for the period 2015-2017. Three power plants were considered with PM2.5, NOX and SO2 being analysed as the criteria pollutants. Secondary particulate formation, detailed meteorological effects were not modelled by AERMOD and the peak short-term impacts were under estimated by the model when simulating annual average concentrations and these were perceived as limitations of this study.
The results showed that the contribution of the power plants as compared to the measured data is small. It may be concluded that poor ambient air quality in the community is not solely attributable to emissions from the surrounding power plants but may be originating from other sources as well. It is evident that local sources, specifically domestic burning, may be the dominant contributor to poor air quality over KwaZamokuhle. The frequency in exceedance of the NAAQS suggests that the residents of the low-income settlement may be susceptible to health risks associated with these criteria pollutants. Temporal variations in the measured data supports this argument in that daily peaks were observed during the morning and evening-a diurnal variation pattern commonly associated with low-level sources like domestic combustion.
Therefore, existing strategies that focus predominantly on the industrial sector may not be successful in improving ambient air quality. Local sources like solid fuel burning, waste burning, dust, and vehicles, should be included in order to come up with reduction mechanisms. This is important as these sources are located at ground level and in close proximity to humans.
Acknowledgements
The success of this study required a lot of guidance and assistance from many people and I am extremely privileged to have acquired this from the onset and throughout the study. I would like to thank Eskom Research Testing and Development's Climate Change, Air Quality and Ecosystems Management Department for the monitoring data.
Authors' Contributions
P. Chidhindi developed the theory and wrote the manuscript. S. Piketh and R. Burger conceived of the original idea, devised the project and the main conceptual ideas. M. Belelie and P. Chidhindi were involved in the modelling of the emissions and the analysis of the results while S. Piketh, R. Burger and G. Mkhatshwa verified the analytical methods. R. Burger and M. Belelie developed the normalised graphs while S. Piketh and P. Chidhindi computed the clustered columns. S. Piketh, R. Burger and G. Mkhatshwa provided data and supervised the project. All authors were involved in the discussion of the results and commented on the manuscript.
References
Belelie M.D. 2017 'Emissions of mercury from the power sector in South Africa', Potchefstroom: NWU, (Dissertation-MSc). [ Links ]
Carslaw D.C. 2015. 'The openair manual-open-source tools for analysing air pollution data'. Manual for version 1.1-4, King's College London. [ Links ]
Cora M.G. and Hung Y.T. 2003, 'Air dispersion modelling: a tool for environmental evaluation and improvement', Environmental Quality Management, 12(3):75-86. https://doi.org/10.1002/tqem.10075 [ Links ]
Gorokhovich Y., & Voustianiouk A. 2006. 'Accuracy assessment of the processed SRTM-based elevation data by CGIAR using field data from USA and Thailand and its relation to the terrain characteristics'. Remote Sensing of Environment, 104(4): 409-415. https://doi.org/10.1016/j.rse.2006.05.012 [ Links ]
Hersey S.P., Garland R.M., Crosbie E., Shingler T., Sorooshian A., Piketh S. & Burger R. 2014 'An overview of regional and local characteristics of aerosols in South Africa using satellite, ground, and modelling data', Atmospheric Chemistry & Physics Discussions, 14:24701-24752. https://doi.org/10.5194/acpd-14-24701-2014 [ Links ]
Hunter D., Salzman J. & Zaelke D. 2002, 'International environmental law and policy', New York: Foundation Press. [ Links ]
International Trade Administration (ITA). 2018, 'South Africa -Pollution Control Equipment', https://www.export.gov/article?id=South-Africa-pollution-control Date of access: 9 Oct. 2018. [ Links ]
John J. and Sonali D. 2012, 'Vulnerability of a low-income community in South Africa to air pollution: Exploring the use of structural equations modelling to identify appropriate interventions', Journal of Integrative Environmental Sciences, 9(2):55-67. https://doi.org/10.1080/1943815X.2012.662512 [ Links ]
Karwel A.K., & Ewiak I. 2008, 'Estimation of the accuracy of the SRTM terrain model on the area of Poland'. The international archives of the photogrammetry, remote sensing and spatial information sciences, 37(B7): 169-172. [ Links ]
Langeman K., Wernecke B., Mkhatshwa G., Herbst D., Piketh S., Burger R., Pauw C. 2015, 'Domestic Fuel Burning Emission Reduction: Eskom's KwaZamokuhle Pilot Study', National Association of Clean Air Conference, Bloemfontein. [ Links ]
Language B., Piketh S.J., Wernecke B. & Burger R. 2016, 'Household Air Pollution in South African Low-income Settlements: A Case Study. WIT Transactions on Ecology and the Environment', 207: 227-236. https://doi.org/10.2495/AIR160211 [ Links ]
Mtiya K.S. 2013, 'Modelling the dispersion of SO2 emissions from the chevron (Cape Town) oil refinery using the US EPA dispersion models AERMOD and CALPUFF', Cape Town: CPUT, (Dissertation-MTech). [ Links ]
Muthige M.S. 2014, 'Ambient air quality impacts of a coal-fired power station in Lephalale area' Johannesburg: WITS, (Dissertation-PhD). [ Links ]
National Environmental Management: Air Quality Act (NEM: AQA) (Act no. 39 of 2004). Government Gazette No. 27318, 24 February 2005, https://www.environment.gov.za/sites/default/files/legislations/nema_amendment_act39.pdf [ Links ]
Nkosi N.C., 2018, 'Quantifying particulate emissions from domestic burning in kwaDela Township, Mpumalanga, Potchefstroom: NWU, (Dissertation-MSc). [ Links ]
Patrick D.L., Murray, T.P., Sullivan, R.K. & Kimmell, K.L. 2015, 'Health & environmental effects of air pollution', http://www.mass.gov/eea/docs/dep/air/aq/health-and-env-effects-air-pollutions.pdf Date of access: 04 Apr. 2018. [ Links ]
Perry S.G., Cimorelli A.J., Paine, R.J., Brode, R.W., Weil J.C., Venkatram A., Wilson R.B., Lee, R.F., & Peters W.D. 2005. 'AERMOD: A dispersion model for industrial source applications. Part II: Model performance against 17 field study databases'. Journal of Applied mMteorology, 44(5), 694-708. https://doi.org/10.1175/JAM2228.1 [ Links ]
Pretorius I. 2015, 'Impacts and control of coal-fired power station emissions in South Africa', Potchefstroom: NWU, (Dissertation-PhD). [ Links ]
South Africa. Department of Environmental Affairs (SA. DEA). 2006. State of the air report 2005. https://www.environment.gov.za/sites/default/files/docs/stateofair_executive_iaiquality_standardsonjectives.pdf [ Links ]
South Africa. Department of Environmental Affairs (SA. DEA). 2011, "Government Gazette No. 27318, 24 February 2005". https://www.environment.gov.za/sites/default/files/legislations/nema_amendment_act39.pdf Date of access: 04 Apr. 2018. [ Links ]
South Africa. Department of Environmental Affairs (SA. DEA). 2011, 'Highveld priority area air quality management'. https://www.gov.za/documents/national-environmental-management-air-quality-act-highveld-priority-area-air-management Date of access 10 Apr. 2018. [ Links ]
South Africa. Department of Environmental Affairs (SA. DEA). 2016, 'Draft strategy for addressing air pollution in dense low-income communities. Government Gazette No. 40088, 24 June 2016', https://www.environment.gov.za/sites/default/files/gazetted_notices/airpollution_strategy_g40088_gen356.pdf Date of access 10 Apr. 2018. [ Links ]
Statistics South Africa (Stats SA). 2011, 'KwaZamokuhle', http://www.statssa.gov.za/?page_id=4286&id=11564 Date of access 15 Mar. 2018 [ Links ]
Touma J.S., Isakov V., Cimorelli A.J., Brode R.W., & Anderson B., 2007, 'Using Prognostic Model Generated Meteorological Output in the AERMOD Dispersion Model: An Illustrative Application in Philadelphia, PA', Journal of the Air & Waste Management Association, 57(5): 586-595. https://doi.org/10.3155/1047-3289.57.5.586 [ Links ]
U.S Environmental Protection Agency (US EPA). 2002, 'Guidance for quality assurance project plans for modelling. EPA QA/G-5M', Report EPA/240/R-02/007, Office of Environmental Information, Washington, D.C. [ Links ]
U.S Environmental Protection Agency (US EPA). 2005, 'Guideline on Air Quality Models: 40 CFR Part 51', Appendix W. Research Triangle Park, North Carolina. [ Links ]
U.S. Environmental Protection Agency (US EPA). 2016a, 'User's Guide for the AERMOD Meteorological Pre-processor (AERMET)', Office of Air Quality Planning and Standards, Research Triangle Park, North Carolina. [ Links ]
U.S. Environmental Protection Agency (US EPA). 2016b, 'User's Guide for the AERMOD Terrain Pre-processor (AERMAP)', Office of Air Quality Planning and Standards, Research Triangle Park, North Carolina. [ Links ]
Von Blottnitz, H. 2006, 'A comparison of air emissions of thermal power plants in South Africa and 15 European countries', Journal of Energy in Southern Africa, 17(1):72-81. [ Links ]
Zhou P.P., Yamba F.D., Lloyd P., Nyahuma L., Mzezewa C., Kipondya F., Keir J., Asamoah J. & Simonsen H. 2009, 'Determination of regional emission factors for the power sector in Southern Africa', Journal of Energy in Southern Africa, 20(4). [ Links ]
Received: 21 November 2018
Reviewed: 7 January 2019
Accepted: 5 March 2019

