


Services on Demand
Article
 English (pdf)
 Article in xml format
 Article references
Indicators

Related links
-
 Cited by Google
 -
 Similars in Google
Share

 Permalink
Clean Air Journal
On-line version ISSN 2410-972X
Print version ISSN 1017-1703
Clean Air J. vol.28 n.2 Pretoria 2018
http://dx.doi.org/10.17159/2410-972x/2018/v28n2a20
RESEARCH ARTICLE
Spatial and temporal trends of PM₁₀ and SO₂ in the Richards Bay area
Nick O. OkelloI, *; Sandy CammingaII; Tom W. OkelloI; Mark ZunckelIII
IUniversity of Free State, Private Bag X13, Kestell Rd, Phuthaditjhaba, 9866, Free State, South Africa, 2017515335@ufs4life.ac.za and OkelloTW@ufs.ac.za
IIRichards Bay Clean Air Association (RBCAA), Richards Bay, KwaZulu-Natal, South Africa, camminga@iafrica.com
IIIuMoya-NILU Consulting, Durban, KwaZulu-Natal, South Africa, mark@umoya-nilu.co.za
ABSTRACT
Air pollution is a public health emergency (WHO, 2016a). It is the biggest environmental risk to health with a global responsibility for about 1 in 9 deaths annually. In 2013, Statistics SA indicated that 10 % of all deaths in South Africa were attributed to respiratory diseases. Areas with increased industrial growth such as Richards Bay are particularly vulnerable. The paper analyses the spatial and temporal concentration trends of PM₁₀ and SO₂ in Richards Bay over the last two decades; specifically, since the promulgation of national ambient air quality standards (NAAQS) and minimum emissions standards (MES). Mann-Kendell trend tests was applied to monitoring data from the Richards Bay Clean Air Association (RBCAA) to test for an improving or worsening trend and the significance thereof. The pollution concentration data was also compared to NAAQS and the WHO annual guidelines. Overall, results indicate that although there has been a downward trend in the concentration of PM₁₀ and SO₂ emissions in the study area, the trends are not statistically significant. However, there was indication of statistically significant reducing trends in ambient concentrations at some stations. The concentrations at all stations were however below NAAQS.
Keywords: Air quality, trends, status, Richards Bay.
Introduction
Air pollution is a public health emergency with the biggest environmental risk and carries a global responsibility for about 1 in 9 deaths annually (WHO, 2016a). In 2015, close to 10 % of all deaths in South Africa were attributed to respiratory diseases (Stats SA, 2016a).
It is known that industrial growth often results in increased emissions and with this a concern for people's health (Cohen et al., 2004; Scorgie, 2012). Research has shown that air pollution exacerbates and increases the probability of infections such as acute lower respiratory infections (ALRI) which include acute bronchitis and bronchiolitis, influenza and pneumonia. In addition, air pollution is associated with stroke, chronic obstructive pulmonary disease (COPD) including chronic bronchitis and emphysema as well as ischemic heart disease (IHD) and cancers of the trachea, bronchus and lung (Chiu, 2013; World Health Organization, 2016).
Whereas accelerated industrial growth is an important aspect to unlock poverty and improve people's livelihoods, environmental considerations are important to moderate potential adverse effects. Pollution trends in growing areas such as Richards Bay need to be monitored to provide a basis for advice and planning for future development and most importantly to protect people and the environment.
To understand the potential for burden of disease due to air pollution, and to ascertain whether policy intervention or other drivers have led to an improvement in in air quality, it is important to understand the spatial and temporal trends of air pollution. This paper focuses on analyses of two pollutants of concern PM₁₀, as well as SO₂, and their concentration over the last two decades and specifically since the promulgation of national minimum emissions standards.
Study area
Richards Bay is a growing metropolitan with a number of industries in relatively close proximity to residential areas (Okello and Allan, 2015). The city is an economic centre and one of the country's strategic economic hubs designated as an 'Area of National Economic Significance' (uMhlathuze Municipality, 2016). The city hosts the largest coal export terminal in the world, which is the second largest port in South Africa as well as the largest aluminium and iron smelters in Africa. In addition, the City also hosts several commercial, light and heavy industrial activities such as paper, fertilizer and sugar production, which collectively contribute to most of the air quality concerns in the region. Sugarcane and forestry burning, pesticide usage and dust associated with agricultural processes are also common.
The City has a population of 364, 473 (Stats SA, 2016b) and an area of 1233.3 km2 (Cogta, 2017). The geographical areas covered include suburbs such as Esikhaleni, Arboretum, Felixton, Mtunzini, Veld n Vlei, Enseleni, as well as the Central Business District (CBD). These areas are well representative of the entire Richards Bay and surroundings.
Air quality review
Air pollution definition and its effects
The National Environmental Management Air Quality Act (NEM: AQA, 39 of 2004) defines "air pollution" as any change in the composition of the air caused by smoke, soot, dust (including fly ash), cinders, solid particles of any kind, gases, fumes, aerosols and odorous substances. This definition is not far from the WHO, which defines air pollution as a contamination of the indoor or outdoor environment by any chemical, physical or biological agent that modifies the natural characteristics of the atmosphere (World Health Organization, 2016). Consequently, air pollution increases the risk of respiratory and heart disease in the population. Both short and long-term exposure to air pollutants has been associated to health impacts. More severe impacts affect the already ill, children, the elderly and poor people who are more susceptible (Chiu, 2013); (Craig et al., 2007); (WHO, 2013, 2016b). This is also the case in South Africa and in Richards Bay (Jaggernath, 2013).
Pollutants of major public health concern include particulate matter (PM), carbon monoxide (CO), ozone (O3), nitrogen dioxide (NO2) and sulphur dioxide (SO₂). While risk is depended on the exposure dose and time, the South African Department of Environmental Affairs has declared these pollutants as criteria pollutants (DEA, 2011). The health risks associated with particulate matter of less than 10 and 2.5 microns in diameter (PM₁₀ and PM2.5 respectively) is well documented (Cohen et al., 2004; Craig et al., 2008). PM2.5 is capable of penetrating deep into lung passageways and entering the bloodstream causing cardiovascular, cerebrovascular and respiratory impacts (Rai, 2015). There is good evidence of the effects of short-term exposure to PM10 on respiratory health particularly irritation and acute respiratory disorders, but for mortality, and especially as a consequence of long-term exposure, PM2.5 is a stronger indicator (WHO, 2016c).
Additionally, PM from aerospora is linked to the onset of influenza and allergic cases especially during summer and spring (Renaut and Bamford, 2004). SO2 is known to affect the respiratory system and the functions of the lungs and causes irritation of the eyes. Consequently, the inflammation of the respiratory tract causes coughing, mucus secretion, aggravation of asthma and chronic bronchitis and makes people more prone to infections of the respiratory tract (World Health Organization, 2016). From an ecological perspective, when SO2 combines with water, it forms sulphuric acid; this is the main component of acid rain.
In 2007, an estimated 3.7 % of national cardiopulmonary disease related deaths and 5.1 % of trachea, bronchus and lung cancers in adults older than 30 years were attributed to ambient air pollution (CSIR, 2015). In 2013, Statistics SA indicated that 10 % of all deaths were attributed to respiratory diseases.
Legislation and policy instruments for air emissions reduction
From a policy perspective, WHO global emission standards are useful to gauge pollution (WHO, 2005). South Africa too has an enabling legal framework that sets out the minimum emission standards for point source pollution as well as ambient air quality standards (DEA, 2010). The Atmospheric Pollution Prevention Act (APPA) was enacted in 1965 and was repealed on 1st April 2010 with the National Environmental Management: Air Quality Act (NEM: AQA) which was partially enacted on 9th September 2005 and fully enacted on 1 April 2010. In order to protect human health and the integrity of the environment, the national ambient air quality standards covering priority pollutants including PM₁₀ and SO₂ were introduced on 24th December 2009. Similarly, industrial emission standards were developed and formally introduced on 22nd November 2012 (DEA, 2010). These were revised in 2013 (DEA, 2012).
Until now, the influence of these policy instruments has not been adequately reviewed in the context of a reduction of the health risks that are attributable to air pollution in Richards Bay. The key question of whether these policy instruments have been adequate, and their implementation is producing the desired effect is an important aspect that needs to be investigated.
Table 1 and Table 2 represent the National Ambient Air Quality Standards (NAAQS) for PM₁₀ and SO₂ respectively as the focus pollutants in this paper.
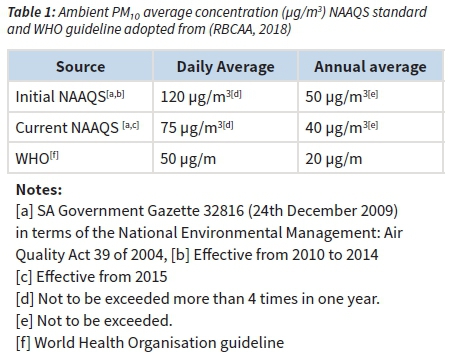
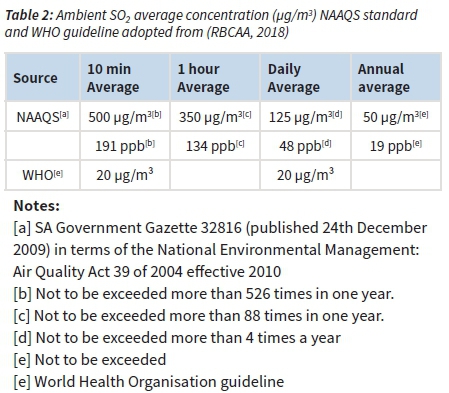
In this study, only the annual average limit of the national ambient standards was considered consistent with other national and international air quality trend studies and long-term exposure (Mohan and Kandya, 2007; Colette et al., 2011; Guerreiro et al., 2014; Butt et al., 2017). Data is however aggregated from the daily averages and thus diurnal fluctuations have been considered.
Global and local trends in air emission concentration
On a global scale, a study conducted by Butt et al.(2017), estimates that global population-weighted particulates concentrations increased by 37.5 % over the period 1960 to 2009. Increases in China and India were dominant, attributed to economic expansion, and growth in emissions. The study also concluded that in contrast, air quality regulation and emission controls in the European Union (EU), and United States (US) have reduced population-weighted PM2.5 concentrations over the same period.
WHO compared 795 cities in 67 countries for levels of small and fine particulate matter (PM₁₀ and PM2.5) during the five-year period, 2008-2013. In the study, global urban air pollution levels increased by 8 %, despite improvements in some regions.
Despite very sparse pollution data in the Africa region, the study revealed that PM levels remained above the world median (WHO, 2016a).
In South Africa, the air quality in most urban centres is considered relatively good. However, there are a number of "hotspots" around the country where severe air quality problems are experienced (Gwaze, 2017). High ambient SO₂, NO₂ and PM₁₀ concentrations are common in these areas and are primarily a result of fossil fuel burning in the residential areas as well as from industrial and power generation sources (Scorgie, 2012). The State of Air Report for South Africa indicates that PM is still the greatest national cause for concern in terms of air quality due to numerous pollution sources but climatic conditions are also a major factor (Khumalo, 2016).
Areas considered as priority include Highveld Priority Area, Vaal Triangle Priority Air-Shed, and Waterberg Bojanala Priority Area (DEA, 2018). These areas are highly polluted mainly due to anthropogenic influence. They are declared as priority areas due to heavy industrial pollution that often exceeds the NAAQS (DEA, 2018).
Despite the implementation of air pollution interventions, the air quality is said to remain poor and noncompliant with ambient standards. One could argue that the Richards Bay area may have similar characteristics to these priority areas given the number and scale of industrial operations, pollutant sources and history of emission concentration (Renaut and Bamford, 2004; Scorgie, 2012). Indeed, a study conducted in 2011-2013, focusing on perceptions of air pollution in different suburbs based on economic class concluded that air quality is a priority for the residents of Richards Bay in general and poorer areas are mostly affected by probably as a result of higher solid fuel burning compared the fuel sources in the more affluent sections of the area (Jaggernath, 2013).
Methodology
Data collection
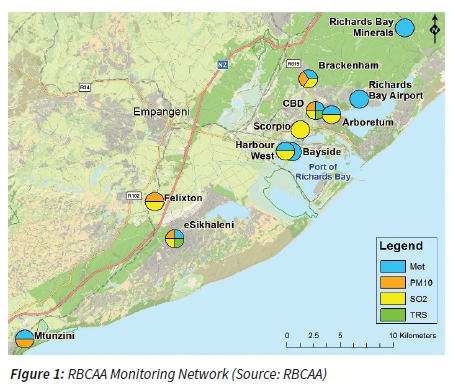
The ambient air quality data used in these analyses was obtained from the Richards Bay Clean Air Association (RBCAA). Since 1997, the RBCAA has grown and established a real time monitoring network able to characterise the local ambient air quality by monitoring ground level pollutant concentrations (Okello and Allan, 2015). The monitoring network, operated, maintained and managed by an external service provider, comprises 11 continuous monitoring stations, recording meteorological data, SO₂, PM₁₀ and Total Reduced Sulphide (TRS) concentrations.
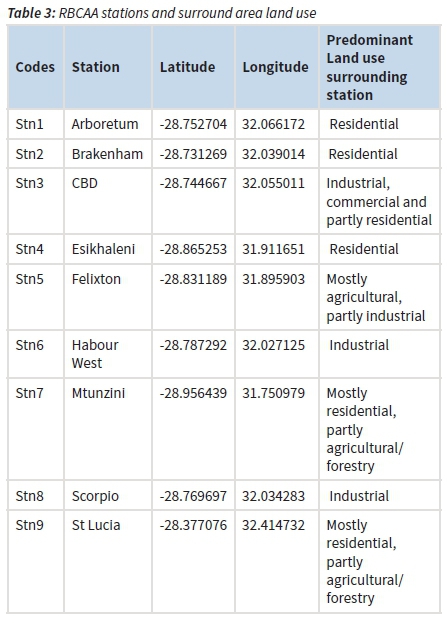
Table 3 show the RBCAA stations and surrounding land use areas while Figure 1 shows the spatial locations of the stations.
The monitoring and data collection network is robust and well maintained, with a system in place that satisfies the South Africa National Accreditation System (SANAS) requirements (RBCAA, 2018). Furthermore, the appointment of an external service provider allows the RBCAA to remain objective and independent from the results (Okello & Allan, 2015). The RBCAA submit data to the Department of Environmental Affairs' South African Air Quality Information System (SAAQIS). This data is also submitted to the WHO Global Ambient Air Quality Database from which WHO derives the global ambient air quality concentrations.
Daily average data per station from 1997 to 2017 was aggregated into annual averages for the nine stations. Seven of these stations are in Richards Bay within the City of uMhlathuze municipality while two are in neighbouring municipalities (St. Lucia station in Mtubatuba and Mtunzini in uMlalazi Municipalities respectively). The St. Lucia and Mtunzini stations were considered as reference sites for PM₁₀ given the predominant North Easterly and South Westerly wind directions in the area. Seven of the nine stations had PM₁₀ data while six had SO₂ data.
Data availability per station was considered. Data used was filtered to include capture/ availability of over 80% as much as possible where enough data was available.
Trend analyses
Data was analysed using Mann Kendall test (MK-tests) which has been used widely to statistically analyse for trends in climatologic and in hydrologic time series (Guerreiro, Foltescu and deLeeuw, 2014; Koudahe et al., 2017). This test is used to analyse data collected over time for consistently upward or downward trends ("monotonic trends"). The advantage of the MK-tests is that it is a non-parametric test. This means it works for all distributions including for data that is not normally distributed. Also the test can be used to find trends for as few as four samples (Guerreiro, Foltescu and deLeeuw, 2014). Nonetheless, the more data points analysed the more the likelihood to find a true trend (as opposed to chance). The minimum number of recommended measurements is therefore at least 8 to 10 (Colette et al., 2011; Karmeshu, 2015; Pohlert, 2018).
According to this test, the null hypothesis H0 assumes that there is no trend (the data is independent and randomly ordered) and this is tested against the alternative hypothesis H1, which assumes that there is a trend. Data values are evaluated as an ordered time series. Each data value is compared with all subsequent data values considered. If a data value from a later period is higher than a data value from an earlier period, the statistic S is incremented by one. On the other hand, if the data value from a later period is lower than a data value sampled earlier, S is decremented by 1. The net result of all such increments and decrements yields the final value of S (Shahid, 2011). The MK-test statistic S is calculated using the formula below (Gilbert, 1987).
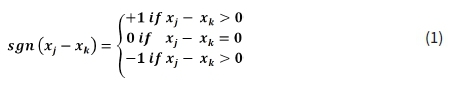
where xj and xk are the annual values in years
j and k, j > k, respectively.
The S statistic is calculated by summing over all pairs of values:

S will be negative for a negative trend, zero for no trend, and positive for an upward trend.
For n≤10, the p value is taken from a table of exact values (Gilbert, 1987). For n>10, a normal approximation is used, that is by determining the total number of groups of ties g and the number of tied values tj within each group, in the sorted sequence. Then the standard deviation of S is estimated using the formula:

The z statistic is then:
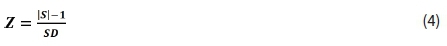
The Z value is then used to calculate p from the cumulative normal distribution. If the p value is less than the significance level α (alpha) = 0.05, H0 is rejected. Rejecting H0 indicates that there is a trend in the time series, while accepting H0 indicates no trend could be detected. On rejecting the null hypothesis, the result is said to be statistically significant. (Helsel and Hirsch, 2002; Mohan and Kandya, 2007).
Results and findings
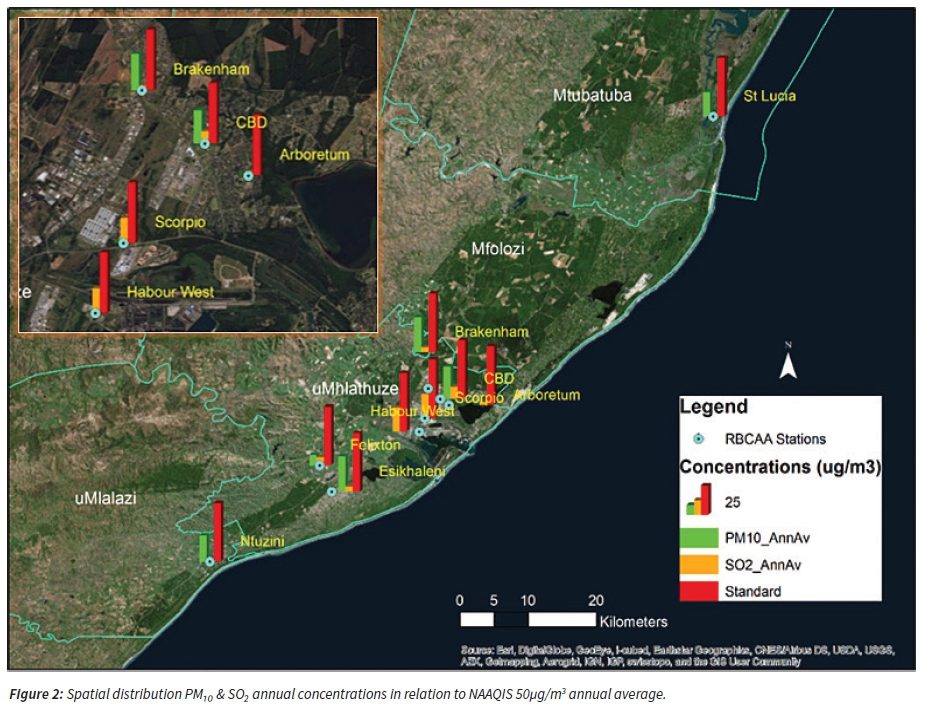
Overall since 1997, for the Richards Bay area, the PM₁₀ and SO₂ trends examined for significance indicated a reducing trend at 95% significance level. However, the trends were not deemed statistically significant using the Mann-Kendall test. Figure 2 shows a spatial distribution of the stations and relative PM₁₀ and SO₂ concentrations against the annual average of the NAAQS.
Particulate matter (PM10)
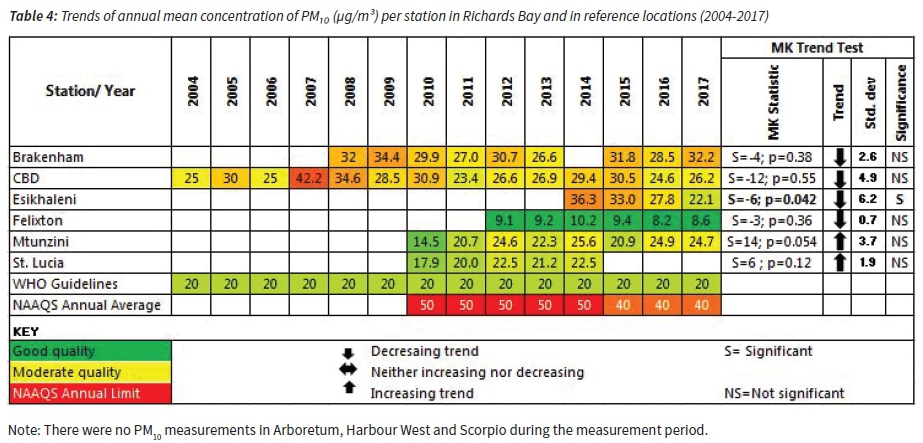
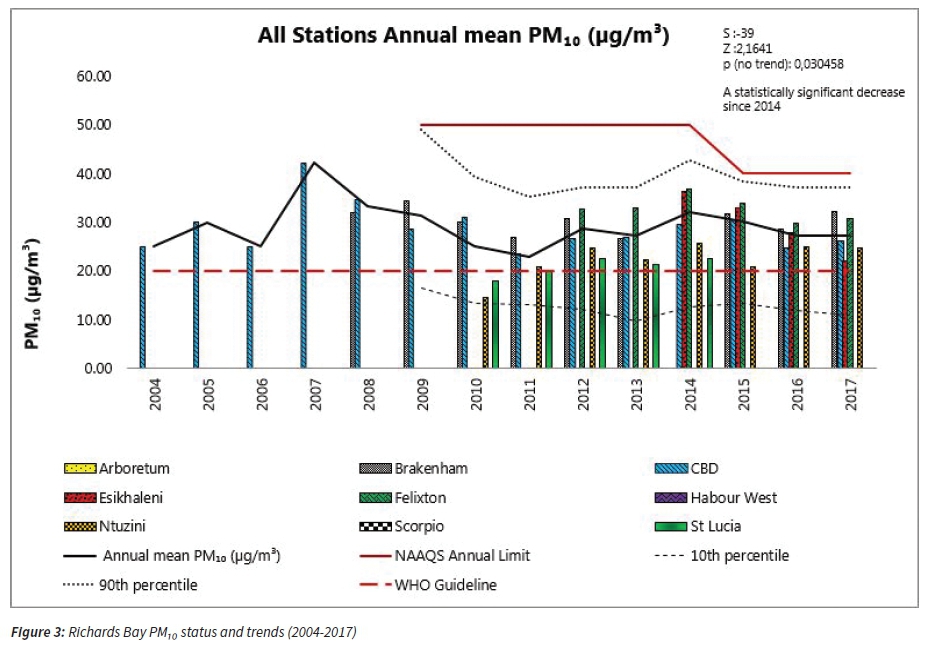
The data analysed indicates that there was a statistically downward trend in ambient PM₁₀ concentrations over last 14 years. Caution was however taken due to the lower number of stations used for sampling prior to 2009. When the same data was taken from 2009 to 2017, a downward trend was observed but it was not statistically significant. In Table 4, the results indicate that null hypothesis H0 was accepted for 5 out of 6 stations where PM₁₀ data was available. This means no significant trends. A downward trend was observed in four stations (Brakenham, CBD, Esikhaleni and Felixton) (Table 4). Only the decrease at Esikhaleni was determined to be statistically significant although sampling had only been a short period of time (2014 to 2017). Mtunzini and St. Lucia, the reference site, had upward trends but was not statistically significant. The CBD and Brakenham had higher PM₁₀ values compared to the other stations. All measurements were within the stipulated NAAQS annual average limit of 50 µg/m3.
Most importantly, the annual NAAQS was not exceeded in any of the years where measurements were taken. Although considering the area average, the CBD, Brakenham and Esikhaleni were consistently above the average with data predominantly within the 90th percentile (Figure 3). Esikhaleni is a highly populated area with mostly low-income households and fewer industries compared to areas around the CBD. In this area PM₁₀was likely as a result of solid fuel burning St. Lucia and Mtunzini were the reference sites with PM₁₀ levels averaging at 20.8 µg/m3 and 22.3 µg/m3 respectively (Figure 3). This is probably a good indication of the background PM10 concentration of the whole study area as both sites are relatively unaffected by local sources of PM10. The background in both cases was above the WHO guideline indicating the potential contribution of other sources such as pollen and sea salts due to proximity to the sea (Renaut and Bamford, 2004).
An upward trend of PM₁₀ is observed at Mtunzini although not statistically significant. This could be attributed to PM transport due to wind from pollution sources but could also be because of sea salts, forest fires and vehicles emissions etc. PM₁₀ trends in these reference sites exceed the WHO guideline Figure 3.
Sulphur Dioxide (SO2)
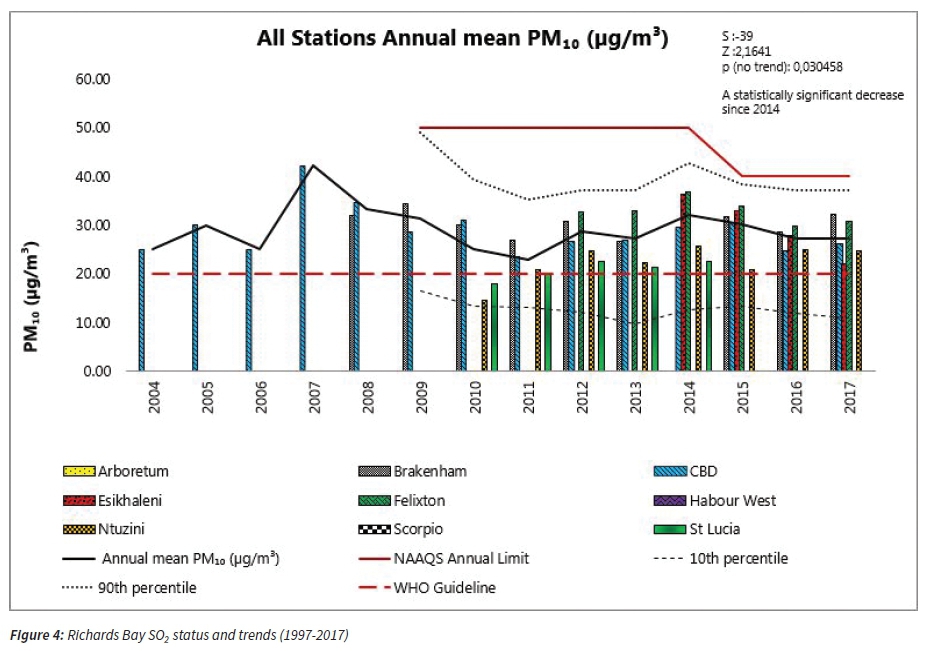
Like the PM₁₀ measurements, SO₂ concentrations in all seven stations where data was available were within the stipulated annual limit of 50 µg/m3 (Table 5). Statistically significant downward trends were observed in Arboretum, Brakenham, CBD and Felixton. Harbour west neither had neither an upward nor a downward trend. Esikhaleni showed an upward trend although with ambient concentrations well below the annual limit value. Scorpio had the least favourable SO₂ trends attributable to their close vicinity to industry while Arboretum, Brakenham, Esikhaleni and Felixton looked better in terms of the SO₂ profile (Table 5).
Data taken over the long term (1997 to 2017) for SO₂ indicate an upward trend although not statistically significant. From 2013 to 2017 however, a statistically significant downward trend is observed (Figure 4). The Scorpio and Harbour West Stations have consistently been above the 20-year average with annual average ambient concentration within then the 90th percentile. This can be attributed mostly to emissions from the surrounding industries. The CBD had SO₂ annual average ambient concentration just below the 20-year regional annual average. Measurement from residential areas such as Arboretum, Mtunzini and Esikhaleni showed low concentrations of SO₂. The annual NAAQS for SO₂ of 50 µg/m3 was not exceeded in all stations.
Practical managerial implications and recommendations
The results obtained indicate a generally downward trend of ambient PM₁₀ and SO₂ concentrations in Richards Bay over the last two decades and particularly in the recent 5 years. This trend could be a result of the introduction of NAAQS in 2009 as is seen with the step changes in trends when these standards were issued. It could also be a result of the implementation of minimum emissions standards for listed activities introduced in 2010 with achievement milestones stipulated for 2015 and 2020. The King Cetshwayo District Municipality Air Quality Management Unit and the local uMhlathuze Municipality have incorporated these standards into the Air Emission Licenses (AEL) and trade permits of industries. It can be argued that these regulatory changes have pushed emission sources particularly industry to invest more on abatement equipment.
Another possible factor contributing to the reduction in emission concentration could be the closure of some big industries particularly, Bayside Aluminium, Tata Steel and recently Lafarge that were near the Central Business District. It is worth noting that increase in SO2 and PM10 concentration levels around 2008, 2009 coincide with introduction of industries for example Tata Steel. Also, the Bayside Aluminium and Tata steel closures coincide with the sharp decrease in SO2 post 2014.
More so, an important contributor to the reducing trend could be pressure on industrial emission sources from NGOs such as the RBCAA that has handled numerous complaints from the public and tried to apportion emission to different sources through their stations and case studies. The RBCAA operates on a polluter pays principle with industry involvement who form part of the management committee (Okello and Allan, 2015). The RBCAA reviews Environmental Impact Assessments for new developments in the area that are likely to alter emission concentration in the air-shed and advises on potential mitigation options. In the words of Jim Phelps, formerly of the Zululand Environmental Alliance (ZEAL) "the RBCAA has done its best to work with polluting industries while raising serious concerns about air pollution in Richards Bay for the sake of the community and environmental health". Its role thus cannot be under estimated.
The downward trend in ambient concentrations is also mirrored in the number of air quality related complaints received through the RBCAA and the City of uMhlathuze's air quality unit which peaked in 2004 and have since showed a downward trend with 2017 having the least number of complaints (RBCAA, 2018).
Caution should be taken however, as Richards Bay is rapidly urbanising with new industrial development underway through the Richards Bay Industrial Development Zones (RBIDZ). The population is also rapidly increasing and with that, more vehicular and other activities that are likely to add to the PM₁₀ and SO₂ concentration in the ambient air. Monitoring efforts should thus be continued and implemented in a more collaborative and efficient manner to ensure that emission sources are reduced for the benefit of all living in the area.
Conclusion
Based on the results analysed, the ambient trends for PM₁₀ and SO₂ over the last two decades in Richards Bay and surrounding areas are generally decreasing. This is a positive aspect for the region and could be an indication that efforts to reduce emissions by imposing of the national minimum emission standards especially on surrounding industries is achieving the desired effect. However, the trends were not deemed statistically significant using the Mann-Kendall test. Although the overall decrease is not statistically significant, significant downward SO₂ trends were observed in Arboretum, Brakenham, and CBD. For PM₁₀, downward trends were observed in Brakenham, CBD and Felixton with Esikhaleni having the only statistically significant downward trend.
This paper thus concludes that efforts to reduce air emissions, particularly particulate matter in Richards Bay and surrounding areas are bearing fruit. Industrial abatement and collaborative work through involvement of different stakeholders in forums such as the RBCAA needs to continue. Government intervention through air emission licensing and trade permits and complaints handling is also critical to ensure that pollution reduction trends are sustained to a significant level.
It is worth noting that the measured background PM10 in the reference sites of St. Lucia and Mtunzini (20.8 µg/m3 and 22.3 µg/m3 respectively) are in the range of the WHO guideline. These sites are generally not affected by industrial sources and thus could be an indication of other pollution sources mainly sea salts and probably sugar cane burning.
Recommendation
It is recommended that the current monitoring of pollution concentrations continue to further improve the database of air quality in the area. Additionally, current efforts by the RBCAA to monitor Total Reduced Sulphur compounds (TRS) should be continued and supported. Measurements should also include other priority pollutants such as nitrogen dioxide, ozone, benzene, and carbon monoxide where necessary to ascertain baseline and need for continuous monitoring. These additional measurements would present a better picture of air quality pollution in the area. Incoming industries with these priority pollutants as emissions should be encouraged to be in involved in pollution monitoring. More so, recent government involvement in ambient air monitoring should be encouraged and perhaps even better consider synergy with existing monitoring networks such as the RBCAA to ensure better utilisation of resources and consistent monitoring.
Although the focus of this paper was on the trends of air quality pollutants, these results are important and could be applied in studying health impacts associated with long term air quality pollution and in interpreting health risk data. The results are also an important indicator of policy efficacy and a reminder that pollution reduction is possible if policy implantation is effective.
Acknowledgments
Acknowledgment is hereby given to the Richards Bay Clean Air Association, particularly Ms. Sandy Camminga for the tireless efforts on air quality monitoring in the Richards Bay and surrounding areas and particularly for providing data without which this study would not have been possible.
This study is part of a Doctor of Philosophy dissertation through the University of the Free State, acknowledgment is thus given to the staff particularly Dr. Tom Okello for his supervision and guidance in conjunction with Dr. Mark Zunckel of uMoya-NILU Consulting (Pty) Ltd.
References
Butt, E. W. et al. (2017) 'Global and regional trends in particulate air quality and attributable health burden over the past 50 years', Geophysical Research Abstracts, 19(104017), pp. 2017-3519. Available at: http://meetingorganizer.copernicus.org/EGU2017/EGU2017-3519.pdf. [ Links ]
Chiu, H.-F. (2013) 'Short-Term Effects of Fine Particulate Air Pollution on Ischemic Heart Disease Hospitalizations in Taipei: A Case-Crossover Study', Aerosol and Air Quality Research, 10, pp. 1563-1569. doi: 10.4209/aaqr.2013.01.0013. [ Links ]
Cogta (2017) 'KZN Administrative Boundaries'. Cooperative Governance and Traditional Affairs, p. 31. [ Links ]
Cohen, A. J. et al. (2004) 'Urban Air Pollution', Comparative Quantification of Health Risks, 77, pp. 1353-1434. doi: 10.1021/es304599g. [ Links ]
Colette, A. et al. (2011) 'Air quality trends in Europe over the past decade : a first multi-model assessment'. doi: 10.5194/acpd-11-19029-2011. [ Links ]
Craig, L. et al. (2007) Strategies for clean air and health, Journal of Toxicology and Environmental Health - Part A: Current Issues. doi: 10.1080/15287390600882994. [ Links ]
Craig, L. et al. (2008) 'Air Pollution and Public Health: A Guidance Document for Risk Managers', Journal of Toxicology and Environmental Health, Part A, 71(9-10), pp. 588-698. doi: 10.1080/15287390801997732. [ Links ]
CSIR (2015) 'Best Practices Guide. to consider Air-related Human Health in your Area'. Available at: http://www.saaqis.org.za/. [ Links ]
DEA (2010) National Environmental Management: Air Quality Act (Act No. 39 of 2004) List of activities which result in atmospheric emissions which have or may have significant detrimental effects on the environment, health, social and ecological conditions. South Africa. Available at: https://www.environment.gov.za/. [ Links ]
DEA (2011) 'Environmental: Air Quality', Environmental Outlook, pp. 182-207. Available at: http://www.epa.ie/air/quality/. [ Links ]
DEA (2012) 'List of activities which result in atmospheric emissions which have or may have a significant detrimental effect on the environment, including health, social conditions, economic conditions, ecological conditions or cultural heritage.', Government Gazette, GN37054(NN964), pp. 3-63. [ Links ]
DEA (2018) South African Air Quality Information Systems (SAAQIS): Air Quality Priority Areas. [ Links ]
Gilbert, R. O. (1987) Statistical methods for environmental pollution monitoring. New York: John Wiley and Sons. Available at: https://www.osti.gov/servlets/purl/7037501. [ Links ]
Guerreiro, C., Foltescu, V. and deLeeuw, F. (2014) 'Air quality status and trends in Europe', Atmospheric Environment. Elsevier Ltd, 98, pp. 376-384. doi: 10.1016/j.atmosenv.2014.09.017. [ Links ]
Gwaze, P. (Department of E. A. (2017) 'South Africa State of Air Report 2005 to 2016: Presentation', in. [ Links ]
Helsel, D. R. and Hirsch, R. M. (2002) 'Statistical Methods in Water Resources', Statistical methods in water resources techniques of water resources investigations, 36(3), p. 524. doi: 10.2307/1269385. [ Links ]
Jaggernath, J. (2013) 'A socio-economic and spatial investigation into the health implications of air pollution in Richards Bay, KwaZulu-Natal, South Africa', (March 2013). [ Links ]
Karmeshu, N. (University of P. (2015) 'Trend Detection in Annual Temperature & Precipitation using the Mann Kendall Test - A Case Study to Assess Climate Change on Select States in the Northeastern United States', Mausam, 66(1), pp. 1-6. Available at: http://repository.upenn.edu/mes_capstones/47. [ Links ]
Khumalo, T. N. (2016) '2016 State of the Air Report and National Air Quality Indicator', (October), p. 45. Available at: https://drive.google.com/drive/my-drive. [ Links ]
Koudahe, K. et al. (2017) 'Trend Analysis in Rainfall, Reference Evapotranspiration and Aridity Index in Southern Senegal: Adaptation to the Vulnerability of Rainfed Rice Cultivation to Climate Change', Atmospheric and Climate Sciences, 07(04), pp. 476-495. doi: 10.4236/acs.2017.74035. [ Links ]
Mohan, M. and Kandya, A. (2007) 'An analysis of the annual and seasonal trends of air quality index of Delhi', Environmental Monitoring and Assessment, 131(1-3), pp. 267-277. doi: 10.1007/s10661-006-9474-4. [ Links ]
Okello, N. and Allan, C. (2015) 'The Richards Bay Clean Air Association : A Case Study for Success in Participatory Air Quality Management', Clean Air Journal, 25(1), pp. 34-39. Available at: http://dx.doi.org/10.17159/2410-972X/2015/v25n1a2. [ Links ]
Pohlert, T. (2018) 'Non-Parametric Trend Tests and Change-Point Detection', R package, p. 26. doi: 10.13140/RG.2.1.2633.4243. [ Links ]
Rai, P. K. (2015) 'Multifaceted health impacts of Particulate Matter ( PM ) and its management : An overview', Environmental Skeptics and Critics, 4(1), pp. 1-26. [ Links ]
RBCAA (2018) 2017 Richards Bay Clean Air Association (RBCAA) Annual Air Quality Report. Richards Bay. [ Links ]
Renaut, R. and Bamford, M. (2004) 'Airspora of the Richards Bay Area 2001-2004', pp. 2001-2004. [ Links ]
Scorgie, Y. (2012) Urban Air Quality Management and Planning in South Africa. Doctoral thesis. Department of Geography, Environmental Management and Energy Studies, Faculty of Science, University of JohannesburgUniversity of Johannesburg. September 2012. [ Links ]
Shahid, S. (2011) 'Trends in extreme rainfall events of Bangladesh', Theoretical and Applied Climatology, 104(3-4), pp. 489-499. doi: 10.1007/s00704-010-0363-y. [ Links ]
Stats SA (2016a) Community survey 2016. doi: 10.1017/CBO9781107415324.004. [ Links ]
Stats SA (2016b) 'Mortality and causes of death in South Africa, 2015: Findings from death notification', Statistical release P0309.3, (November), pp. 1-127. doi: Statistical release P0309.3. [ Links ]
uMhlathuze Municipality (2016) 'uMhlathuze Municipality Annual Report 2015-2016'. Available at: http://www.umhlathuze.gov.za/docs-umhlathuze/annual-report/uMhlathuze-Annual-Report-Final.pdf. [ Links ]
WHO (2005) 'Air quality guidelines. Global update 2005. Particulate matter, ozone, nitrogen dioxide and sulfur dioxide', Environmental Science and Pollution Research, 3(91), pp. 23-23. doi: 10.1007/BF02986808. [ Links ]
WHO (2013) 'Review of Evidence on Health Aspects of Air Pollution-REVIHAAP Project; First Results', p. 29p. Available at: http://www.euro.who.int/__data/assets/pdf_file/0020/182432/e96762-final.pdf?ua=1%5Cnhttp://www.euro.who.int/en/health-topics/environment-and-health/air-quality/publications/2013/review-of-evidence-on-health-aspects-of-air-pollution-revihaapinterim-report. [ Links ]
WHO (2016a) Air pollution levels rising in many of the world's poorest cities. Available at: http://www.who.int/en/news-room/detail/12-05-2016-air-pollution-levels-rising-in-many-of-the-world-s-poorest-cities (Accessed: 27 June 2018). [ Links ]
WHO (2016b) Health risk assessment of air pollution: General principles. Available at: http://www.euro.who.int/en/health-topics/environment-and-health/air-quality/publications/2016/health-risk-assessment-of-air-pollution.-general-principles-2016. [ Links ]
WHO (2016c) 'WHO | Air pollution', World Health Organization. Available at: http://www.who.int/topics/air_pollution/en/. [ Links ]
World Health Organization (2016) 'Ambient Air Pollution: A global assessment of exposure and burden of disease', World Health Organization, pp. 1-131. doi: 9789241511353. [ Links ]
Received: 26 October 2018
Reviewed: 31 October 2018
Accepted: 11 November 2018

