


Servicios Personalizados
Articulo
 Inglés (pdf)
 Articulo en XML
 Referencias del artículo
Indicadores

Links relacionados
-
 Citado por Google
 -
 Similares en Google
Compartir

 Permalink
Clean Air Journal
versión On-line ISSN 2410-972X
versión impresa ISSN 1017-1703
Clean Air J. vol.28 no.2 Pretoria 2018
http://dx.doi.org/10.17159/2410-972x/2018/v28n2a17
RESEARCH ARTICLES
Assessment of heavy metals and radionuclides in dust fallout in the West Rand mining area of South Africa
Violet P. DuduI, III; Manny MathuthuI; Munyaradzi ManjoroII
INorth-West University, Centre for Applied Radiation, Science and Technology (CARST), P. Bag X2046, Mmabatho, 2735, South Africa, violet.dudu@yahoo.com
INorth-West University, Centre for Applied Radiation, Science and Technology (CARST), P. Bag X2046, Mmabatho, 2735, South Africa, Manny.Mathuthu@nwu.ac.za
IINorth-West University, Department of Geography and Environmental Science, P. Bag X2046, Mmabatho, 2735, South Africa, Munyaradzi.Manjoro@nwu.ac.za
IIIBindura University of Science Education, Department of Environmental Science, P. Bag 1020, Bindura, Zimbabwe
ABSTRACT
Windblown dust can contain radioactive materials from mining. These radionuclides when inhaled in dust produce ionizing radiation which damages the cells and tissues in the body. The aim of this study was to assess dust fallout radionuclides in the West Rand mining area of South Africa. Dust fallout monitoring was done using the method (ASTM) D-1739 of 1998 employing multi-directional buckets. Results show that all 9 locations investigated in the different seasons recorded dust fallout rates within stipulated residential limit according to the National Dust Control Regulations (NDCR) (Government Gazette 36974, 1 Nov 2013). Locations 3 in spring (301.93 mg/m2/day) and 6 in winter (589.8 mg/m2/day) recorded dust fallout rates with values above the target value of 300 mg/m2/day according to guidelines by South African Standards (SANS 1929:2011). The ANOVA tests (p-value < 0.05) indicate that the mean dust fallout rate is significantly different across the seasons, mean dust fallout rate in summer is significantly (p-value < 0.05) more than the autumn by 103.15 mg/m2/day. Moderate, positive correlations (0.4 ≤ r < 0.7) exist between average dust fallout rate and wind speed. A weak, negative correlation exist between average dust fallout rate and rainfall with a value of -0.393. All the investigated elements had Enrichment Factor (EF) greater than 1. Cadmium (Cd) and lead (Pb) were extremely enriched (68.36 and 43.48, respectively), whereas Thorium (Th) (7.26) and Chromium (Cr) (9.79) had significant enrichment. Activity concentrations obtained for 226Ra, 238U, 232Th and 40K were 53.59 ± 20.45 Bq/kg, 15.20 ± 6.74 Bq/kg, 6.62 ± 2.76 Bq/kg and 278.51 ± 84.39 Bq/kg, respectively. Activity concentrations were within world averages except 226Ra which exceeded the 32 Bq/kg world average. Statistically significant (p-value < 0.05), strong (0.7 < r < 0.9) and positive correlation exists between 226Ra and 40K. A moderate, positive correlation (0.4 ≤ r < 0.7) exist between 238U and 232Th. Since EF values showed that the elements in the dust had anthropogenic influence, further studies should look at contributions of different sources to the elements found in dust.
Keywords: Dust, radionuclides, enrichment factor, correlation coefficient, activity concentrations.
Introduction
Mining activities pose a great threat to the environment including contamination of the environment. Some contaminants produced from mining contain toxic substances for example radioactive elements which can be trapped in dust particles (Csavina et al. 2012). These radionuclides may be carcinogenic although it is considered that there is no threshold below which adverse effects occur (Cothern 1990, Fadol et al. 2015, Taskin et al. 2009). Naturally Occurring Radioactive Materials (NORMs) are present in soils, water, rocks, food and humans are exposed to normal background levels of these NORMs which do not vary remarkably from place to place (Odumo et al. 2011, Sýkora et al. 2017). Technologically Enhanced Naturally Occurring Radioactive Materials (TENORMs) are a result of human activities (such as mining, burning of coal among others) which have increased the relative concentration of the radionuclides (Odumo et al. 2011). While radionuclides occur naturally in soils and rocks as a result of radioactive decay, most environmental releases are due to industrial processes such as mining and processes. Examples of these radionuclides include uranium (U), potassium (K), thorium (Th) and radium (Ra). Radioactive environmental contamination related to mining is one of global concerns (Černe et al. 2011). The most affected areas will be those in close proximity to the mine tailings due to large concentrations of radioactive material in dust. Research in South Africa has shown that many residential areas near mining areas are at high risk of radioactivity contamination (Makgae 2011, Maseki 2013). Major pathways of exposure to radiation include inhalation, food contamination and occupational exposure (Mahur et al. 2008, McCartor and Becker 2013, Miah et al. 2012). For inhalation the major risks are airborne radon and windblown dust (Giannadaki et al. 2014, Makgae 2011).
Dust is composed of small, dry and solid particles released into the atmosphere by natural or anthropogenic activities and it settles slowly from the atmosphere. Anthropogenic dust is the major contributor of the total dust in the atmosphere (up to 50%) (Csavina et al. 2012, Peng et al. 2016). As observed by Langmann (2013) and Papagiannis et al. (2014) dust emissions are complex and are dependent on meteorological conditions (wind friction velocity and precipitation) and properties (particle size distribution of surface soils, surface roughness length, and soil moisture content).
To understand the potential hazardous content in ambient dust and dust fallout, these need to be monitored.
Dust fallout monitoring includes measurement of dust deposition in ambient air as part of air quality monitoring. Dust deposition data in an area shows monthly, seasonal and inter-annual variability and this can explain the pre- or operational phase of an activity (Maseki 2013, Wright et al. 2014).
Dust from mines can be blown into the communities affecting their health and this can have serious long term consequences (Abdul-Wahab and Marikar 2012, Castillo et al. 2013). Contaminants such as radionuclides from mining operations are usually associated with the finer particles (< 2µm in diameter). These particles can travel long distances and cause health problems to humans as they penetrate through the respiratory system (Csavina et al. 2012). Airborne radiometric mapping surveys over mining areas (e.g. Coetzee 1995, Sutton and Weiersbye 2008, Tutu et al. 2003) have revealed that high gamma activities from immobile daughters of the Uranium decay series such as 226Ra in tailings dams can pose serious threat to the environment due to dust dispersion. There is need to monitor and quantify anthropogenic pollution resulting from dust fallout.
The enrichment factor (EF) method is one of the ways in which anthropogenic pollution on a given site is quantified. According to Chen et al. (2007), the EF is a good tool which can be used to distinguish between naturally occurring and anthropogenic sources of dust pollution. According to Papadopoulos et al. (2014), assessment of gamma radiation dose from natural sources is important since natural radiation is the largest contributor to external dose of the world population. Assessment of radiation dose from natural radiation is very important as it can help in assessing the health effects emanating from exposure to ionizing radiation.
Direct determination of 238U using gamma spectrometer is very difficult since 238U does not have intensive gamma lines of its own (Mehra and Singh 2011). Hence daughter products with more intensive lines when in secular equilibrium with their parents were used specifically: 214Bi and 214Pb.
The EF is widely used to determine the origin of pollutants in air, dust, precipitation and other environmental samples (Reimann and Caritat 2000, Sucharovà et al. 2012). The basic assumption behind the use of EF is that the ratio is approximately 1. So any change in the ratio requires an external source which is human input (Chen et al. 2007). The equation for calculating the EF is as follows:
where X/Al is the ratio of the element of interest (X) to aluminium (Al) (used as the reference material in this study) (Bourennane et al. 2010, Chen et al. 2007, Reimann and de Caritat 2005). The choice of aluminium is because it is not related to other metals. Usually Al has relatively high natural concentrations and hence is not expected to be substantially enriched from anthropogenic sources (Abrahim and Parker 2008). The categories for EF values are described as follows according to (Latif et al. 2015, Tholkappian et al. 2017):
EF < no enrichment
EF = 1-2 low enrichment
EF = 2-5 moderate enrichment
EF = 5-20 significant enrichment
EF = 20-40 very high enrichment
EF > 40 extremely high enrichment
Although there have been various studies on dust fall out in mining areas of South Africa (e.g. Oguntoke et al. 2013), very few studies have focussed on radionuclides in the dust from soil and mine tailings in the West Rand mining area (e.g. Maseki 2013). Hence the objectives of the study were to:
-
measure dust fallout rate at various locations in the study area
-
determine the long lived radionuclides (238U, 226Ra, 232Th and 40K) present in the dust and their source using enrichment factors
-
assess the level of compliance to regulatory limits using National Dust Control Regulations (NDCR) of 2013.
The importance of monitoring dust fallout in an area is to check whether legislative requirements are met and to generate or maintain awareness of the dust generating activities on site. The results can be used in health risk assessments for example to evaluate population exposures. The research can provide complementary data which can be used in improving air quality management of the area.
Methodology
Description of the study area
The West Rand mining area consist of sedimentary rocks with the gold bearing conglomerates composed of 70-90% quartz (SiO2) and 10-30% phyllosilicates. The phyllosilicates are mainly made up of sericite, KAl2(AlSi3O10)(OH)2 and minor minerals such as uranite (UO2), chromite (FeCr2O4), pyrite (FeS2) and rutile (TiO2) (Robb and Meyer 1995, Tutu et al. 2003).
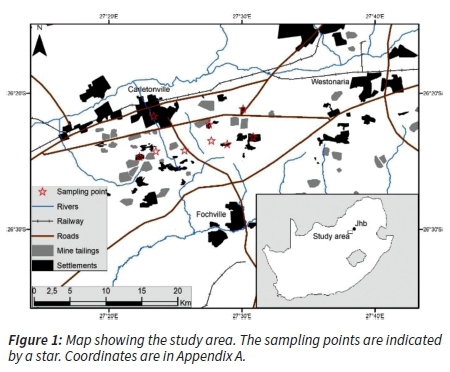
The climate in the highveld consists of short cold winters from June to August and long hot summers usually from October to March. The rainfall occurs mostly in summer ranging from 600 - 732 mm per annum. The period October-March is often characterised by heavy storms and the average annual temperature is 16 oC (Tutu et al. 2003). The sampling locations are shown in Figure 1. The coordinates of the sampling locations shown in Appendix A were recorded with a Global Positioning System (GPS) receiver. Ethical clearance was granted by the North-West University. Permission to access the mining area and communities was sought from the mine and granted.
Method of data collection
Dust collection was done using multidirectional dust fall buckets with wind shield, following the American Standard Test Method (ASTM) D-1739 of 1998 (2004). Four buckets were deployed to collect dust from different directions (north, south, west and east) depending on the wind direction. Samples were collected throughout the year to cater for seasonal variations from January 2016 to December 2016. The exposure time during the monitoring period complied with the standard operating procedure of 30 ± 2 days of the (NDCR) of 2013 (NEMA: AQA 2013). The calculation of the dust deposition rate was then given by the equation as cited by (Kornelius and Kwata 2014):

where W = collected mass (mg); A = cross sectional area over which fall out collection has been made and has standard constant value of 0.02545 m2.
An electronic mass balance RADWAG Model PS750/C/2 with precision 0.0001 g from LASEC South Africa was used for weighing the samples. For gamma spectroscopy the dust samples were left sealed for four weeks in labelled airtight vials to prevent the escape of radiogenic gases such as radon (222Rn) and thoron (220Rn), and to achieve secular equilibrium of the 238U and 232Th and their respective progenies (Frostick et al. 2011, Mahur et al. 2008). Measurements were done at the Centre for Applied Radiation, Science and Technology (CARST) at the North-West University using an HPGe well detector. The radionuclides of interest were identified at the following energies: 238U (186 KeV for 226Ra, 351.9 KeV for 214Pb, 609.2 KeV 214Bi), 232Th (238.6 KeV for 212Pb, 583.1 KeV for 208Tl, 911 KeV for 228Ac) and 1460 KeV for 40K. For quality assurance, standard procedures for energy and efficiency calibration were done using LabSOCS software. GENIE 2000, Gamma Acquisition V.3.2.1 and Gamma Analysis Software V.3.2.3 were used for data acquisition and analysis.
Since gamma spectroscopy is a non-destructive technique, the samples from gamma spectroscopy were then sent for Inductively Coupled Plasma Mass Spectroscopy (ICP-MS) for elemental analysis. Microwave assisted digestion using EPA method 3052 on Anton Paar Multiwave 3000 was used in preparing the samples for ICP-MS analysis. The dust was weighed and mixed with 3 ml of 65% concentrated nitric acid (HNO3), and 9 ml of 32% concentrated hydrochloric acid (HCl) in a reaction vessel. 2 ml of hydrogen peroxide (H2O2) was added slowly to the mixture. The acid volumes were measured using a graduated measuring cylinder. The Hydrochloric acid was used as a complexation reagent because of the presence of silicates and precious metals. Hydrogen peroxide was used to enhance the oxidation of nitric acid in the digestion of organics. The mixture was allowed to react for one minute prior to sealing the vessels. The vessels were placed in the rotor and then placed in the microwave. The mixture was then digested at a temperature of 120 0C for one hour and then allowed to cool down for 15 minutes. After that the digested samples were transferred to 100 ml volumetric flasks with 2% HNO3.Deionised water was used to top up to the 100 ml mark (Nogueirol et al. 2013). The extracts were then allowed to sediment overnight and then filtered with Whatman filter paper 110 mm in diameter in readiness for ICP-MS using Total Quant method. A blank digest was prepared in the same way as the samples. Standard and blank solutions were used to correct for the analytical and instrumental drifts. The calibration was achieved using Multi-Element Internal Standard (Perkin Elmer Pure Plus) with a concentration of 10 µg/ml and the elements present were Bi, Ho, In, Li6, Sc, Tb and Y. All chemicals and reagents used were of certified analytical grade and procured from Merck (South Africa).
Statistical analysis
SPSS Version 23 was employed for statistical analysis of the data. Two-way ANOVA was used to test for significant differences between variables since there are two treatments (location and season) and one dependent variable (dust fallout rate) (Ireland 2010). Pearson correlation coefficient tests were used to test the relationship between average dust fallout rate and meteorological parameters. To determine the correlation between activity concentrations of the different radionuclides, the Pearson correlation coefficient test was also employed.
Results
Variation in dust fallout rates across locations and seasons
Figure 2 shows that all locations (except for location 3 in spring (301.93 mg/m2/day) and location 6 in winter (589.8 mg/m2/day) were within the target of 300 mg/m2/day according to National Dust Control Regulations (NEMA: AQA 2013). Location 6 had the highest recorded value in winter of 589.75 mg/m2/day and this is the only location which had a value close to the National Dust Control Regulations of below 600 mg/m2/day for residential areas (NEMA: AQA 2013). Locations 6, 4 and 3 in winter had the highest dust fall rates compared to all other sites. However, the autumn season had the lowest dust fallout rates in all locations. Concentrations of dust at all sites per season decreased in the following order: spring > summer > winter > autumn. Spring is characterised by strong winds, whereas in autumn the wind speeds are low. The wind speeds during this period were recorded and the range was 2.9 m/s - 3.7 m/s.
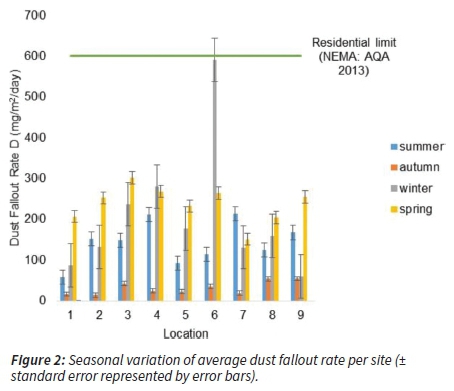
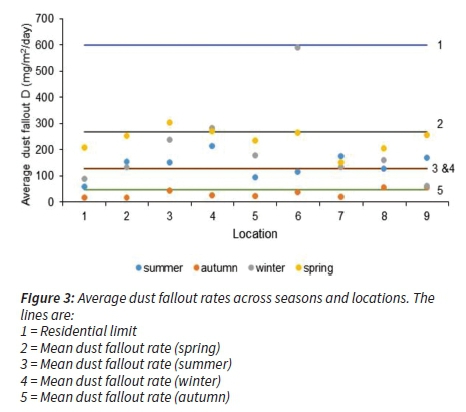
Figure 3 shows the following locations: 1, 5, 6 and 8 have the average dust fallout rate below that for summer season with an average of 128.05 mg/m2/day. The average dust fallout rate for all other locations 2, 3, 4, 7 and 9 is above the average dust fallout rate for summer. In winter the average dust fall out rate was 125.86 mg/m2/day. Only locations 1 and 9 were below the average for the winter season. All other locations (2, 3, 4, 5, 6, 7 and 8) surpassed the average dust fall out rate of 125.86 mg/m2/day. The average dust fallout in autumn for locations 1, 2, 3, 4, 5, 6 and 7 is below the average dust fallout rate of 44.91 mg/m2/day for the season autumn. The average dust fallout rate for other locations 8 (53.70 mg/m2/day) and 9 (54.30 mg/m2/day) is above the average for the corresponding season (autumn) with 44.91 mg/m2/day. Only the average dust fallout for location 3 (309.10 mg/m2/day) is above the average dust fallout rate for the corresponding season (spring) (268.13 mg/m2/day).
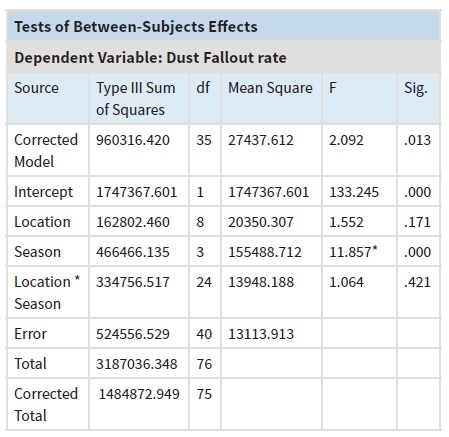
Results for the ANOVA test (Appendix B) for significant difference across locations and seasons indicate that the mean dust fallout rate is significantly different across the seasons (p-value < 0.05). Dust fallout rate does not differ significantly across the locations. The mean dust fallout rate differs significantly in summer and autumn (p-values <0.05) as shown in Table 1.

The significance and magnitude of the difference in the mean dust fallout rate between summer and autumn shows that the mean dust fallout rate in summer is significantly different to that of autumn (p-value < 0.05) and has a magnitude of 103.15 mg/m2/day.
Dust fallout rates variation with meteorological parameters
Dust fallout rate in different months of the year were plotted against meteorological parameters to show the trends exhibited as shown in Figure 4. The effect of temperature on dust fallout rate was not apparent when judging by looking at the graph. Hence, it was necessary to carry out a statistical test to determine whether there was any association and the strength of the association between dust fallout rate and the variables.
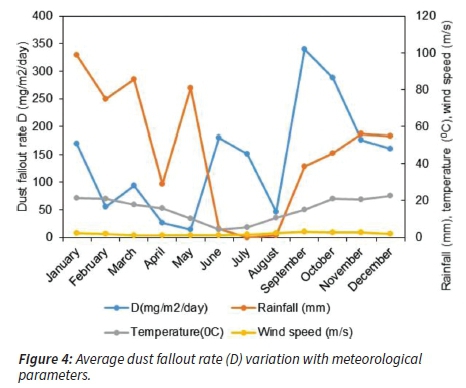
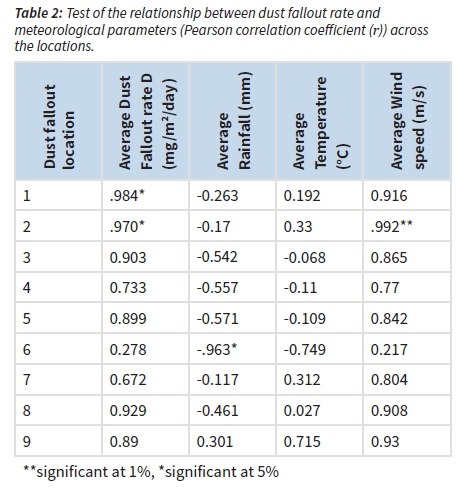
The Pearson's correlation coefficient test was done to test the relationship between dust fallout rate and meteorological parameters as well as across locations. Moderate, positive correlation with a value of 0.588 exist between average dust fallout rate and wind speed. During different seasons, the predominant winds come from different wind regimes. However, the dominant winds in the area come from the north and northwest directions as shown on the wind rose in Appendix C (two years average for 2014 - 2015) with wind speeds of 1.5 - 3.0 m/s. According to the weather data from South African Weather Service higher wind speed in the areas seldom reach > 8.0 m/s but the range 5.0 - 8.0 m/s are sometimes recorded.
There is a weak, negative correlation between average dust fallout rate and rainfall with a value of -0.393.
Table 2 shows statistically significant (p-values < 0.05) and very strong (0.9 < r < 1) (Soh 2016) positive correlation between the dust fallout rate of location 2 and average wind speed. In addition, a statistically significant (p-values < 0.05), very strong negative correlation was observed between the dust fallout rate of location 6 and average rainfall.
Concentration and Enrichment Factors (EF) of metals and radionuclides
Table 3 provides results of elemental analysis done using ICP-MS and calculated enrichment factors for selected elements. Elements associated with anthropogenic emissions include Hg, Cr, Cd and Pb. As seen in Table 3 from the heavy metals investigated Hg has the lowest concentration (0.16 ± 0.066) mg/kg followed by Cd (0.94 ± 0.38) mg/kg and Cr has the highest concentration with a mean value of 125.61 ± 7.92 mg/kg. When considering the radionuclides, Pb has the highest concentration with a mean value of 39.84 ± 3.36 mg/kg followed by Th (3.99 ± 0.75) mg/kg and U (2.94 ± 0.68) mg/kg. The world average values for U and Th in soils are 2.64 mg/kg and 11.1 mg/kg respectively (Dragović et al. 2006). World average refers to mean values obtained from other locations in different countries in the world. In this study the Th concentration was below the world average whereas the U concentration was in line with the world average. According to (Papadopoulos et al. 2014), the geochemical behaviour of the Th and U radionuclides is expected to be the same as they have similar distribution within the soils.

There were no elements with mean EF values less than 1. Th and Cr had the least values of EF with 7.26 and 9.79 respectively and had significant enrichment according to the classification of categories (Latif et al. 2015, Tholkappian et al. 2017). Uranium also had significant enrichment as the EF value was in the range 5-20 according to the classification. Mercury (Hg) with mean EF value of 29.22 had very high enrichment according to the classification of the categories (Latif et al. 2015, Tholkappian et al. 2017). Cd and Pb have extremely high enrichment as the EF value is greater than 40.
Activity concentrations of radionuclides
Table 4 shows the measured mean activity concentrations of the radionuclides in the dust samples.
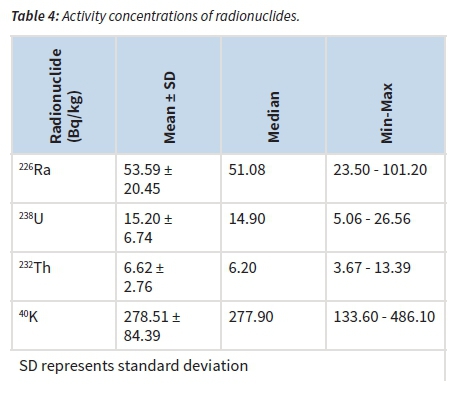
232Th had the least activity concentration and the maximum observed was for 40K. The order of the activity concentration from the least to the highest was 232Th < 238U< 226Ra < 40K.
Pearson's correlation coefficient test was used to assess the relationships of the activity concentrations of the radionuclides. Table 5 shows the results obtained.
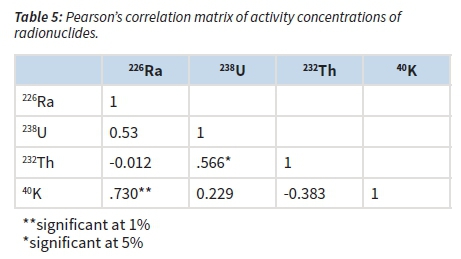
There is statistically significant (p-value < 0.05) and strong (0.7 < r < 0.9) (Soh and Soh 2016) positive correlation between Ra-226 and K-40. A moderate, positive correlation (0.4 ≤ r < 0.7) (Soh and Soh 2016) exist between U-238 and Th-232 due to similar distribution of Th and U within the soils and this could be attributed to their similar geochemical characteristics. According to (Papadopoulos et al. 2014), U and Th are primarily associated with heavy minerals such as the monazite, zircon and allanite and secondarily associated with epidote, titanite and apatite. On the other hand K-40 is negatively correlated with Th-232 showing that different mechanisms control the K-40 and Th-232 concentrations in soil (Papadopoulos et al. 2014).
Discussion
Seasonal variation of dust fallout rates and relationship with meteorological parameters
All 9 locations in summer, autumn, winter and spring did not exceed the permissible residential limit of 600 mg/m2/day according to National Dust Control Regulations (Figure 2). This is a good trend considering that there are residential areas near the sampling locations where the dust was collected. Hence the nuisance impact significance is low. It is also important to note that the study area is situated in an area which is just a few hundred metres away from where mining is the major activity. Mining releases dust to the surrounding environment and if no proper control methods are in place, the dust can exceed limits as per National Dust Control Regulations. In all locations as depicted on Figure 3, dust deposition rates were below 600 mg/m2/day which is the National Dust Control Regulations limit for the 30 day dust fallout. Compared to other countries a research conducted in Jamaica and Namibia (Kgabi et al. 2015) showed that both the residential and non-residential limits of dust rates of 1200 mg/m2/day set by National Dust Control Regulations were exceeded by Kingston site in Jamaica (1557 mg/m2/day). Whereas the Windhoek site in Namibia exceeded the residential limit only with an average of 1034 mg/m2/day.
During spring in 2016 there were high amounts of dust. High dust fall out rates in spring was due to lack of precipitation during this period and possibly higher wind speeds. According to Van Zyl et al (2014), lower wind speeds are in the months of May to August (winter) whereas in summer more unstable tropospheric conditions occur (Van Zyl et al. 2014). The month of August has strong prevailing winds in the north-westerly direction and this could have contributed to the high dust fall out rates during winter in the study area. Dominant winds were from the north and northwest directions in the study area though during the different seasons the predominant winds were coming from different wind directions.
Wind speed is an important factor as it influences the dispersion of pollution from a source. Precipitation reduces wind erosion by increasing moisture content of materials. This is an important factor for removal of pollutants and is regarded as very important in air pollution studies. The observed trends of lower dust fallout rates during autumn can be related to above average precipitation which was received in the area.
Ambient air quality is influenced by regional atmospheric movements, local climatic and meteorological conditions. The descriptive statistics show that there is some variation in the dust fallout rates across the locations in the study area and the seasons. The results presented in this study show that dust deposition rates vary with seasonal fluctuations in wind speed patterns (Appendix D).
According to Wright et al. (2014) in summer dust is less due to rain and in winter it is more because of the wind and dry conditions. Favourable conditions such as high wind speed and lower humidity are conducive to the spread of pollutants.
Concentration and Enrichment Factors (EF) of metals and radionuclides
Results from ICP-MS analysis showed that the uranium concentration in this study (2.94±0.68 mg/kg) was similar to the values obtained in Serbia Montenegro (mean 2.76 mg/kg) and world average of 2.64 mg/kg. However, the mean Th concentration in this study was approximately 2.7 times less than the world average of 11.1 mg/kg. In Serbia Montenegro the highest concentrations of U, Th and K were found in soil samples that originated from sedimentary rocks and magmatic rocks with silica oversaturation (Dragović et al. 2006). Hence the differences observed in this study to those in other areas may be probably due to differences in geological origin. Also, in our study, this might be an indication that Th is not easily transported via dust.
According to Pekey (2006) As, Cr, Cu, Mn, Ni and Fe are used to show existence of metal industries whereas Cd and Pb are markers of the paint industry. In Table 3 the Cd concentrations are low 0.94 ± 0.38 mg/kg compared to Cr (125.61 ± 7.92) mg/kg. It is possible that these metals could be coming from industries nearby as shown on the map. For Cd, sources can be both natural and anthropogenic hence it was necessary to go further with the study to determine sources of the elements as either being natural or anthropogenic. That is the reason for using EF values in this study.
The trend of radionuclides in decreasing order of concentrations is Pb > Th > U (Table 3). This could be explained in several ways. The Pb in dust could be coming from a mixture of natural and anthropogenic sources. Secondly, Pb can also come from sintering of ore containing 238U and the burning of coal (Bollhöfer et al. 2006). Considering that the dust samples were collected in a geographical area where mining is dominant, it is probable that some source of the Pb is coming from the industrial activities (mining and coal burning) although we lack precise information on the exact percentage of the contribution from the different sources. Pb pollution from mining activities is a relatively localized problem (Naja and Volesky 2009) hence in this case our assumption that Pb is from mining can be true. A certain contribution of Pb can also be coming from vehicular emissions. According to Wuana and Okieimen (2011), the most hazardous source of exposure to soil Pb is through ingestion of contaminated soil or dust. However very few plants if any can absorb or accumulate lead (Pb) thus leaving exposure through dust inhalation as the most serious exposure route (Wuana and Okieimen 2011).
The trend shown in Table 3 shows that of all the six elements investigated there is none with EF value less than 1. Accordingly, all the elements presented in Table 3 have EF greater than 1 and are influenced by anthropogenic emissions (Latif et al. 2015, Tholkappian et al. 2017) though the degree of contributions to the different metals differ. The order of the mean EF values of the elements in the study area from the highest to lowest is Cd > Pb > Hg > U > Cr > Th. According to Reimann and Caritat (2000), elements such as Hg and Pb always give high enrichment values for example from 100-1000 regardless of where the samples have been collected in the world. This is explained by a large and chemically similar anthropogenic contamination of the atmosphere by the highly volatile elements which top the EFs values on a worldwide scale. A certain contribution of Pb can also be coming from vehicular emissions, yet lead (Pb) in petrol was phased out in South Africa in January 2006. Thus, sources of Pb can be multiple in anthropogenic nature apart from the natural source thus confirming the high EF values. Another process besides pollution must also be responsible for the extremely high EFs for Cd and Pb. According to Reimann and de Caritat (2005) the elements easily form organo-metallic compounds thus formation of methyl metals might be the process enriching these elements. However, some authors have argued that the EFs can exaggerate some results (Reimann and Caritat 2000). The reason being that crustal values are based on total element concentrations determined by x-ray fluorescence, neutron activation analysis, multi-acid dissolution and many other methods but results presented in environmental researches are obtained by weaker extractions methods. These include aqua regia method whereby element extraction differs from element to element because different elements bind differently to the mineral component (Reimann and Caritat 2000). Historically Pb was used as an additive to gasoline therefore released in huge quantities over large areas by vehicles.
Radionuclide activity concentrations and correlation coefficients
The order of the activity concentration from the least to the highest was 232Th < 238U< 226Ra < 40K. In literature granite rocks are known to display high levels of total potassium (Júnior et al. 2010). The parent rock has some granite characteristics thus the corresponding increase in 40K concentrations.
As reported by UNSCEAR Radiation (2000), 238U, 232Th and 40K are within the world averages of 35, 45 and 420 Bq/kg for soil respectively whereas 226Ra exceeds the 32 Bq/kg world average by approximately 1.67 times orders of magnitude. The activity concentration of 238U is within the range of values obtained from other studies carried out previously (Radiation 2000, Taskin et al. 2009) and is about 2.3 times orders of magnitude below the world averages. The activity concentrations for radionuclides obtained in this study are much lower than activities obtained from other countries such as India and Greece (Chakrabarty et al. 2009, Papadopoulos et al. 2014). In the study area in Table 5, 238U with 232Th and 226Ra with 40K are positively correlated indicating the radionuclides may have originated from the same source and their concentrations are affected by the same geological processes (Arafat et al. 2017). However, the radionuclides 238U with 226Ra show no significant correlation. This is contradictory to what is expected because 226Ra and 238U belong to the same decay chain. According to Navas et al. (2002) low correlations between members in the uranium decay series can be due to differences in mobility and transfer of the radionuclides.
Conclusion and Recommendations
Concentrations of dust at all sites per season decreased in the following order: spring > summer > winter > autumn. Highest dust fallout rate was recorded in location 6 during winter season whereas the lowest dust flux was in autumn in location 2. Winter should have lower deposition rates because lowest wind speeds are between May and end of August, this is when more stable tropospheric conditions occur (caused by a persistent high pressure system over South Africa). On the other hand, the month of August has strong prevailing winds in the north-westerly direction and possibly this could have contributed to the high dust fallout rates during winter in the study area.
The fallout rate for all the locations throughout all seasons were below National Dust Control Regulations for residential and light commercial areas (NEMA: AQA 2013). All locations except for location 3 in spring and location 6 in winter were within the target of 300 mg/m2/day as specified by the South African guidelines (SANS 1929:2011).
The mean dust fallout rate is significantly different across the seasons. Lower dust loadings were observed in the rainy season and during autumn and this was in agreement with similar studies in literature. The higher dust fallout rates in winter and spring can be attributed to higher wind speeds.
The activity concentrations of 226Ra, 238U, 232Th and 40K were similar to those obtained in various studies in the world. However, the 226Ra activity concentration exceeded the world average value hence caution needs to be taken as long term exposure to the dust containing the radionuclides may pose a health risk due to ionizing radiation. In our study we can conclude that all the elements investigated were influenced by anthropogenic sources. However, further study should look at contributions of different sources to the elements found in dust in the study area.
Acknowledgements
We acknowledge the Organization for Women in Science for the Developing World (OWSD) and Swedish International Development Cooperation Agency (SIDA) for providing financial support to the PhD student during her Studies. Many thanks to the South African Weather Service (SAWS) for providing the researchers with meteorological data used during the study. We also thank the North-West University Eco Analytica Laboratory staff for assistance with ICP-MS analysis. We appreciate colleagues and communities for the support given during data collection and writing of the manuscript.
References
Abdul-Wahab, S. & Marikar, F. 2012. The environmental impact of gold mines: pollution by heavy metals. Open Engineering, 2, 304-313. [ Links ]
Abrahim, G. & Parker, R. 2008. Assessment of heavy metal enrichment factors and the degree of contamination in marine sediments from Tamaki Estuary, Auckland, New Zealand. Environmental monitoring and assessment, 136, 227-238. [ Links ]
Arafat, A., Salama, M., El-Sayed, S. & Elfeel, A. 2017. Distribution of natural radionuclides and assessment of the associated hazards in the environment of Marsa Alam-Shalateen area, Red Sea coast, Egypt. Journal of Radiation Research and Applied Sciences, 10, 219-232. [ Links ]
ASTM D1739-98(2004) Available at: https://www.astm.org/DATABASE.CART/HISTORICAL/D1739-98R04.htm [ Links ]
Bollhöfer, A., Honeybun, R., Rosman, K. & Martin, P. 2006. The lead isotopic composition of dust in the vicinity of a uranium mine in northern Australia and its use for radiation dose assessment. Science of the Total Environment, 366, 579-589. [ Links ]
Bourennane, H., Douay, F., Sterckeman, T., Villanneau, E., Ciesielski, H., King, D. & Baize, D. 2010. Mapping of anthropogenic trace elements inputs in agricultural topsoil from Northern France using enrichment factors. Geoderma, 157, 165-174. [ Links ]
Castillo, S., Jesús, D., De La Campa, A. M. S., González-Castanedo, Y., Fernández-Caliani, J. C., Gonzalez, I. & Romero, A. 2013. Contribution of mine wastes to atmospheric metal deposition in the surrounding area of an abandoned heavily polluted mining district (Rio Tinto mines, Spain). Science of the Total Environment, 449, 363-372. [ Links ]
Černe, M., Smodiš, B. & Štrok, M. 2011. Uptake of radionuclides by a common reed (Phragmites australis (Cav.) Trin. ex Steud.) grown in the vicinity of the former uranium mine at Žirovski vrh. Nuclear Engineering and Design, 241, 1282-1286. [ Links ]
Chakrabarty, A., Tripathi, R. & Puranik, V. 2009. Occurrences of NORMS and 137 Cs in soils of the Singhbhum region of Eastern India and associated Radiation Hazard. Radioprotection, 44, 55-68. [ Links ]
Chen, C.-W., Kao, C.-M., Chen, C.-F. & Dong, C.-D. 2007. Distribution and accumulation of heavy metals in the sediments of Kaohsiung Harbor, Taiwan. Chemosphere, 66, 1431-1440. [ Links ]
Coetzee, H. Airborne radiometric mapping of the environmental impact of gold and uranium mining in the Gauteng Province, South Africa. Symposium on the application of geophysics to environmental and engineering problems, 1995. [ Links ]
Cothern, C. R. 1990. Radon, radium, and uranium in drinking water, CRC Press. [ Links ]
Csavina, J., Field, J., Taylor, M. P., Gao, S., Landázuri, A., Betterton, E. A. & Sáez, A. E. 2012. A review on the importance of metals and metalloids in atmospheric dust and aerosol from mining operations. Science of the Total Environment, 433, 58-73. [ Links ]
Dragović, S., Janković, L., Onjia, A. & Bačić, G. 2006. Distribution of primordial radionuclides in surface soils from Serbia and Montenegro. Radiation measurements, 41, 611-616. [ Links ]
Fadol, N., Salih, I., Idriss, H., Elfaki, A. & Sam, A. 2015. Investigation of Natural Radioactivity levels in Soil Samples from North Kordofan State, Sudan. Research Journal of Physical Sciences ISSN, 2320, 4796. [ Links ]
Frostick, A., Bollhöfer, A. & Parry, D. 2011. A study of radionuclides, metals and stable lead isotope ratios in sediments and soils in the vicinity of natural U-mineralisation areas in the Northern Territory. Journal of environmental radioactivity, 102, 911-918. [ Links ]
Giannadaki, D., Pozzer, A. & Lelieveld, J. 2014. Modeled global effects of airborne desert dust on air quality and premature mortality. Atmospheric Chemistry and Physics, 14, 957-968. [ Links ]
Ireland, C. R. 2010. Experimental Statistics for Agriculture and Horticulture, CABI. [ Links ]
Júnior, J. S., Amaral, R., Silva, C. & Menezes, R. 2010. Radium equivalent and annual effective dose from geological samples from Pedra-Pernambuco-Brazil. Radiation Measurements, 45, 861-864. [ Links ]
Kgabi, N., Nampadhi, L., Williams, J., Hamilton, O., Antoine, J., Preston, J. & Grant, C. 2015. Air quality and climate change in small states of the Commonwealth: Jamaica and Namibia. WIT Transactions on Ecology and the Environment, 199, 97-108. [ Links ]
Kornelius, G. & Kwata, M. 2014. Comparison of different versions of ASTM 1739 for the measurement of dust deposition in the South African mining sectors. Available at: http://www.airshed.co.za/Downloads/Publications/14%20NACA_2010%20Deposition_Kwatha_Kornelius.pdf [ Links ]
Langmann, B. 2013. Volcanic ash versus mineral dust: atmospheric processing and environmental and climate impacts. ISRN Atmospheric Sciences, 2013. [ Links ]
Latif, M. T., Ngah, S. A., Dominick, D., Razak, I. S., Guo, X., Srithawirat, T. & Mushrifah, I. 2015. Composition and source apportionment of dust fall around a natural lake. Journal of Environmental Sciences, 33, 143-155. [ Links ]
Mahur, A., Kumar, R., Sonkawade, R., Sengupta, D. & Prasad, R. 2008. Measurement of natural radioactivity and radon exhalation rate from rock samples of Jaduguda uranium mines and its radiological implications. Nuclear Instruments and Methods in Physics Research Section B: Beam Interactions with Materials and Atoms, 266, 1591-1597. [ Links ]
Makgae, M. 2011. Key Areas in Waste Management: A South African Perspective, INTECH Open Access Publisher. [ Links ]
Maseki, J. 2013. Risk assessment of inhaled and ingested airborne particles in the vicinity of gold mine tailings: case study of the Witwatersrand Basin. M.Sc. thesis, University of Johannesburg. [ Links ]
Mccartor, A. & Becker, D. 2013. Blacksmith Institute's world worst pollution problems report 2010: top six toxic threats. Blacksmith Institute. [ Links ]
Mehra, R. & Singh, M. 2011. Measurement of radioactivity of 238U, 226Ra, 232Th and 40K in soil of different geological origins in Northern India. Journal of Environmental Protection, 2, 960. [ Links ]
Miah, A., Miah, M., Kamal, M., Chowdhury, M. & Rahmatullah, M. 2012. Natural radioactivity and associated dose rates in soil samples of Malnichera Tea Garden in Sylhet District of Bangladesh. Journal of Nuclear and Particle Physics, 2, 147-152. [ Links ]
Naja, G. M. & Volesky, B. 2009. Toxicity and sources of Pb, Cd, Hg, Cr, As, and radionuclides in the environment. Heavy metals in the environment, 8, 16-18. [ Links ]
Navas, A., Soto, J. & Machın, J. 2002. 238U, 226Ra, 210Pb, 232Th and 40K activities in soil profiles of the Flysch sector (Central Spanish Pyrenees). Applied Radiation and Isotopes, 57, 579-589. [ Links ]
NEMA: AQA 2013. National Environmental Management: Air Quality Act (39/2004): National Dust Control Regulations. No 827 of 2013, Government Gazette. 827(36974). 1 November, Government Notice 827. Cape Town: Government Printer. [ Links ]
Nogueirol, R. C., De Melo, W. J., Bertoncini, E. I. & Alleoni, L. R. F. 2013. Concentrations of Cu, Fe, Mn, and Zn in tropical soils amended with sewage sludge and composted sewage sludge. Environmental monitoring and assessment, 185, 2929-2938. [ Links ]
Odumo, O., Mustapha, A., Patel, J. & Angeyo, H. 2011. Radiological survey and assessment of associated activity concentration of the naturally occurring radioactive materials (NORM) in the Migori artisanal gold mining belt of southern Nyanza, Kenya. Applied Radiation and isotopes, 69, 912-916. [ Links ]
Oguntoke, O., Ojelede, M. E. & Annegarn, H. J. 2013. Frequency of mine dust episodes and the influence of meteorological parameters on the Witwatersrand area, South Africa. International Journal of Atmospheric Sciences, 2013. [ Links ]
Papadopoulos, A., Christofides, G., Koroneos, A. & Stoulos, S. 2014. Natural radioactivity distribution and gamma radiation exposure of beach sands from Sithonia Peninsula. Open Geosciences, 6, 229-242. [ Links ]
Papagiannis, A., Roussos, D., Menegaki, M. & Damigos, D. 2014. Externalities from lignite mining-related dust emissions. Energy Policy, 74, 414-424. [ Links ]
Pekey, H. 2006. The distribution and sources of heavy metals in Izmit Bay surface sediments affected by a polluted stream. Marine Pollution Bulletin, 52, 1197-1208. [ Links ]
Peng, X., Shi, G.-L., Zheng, J., Liu, J.-Y., Shi, X.-R., Xu, J. & Feng, Y.-C. 2016. Influence of quarry mining dust on PM 2.5 in a city adjacent to a limestone quarry: Seasonal characteristics and source contributions. Science of The Total Environment, 550, 940-949. [ Links ]
Radiation, U. N. S. C. O. T. E. O. A. UNSCEAR Report 2000, Sources and effects of ionizing radiation, vol. I Sources, Annex A, Dose assessment methodologies, Chapter III 'Atmospheric dispersion from a near-surface release'. United Nations, 2000. [ Links ]
Reimann, C. & Caritat, P. D. 2000. Intrinsic flaws of element enrichment factors (EFs) in environmental geochemistry. Environmental Science & Technology, 34, 5084-5091. [ Links ]
Reimann, C. & De Caritat, P. 2005. Distinguishing between natural and anthropogenic sources for elements in the environment: regional geochemical surveys versus enrichment factors. Science of the Total Environment, 337, 91-107. [ Links ]
Robb, L. J. & Meyer, F. M. 1995. The Witwatersrand Basin, South Africa: geological framework and mineralization processes. Ore Geology Reviews, 10, 67-94. [ Links ]
SANS 1929: 2011 South African National Standard, Ambient air quality- Limit for common pollutants. Available at: https://archive.org/details/za.sans.1929.2011 [ Links ]
Soh, K. 2016. Understanding Test and Exam Results Statistically: An Essential Guide for Teachers and School Leaders, Springer Singapore. [ Links ]
Soh, K. & Soh 2016. Understanding Test and Exam Results Statistically, Springer. [ Links ]
Sucharovà, J., Suchara, I., Hola, M., Marikova, S., Reimann, C., Boyd, R., Filzmoser, P. & Englmaier, P. 2012. Top-/bottom-soil ratios and enrichment factors: What do they really show? Applied Geochemistry, 27, 138-145. [ Links ]
Sutton, M. & Weiersbye, I. Land use after mine closure-risk assessment of gold and uranium mine residue deposits on the Eastern Witwatersrand, South Africa. Proceeding of the Third International Conference on Mine Closure, Mine closure, 2008. 14-17. [ Links ]
Sýkora, I., Holý, K., Ješkovský, M., Müllerová, M., Bulko, M. & Povinec, P. P. 2017. Long-term variations of radionuclides in the Bratislava air. Journal of environmental radioactivity, 166, 27-35. [ Links ]
Taskin, H., Karavus, M., Ay, P., Topuzoglu, A., Hidiroglu, S. & Karahan, G. 2009. Radionuclide concentrations in soil and lifetime cancer risk due to gamma radioactivity in Kirklareli, Turkey. Journal of environmental radioactivity, 100, 49-53. [ Links ]
Tholkappian, M., Ravisankar, R., Chandrasekaran, A., Jebakumar, J. P. P., Kanagasabapathy, K., Prasad, M. & Satapathy, K. 2017. Assessing heavy metal toxicity in sediments of Chennai Coast of Tamil Nadu using Energy Dispersive X-Ray Fluorescence Spectroscopy (EDXRF) with statistical approach. Toxicology Reports. [ Links ]
Tutu, H., Cukrowska, E., Mccarthy, T., Mphephu, N. & Hart, R. Determination and modelling of geochemical speciation of uranium in gold mine polluted land in South Africa. Proceedings: International Congress on Mine Water and the Environment, 2003. 137-155. [ Links ]
Van Zyl, P. G., Beukes, J. P., Du Toit, G., Mabaso, D., Hendriks, J., Vakkari, V., Tiitta, P., Pienaar, J. J., Kulmala, M. & Laakso, L. 2014. Assessment of atmospheric trace metals in the western Bushveld Igneous Complex, South Africa. South African Journal of Science, 110, 01-10. [ Links ]
Wright, C., Matooane, M., Oosthuizen, M. & Phala, N. 2014. Risk perceptions of dust and its impacts among communities living in a mining area of the Witwatersrand, South Africa. Clean Air Journal= Tydskrif vir Skoon Lug, 24, 22-27. [ Links ]
Wuana, R. A. & Okieimen, F. E. 2011. Heavy metals in contaminated soils: a review of sources, chemistry, risks and best available strategies for remediation. Isrn Ecology, 2011. [ Links ]
Sampling locations in the study area.

Test of the difference in the mean dust fallout rate across the locations and seasons
Wind pattern year average for the study area for the period 2014 - 2015 (South African Weather Services)

1Description of the data Descriptive statistics for Dust Fall out rates in the study area


